. 2019 Jul:116:292-299.
doi: 10.1016/j.trac.2019.04.022. Epub 2019 Apr 29.

Ion Mobility Spectrometry and the Omics: Distinguishing Isomers, Molecular Classes and Contaminant Ions in Complex Samples

Affiliations

Ion Mobility Spectrometry and the Omics: Distinguishing Isomers, Molecular Classes and Contaminant Ions in Complex Samples

Kristin E Burnum-Johnson et al. Trends Analyt Chem. 2019 Jul.

Abstract

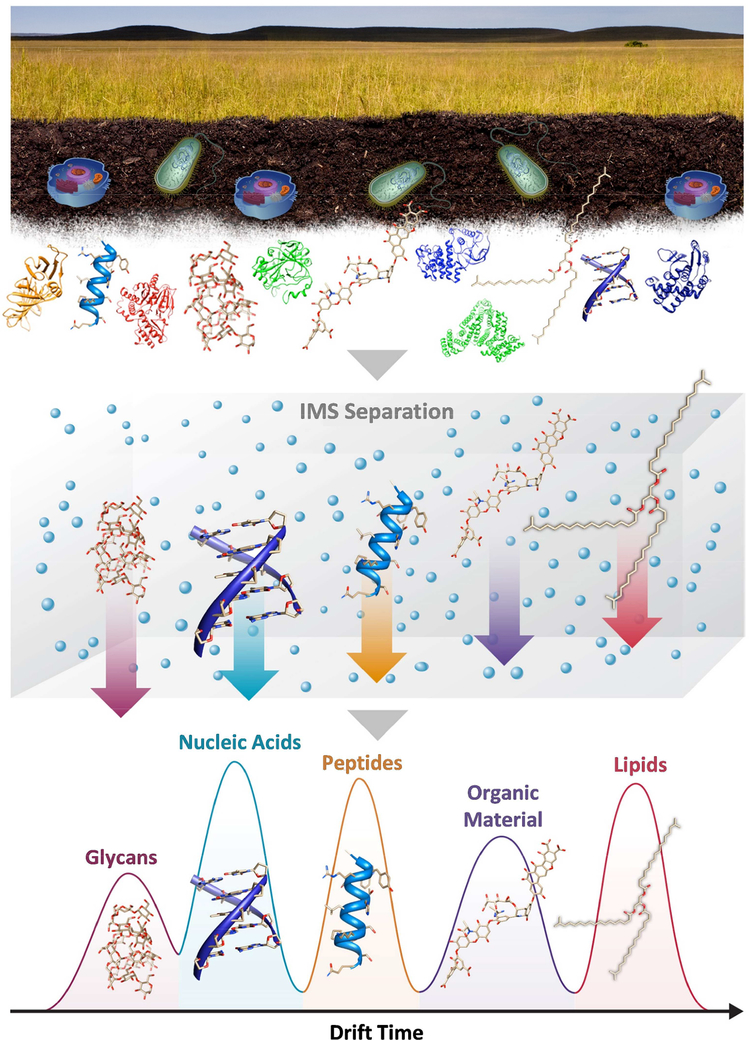
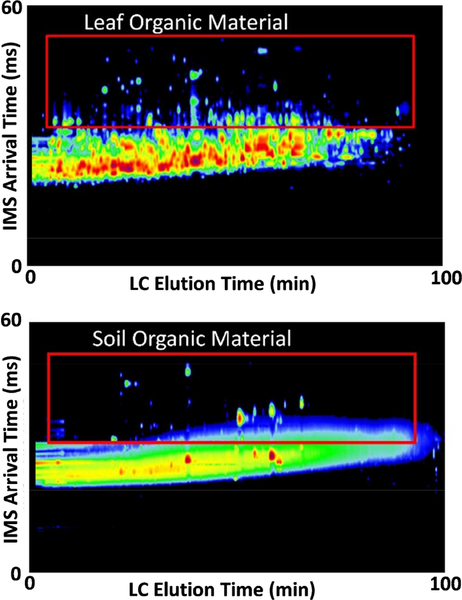
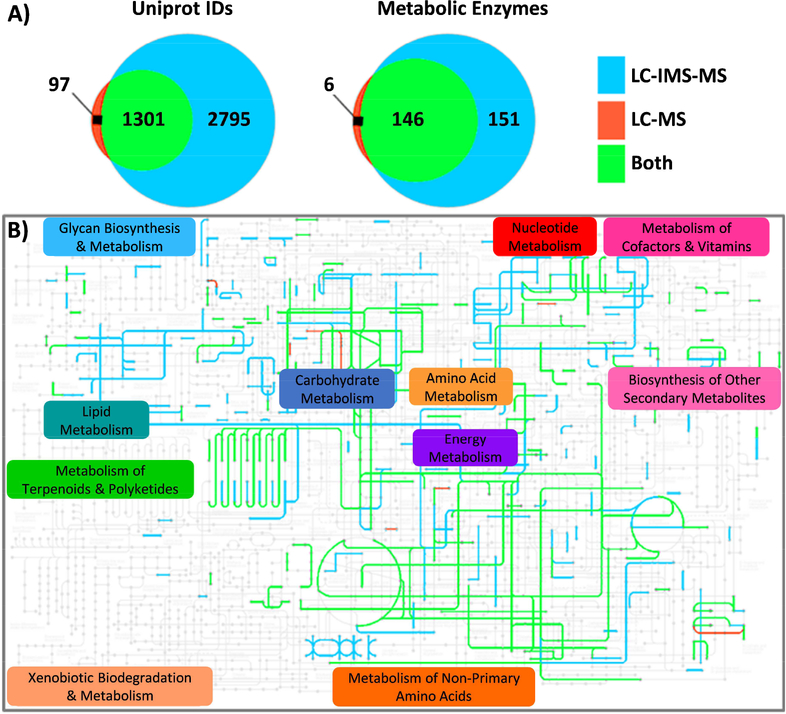
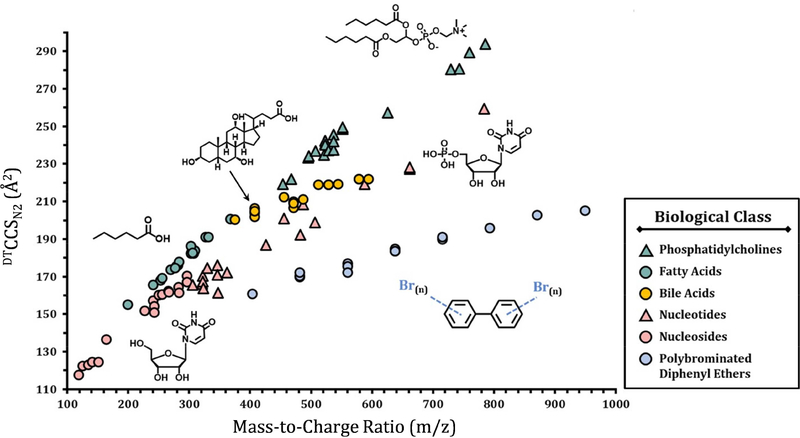
Ion mobility spectrometry (IMS) is a widely used analytical technique providing rapid gas phase separations. IMS alone is useful, but its coupling with mass spectrometry (IMS-MS) and various front-end separation techniques has greatly increased the molecular information achievable from different omic analyses. IMS-MS analyses are specifically gaining attention for improving metabolomic, lipidomic, glycomic, proteomic and exposomic analyses by increasing measurement sensitivity (e.g. S/N ratio), reducing the detection limit, and amplifying peak capacity. Numerous studies including national security-related analyses, disease screenings and environmental evaluations are illustrating that IMS-MS is able to extract information not possible with MS alone. Furthermore, IMS-MS has shown great utility in salvaging molecular information for low abundance molecules of interest when high concentration contaminant ions are present in the sample by reducing detector suppression. This review highlights how IMS-MS is currently being used in omic analyses to distinguish structurally similar molecules, isomers, molecular classes and contaminant ions.

Keywords: Exposomics; Glycomics; Ion Mobility Spectrometry; Lipidomics; Mass Spectrometry; Metabolomics; Omics; Proteomics.


Figures

Figure 1.
Figure 1.
The various molecule types present in environmental and biological samples greatly hinder comprehensive MS measurements. IMS provides a way of separating these molecule types such as glycans, nucleotides, peptides, organic material and lipids based on their structures. In this IMS evaluation, glycans traversing the IMS drift cell fastest due to their ring-based structures, while lipids are slowest due to their rigid linear backbone.
Figure 2.
Figure 2.
The LC and IMS separation of the organic material contaminant from peptides in an Arabidopsis leaf (top) and a soil sample (bottom). The IMS separation was able to move most of the organic material to a different drift space due to the different molecular structures. All molecular species are normalized to the highest concentration molecules in these plots, illustrating that the leaf peptides did not have as much interference from the organic material as the soil did.
Figure 3.
Figure 3.
Proteins identified in plasma samples contaminated with polymers from Ebola patients were compared for a LC-QExactive MS (noted as LC-MS (41)) and LC-IMS-QTOF MS (noted as LC-IMS- MS). A) Venn diagrams for the Uniprot protein IDs (left) and those that mapped to human metabolic pathways in the KEGG database (right) and identified by LC-MS only (red), LC-IMS-MS only (blue), and the overlap of both (green). All proteins were identified with at least two peptides and a requirementthat one peptide must be unique (i.e., the case of a single peptide matching only one protein in thereference database). B) The specific enzymes that mapped to the KEGG atlas using the color schemefrom A), illustrating the much higher coverage with the LC-IMS-MS analysis.
Figure 4.
Figure 4.
The distinct CCS values verses m/z trend lines for the different classes of small molecules examined with DTIMS using N2 as the drift gas. The depronated values are shown for all molecules except the phosphatidylcholines ([M+H]+) and PBDEs ([M–Br–O]).

References

    1. Borsdorf H, Eiceman GA. Ion Mobility Spectrometry: Principles and Applications. Applied Spectroscopy Reviews. 2006;41(4):323–75. doi: 10.1080/05704920600663469. - DOI
    1. Lapthorn C, Pullen F, Chowdhry BZ. Ion mobility spectrometry-mass spectrometry (IMS–MS) of small molecules: Separating and assigning structures to ions. Mass Spectrometry Reviews. 2013;32(1):43–71. doi: 10.1002/mas.21349. - DOI - PubMed
    1. Lanucara F, Holman SW, Gray CJ, Eyers CE. The power of ion mobility-mass spectrometry for structural characterization and the study of conformational dynamics. Nat Chem. 2014;6(4):281–94. doi: 10.1038/nchem.1889. - DOI - PubMed
    1. Chouinard CD, Wei MS, Beekman CR, Kemperman RHJ, Yost RA. Ion Mobility in Clinical Analysis: Current Progress and Future Perspectives. Clinical Chemistry. 2016;62(1):124–33. doi: 10.1373/clinchem.2015.238840. - DOI - PubMed
    1. May JC, Gant-Branum RL, McLean JA. Targeting the untargeted in molecular phenomics with structurally-selective ion mobility-mass spectrometry. Current opinion in biotechnology. 2016;39:192–7. doi: 10.1016/j.copbio.2016.04.013. - DOI - PMC - PubMed

LinkOut - more resources