. 2019 Nov 14;52(Pt 6):1385-1396.
doi: 10.1107/S1600576719013517. eCollection 2019 Dec 1.

Successful sample preparation for serial crystallography experiments

Affiliations

Successful sample preparation for serial crystallography experiments

John H Beale et al. J Appl Crystallogr. .

Abstract

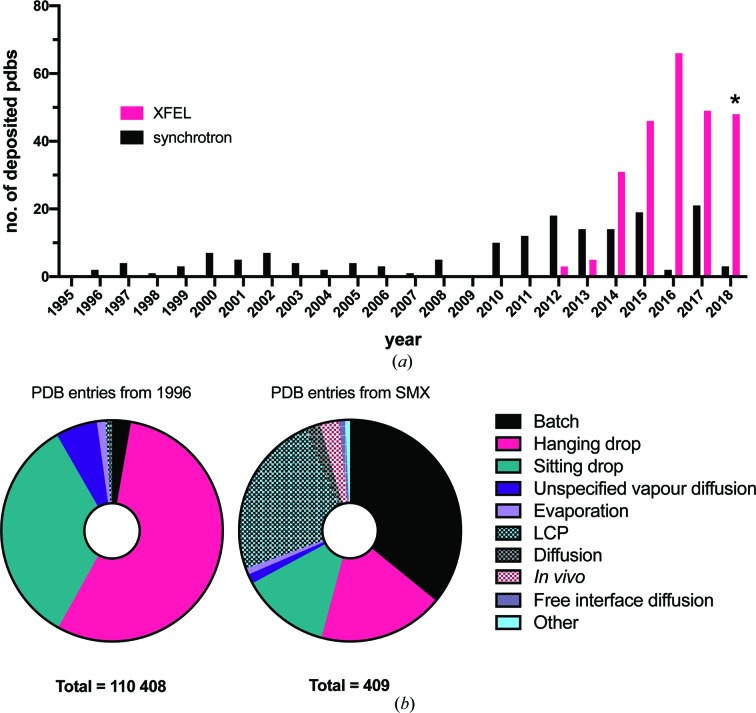
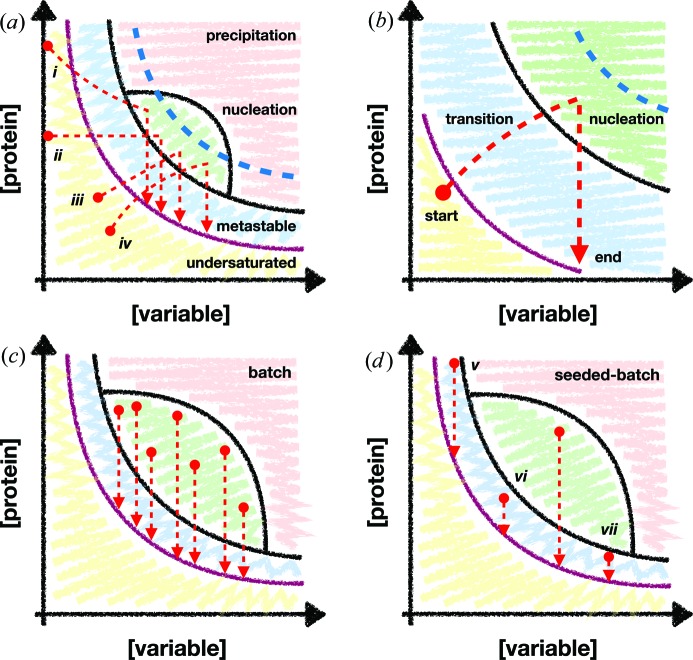
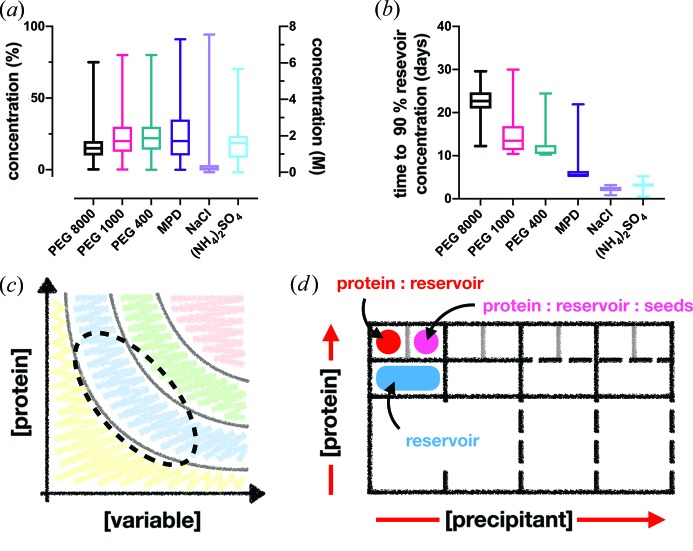
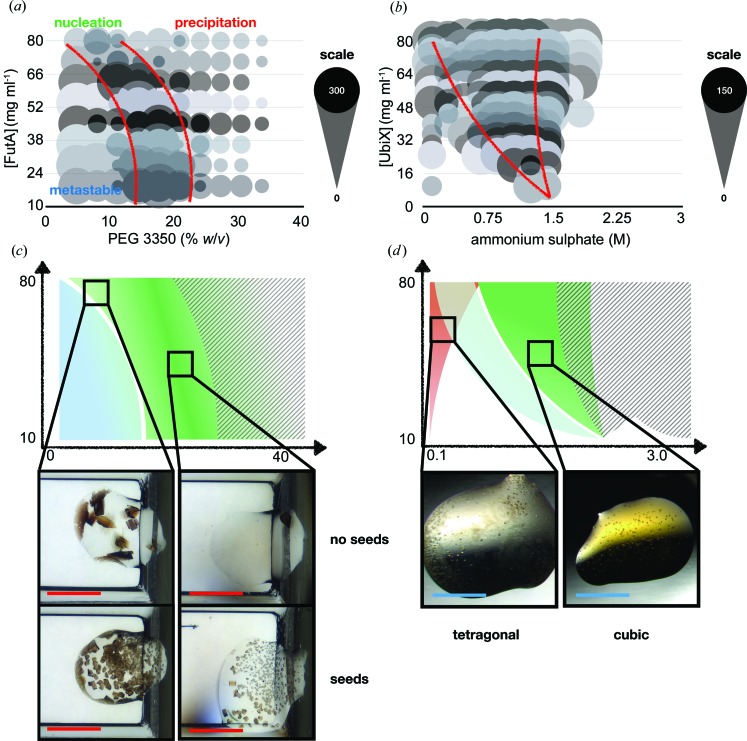
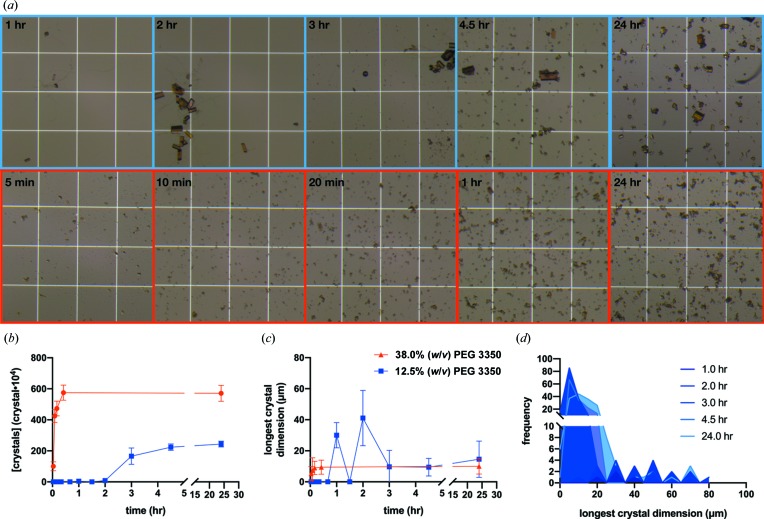
Serial crystallography, at both synchrotron and X-ray free-electron laser light sources, is becoming increasingly popular. However, the tools in the majority of crystallization laboratories are focused on producing large single crystals by vapour diffusion that fit the cryo-cooled paradigm of modern synchrotron crystallography. This paper presents several case studies and some ideas and strategies on how to perform the conversion from a single crystal grown by vapour diffusion to the many thousands of micro-crystals required for modern serial crystallography grown by batch crystallization. These case studies aim to show (i) how vapour diffusion conditions can be converted into batch by optimizing the length of time crystals take to appear; (ii) how an understanding of the crystallization phase diagram can act as a guide when designing batch crystallization protocols; and (iii) an accessible methodology when attempting to scale batch conditions to larger volumes. These methods are needed to minimize the sample preparation gap between standard rotation crystallography and dedicated serial laboratories, ultimately making serial crystallography more accessible to all crystallographers.

Keywords: XFELs; batch crystallization; micro-crystallization; serial macromolecular crystallography; vapour diffusion.


Figures

Figure 1
Figure 1
A summary of PDB depositions and crystallization methods from SMX experiments. (a) The frequency, plotted by year, of PDB depositions from serial experiments collected at XFEL and synchrotron light sources. PDB entries for this figure were selected on the basis of the number of reported crystals (>10), the reported radiation source and the indexing software used. The asterisk (*) indicates that the data from 2018 are not complete. (b) A comparison of the crystallization methods used in the PDB as a whole (left) with the serial experiments identified in panel (a) (right) over the same time period.
Figure 2
Figure 2
Examples of crystallization trajectories plotted onto phase diagrams. Protein concentration and a reservoir component ‘variable’ concentration are plotted on the y and x axes, respectively. The ‘variable’ could be any factor which may influence the crystallization experiment, e.g. PEG, salt or buffer concentration. The purple lines show the boundary of protein supersaturation [adapted from Chayen et al. (1992 ▸) ▸]. The red circles and arrows denote the starting and finishing points of a crystallization experiment. The regions of the diagram are labelled in panel (a): precipitation, nucleation, metastable and undersaturated, and these are highlighted in pink, green, blue and yellow, respectively. The blue dotted lines show the theoretical limit of nucleation-zone penetration for non-batch methods. Potential crystallization trajectories for the transitionary phase methods of free-interface diffusion (i), dialysis (ii), evaporation (iii) and vapour diffusion (iv) are highlighted. (b) Highlighting the trajectory of a vapour diffusion experiment. The components of the drop must transition from outside to inside the nucleation zone through some process. (c), (d) More diverse examples of batch and seeded-batch experiments, respectively. Batch experiments [panel (c)] are not bound by the nucleation-zone limit and can, therefore, theoretically reach every part of the region. The trajectories v, vi and vii in panel (d) show potential trajectories for growing large single crystals, micro-crystals and micro-crystals from a less-concentrated sample, respectively.
Figure 3
Figure 3
Manipulating vapour diffusion crystallization conditions into batch. (a), (b) Box-and-whisker plots of the submitted PDB precipitant concentrations from vapour diffusion crystallization experiments and their extrapolated equilibration times (time to 90% reservoir concentration), respectively. The diffusion times were calculated from data given by Forsythe et al. (2002 ▸). (c) The archetypal phase diagram, showing the likely area where the majority of vapour diffusion crystallization experiments begin (dotted line). (d) A design of a crystallization experiment in a two-drop 96-well sitting-drop plate to determine the phase diagram of the protein–precipitant mixture. One drop contains only protein and reservoir solution and the other contains protein, reservoir and seed solution, allowing the plotting of the nucleation and metastable zones, respectively.
Figure 4
Figure 4
Phase diagrams for FutA and UbiX. The raw plots for Prochlorococcus MED4 FutA and P. aeruginosa UbiX are shown in panels (a) and (b), respectively. The plots are based on two vapour diffusion crystallization experiments, with and without protein crystal seeds (see Section 4.1). The size of each circle corresponds to the approximate number of crystals observed in the crystallization drop. The opaque and shadowed circles show the number of crystals present from drops with no seeds and seeds, respectively. The red lines refer to the approximate boundaries between the different zones of the diagram. (c), (d) Representations of the plots shown in panels (a) and (b), respectively: darker shading indicates regions of higher nucleation, grey hatching shows drops where precipitation was visible, and the pink shading in the UbiX plot [panel (d)] highlights the region where a tetragonal crystal form appears. The crystallization drop images in panel (c) show the different levels of nucleation observed in both the seeded and un-seeded conditions. The images in panel (d) show the two different crystal forms of UbiX. The red and blue scale bars in the images denote 600 and 300 µm, respectively.
Figure 5
Figure 5
Observing a 100 µl FutA batch crystallization over 24 h. (a) The growth of two FutA batch crystallization experiments, the top (blue) in 0.2 M NaSCN, 12.5%(w/v) PEG 3350 and the bottom (red) in 0.1 M Tris pH 7.1, 38.0%(w/v) PEG 3350. The pictures show aliquots viewed in a hemocytometer. The white boxes in the images have dimensions of 250 × 250 µm. (b), (c) Demonstrations of how the mean number of crystals and longest dimension change over time. (d) A histogram of crystal size over 24 h for the 12.5%(w/v) PEG 3350 condition.

References

    1. Abdallah, B. G., Zatsepin, N. A., Roy-Chowdhury, S., Coe, J., Conrad, C. E., Dörner, K., Sierra, R. G., Stevenson, H. P., Camacho-Alanis, F., Grant, T. D., Nelson, G., James, D., Calero, G., Wachter, R. M., Spence, J. C. H., Weierstall, U., Fromme, P. & Ros, A. (2015). Struct. Dyn. 2, 041719. - PMC - PubMed
    1. Bergfors, T. (2003). J. Struct. Biol. 142, 66–76. - PubMed
    1. Berrow, N. S., Alderton, D., Sainsbury, S., Nettleship, J., Assenberg, R., Rahman, N., Stuart, D. I. & Owens, R. J. (2007). Nucleic Acids Res. 35, e45. - PMC - PubMed
    1. Botha, S., Nass, K., Barends, T. R. M., Kabsch, W., Latz, B., Dworkowski, F., Foucar, L., Panepucci, E., Wang, M., Shoeman, R. L., Schlichting, I. & Doak, R. B. (2015). Acta Cryst. D71, 387–397. - PubMed
    1. Brewster, A. S., Waterman, D. G., Parkhurst, J. M., Gildea, R. J., Young, I. D., O’Riordan, L. J., Yano, J., Winter, G., Evans, G. & Sauter, N. K. (2018). Acta Cryst. D74, 877–894. - PMC - PubMed