. 2019 Nov 12:13:499.
doi: 10.3389/fncel.2019.00499. eCollection 2019.

Biosensors Show the Pharmacokinetics of S-Ketamine in the Endoplasmic Reticulum

Affiliations

Biosensors Show the Pharmacokinetics of S-Ketamine in the Endoplasmic Reticulum

Kallol Bera et al. Front Cell Neurosci. .

Abstract

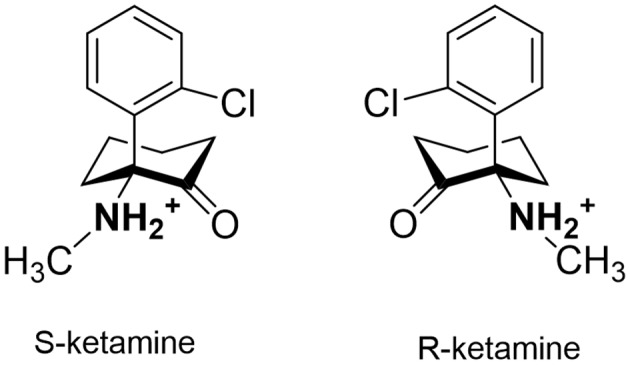
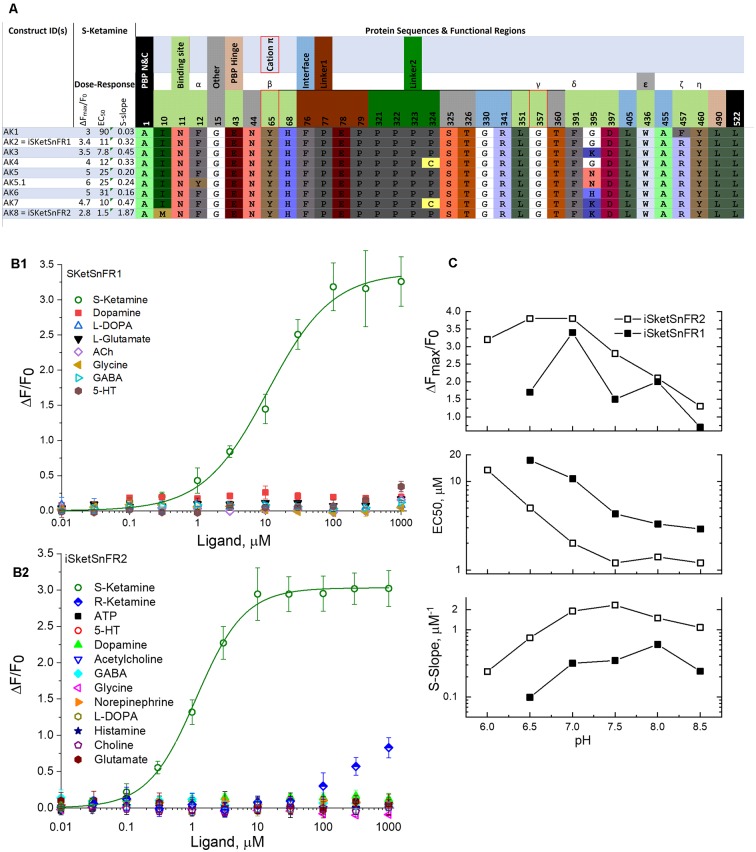
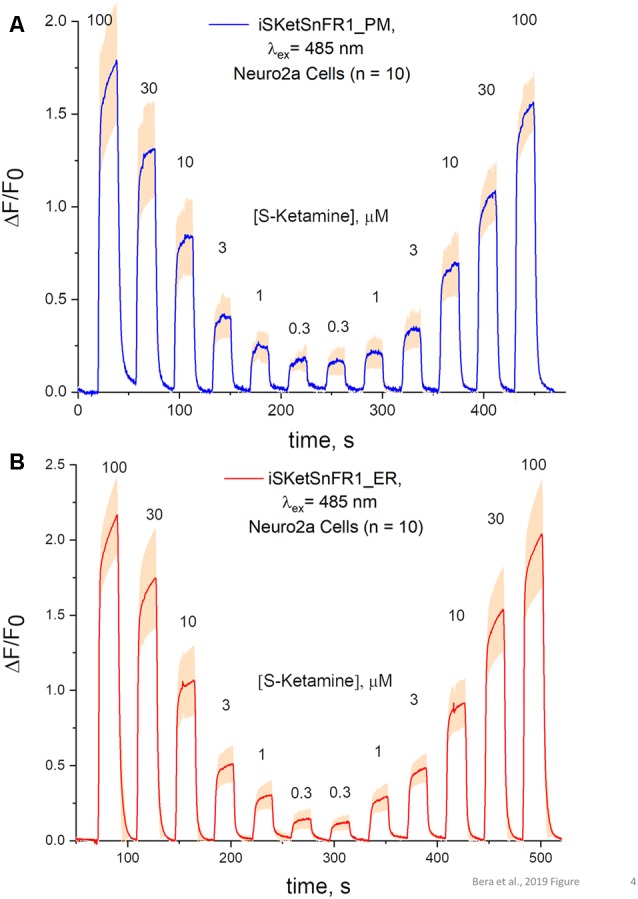
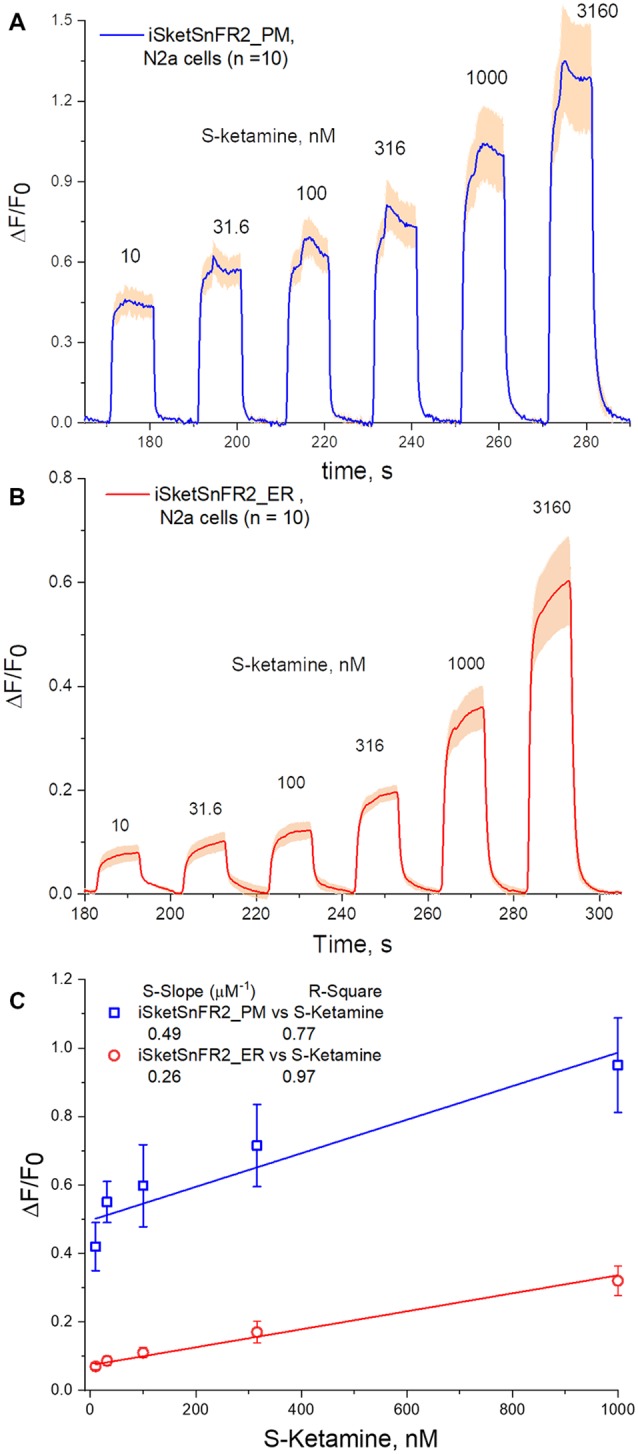
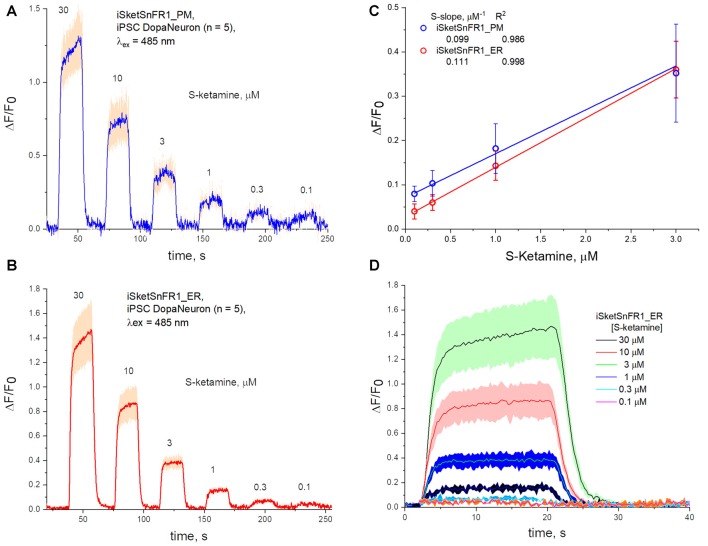
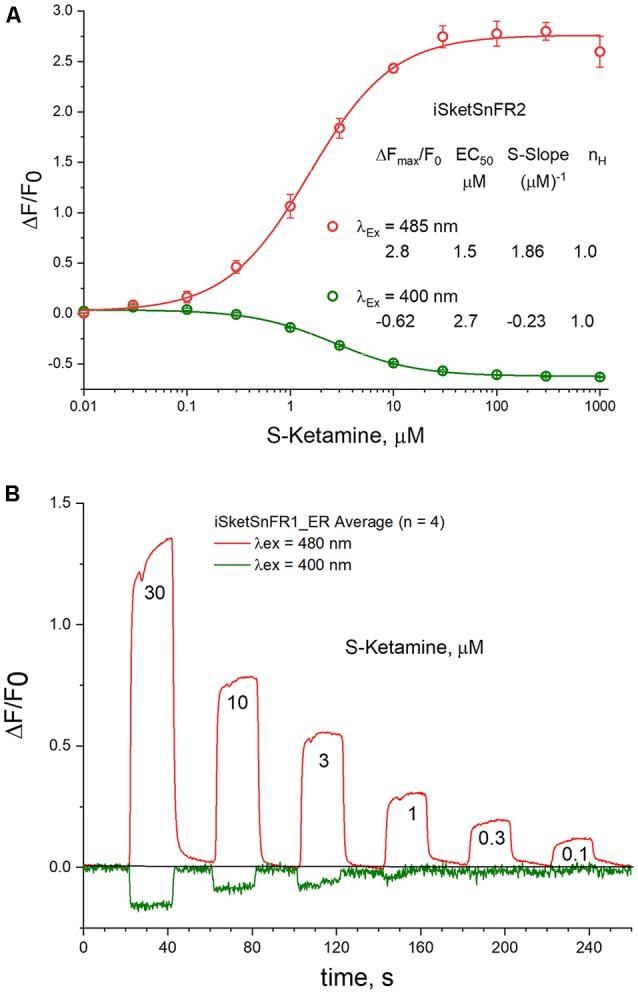
The target for the "rapid" (<24 h) antidepressant effects of S-ketamine is unknown, vitiating programs to rationally develop more effective rapid antidepressants. To describe a drug's target, one must first understand the compartments entered by the drug, at all levels-the organ, the cell, and the organelle. We have, therefore, developed molecular tools to measure the subcellular, organellar pharmacokinetics of S-ketamine. The tools are genetically encoded intensity-based S-ketamine-sensing fluorescent reporters, iSKetSnFR1 and iSKetSnFR2. In solution, these biosensors respond to S-ketamine with a sensitivity, S-slope = delta(F/F0)/(delta[S-ketamine]) of 0.23 and 1.9/μM, respectively. The iSKetSnFR2 construct allows measurements at <0.3 μM S-ketamine. The iSKetSnFR1 and iSKetSnFR2 biosensors display >100-fold selectivity over other ligands tested, including R-ketamine. We targeted each of the sensors to either the plasma membrane (PM) or the endoplasmic reticulum (ER). Measurements on these biosensors expressed in Neuro2a cells and in human dopaminergic neurons differentiated from induced pluripotent stem cells (iPSCs) show that S-ketamine enters the ER within a few seconds after appearing in the external solution near the PM, then leaves as rapidly after S-ketamine is removed from the extracellular solution. In cells, S-slopes for the ER and PM-targeted sensors differ by <2-fold, indicating that the ER [S-ketamine] is less than 2-fold different from the extracellular [S-ketamine]. Organelles represent potential compartments for the engagement of S-ketamine with its antidepressant target, and potential S-ketamine targets include organellar ion channels, receptors, and transporters.

Keywords: antidepressants; green fluorescent protein; iSketSnFR1; iSketSnFR2; inside-out pharmacology; organelles; periplasmic binding proteins (PBPs); protein engineering and design.


Figures

Figure 1
Figure 1
Structures of S-ketamine and R-ketamine.
Figure 2
Figure 2
Sequences, dose-response relations, and pH dependence of iSketSnFR1, iSketSnFR2 and related proteins. (A) Sequences of eight iKetSnFRs studied. The names iSketSnFR1 and iSketSnFR2 correspond to AK2 and AK8. Functional regions of the biosensor protein are shown as stippled cells above the sequences. Regions highlighted include those surrounding the ligand (“binding site”), the interface between the PBP and the cpGFP moiety, the two linker sequences leading from the PBP to the cpGFP, and vice versa, and the PBP hinge. The N- and C-terminal amino acids are also shown. The numbering corresponds to PDB entry 6EFR (Shivange et al., 2019). The cpGFP moiety, not shown, runs from codon 80 to 320. Greek letters denote aromatic groups that were candidates for cation-π interactions with the N-atom of the ligand (Shivange et al., 2019), and red borders denote those with the strongest evidence. The residues shown were mutated in this study or in a previous study that generated iNicSnFR biosensors. The background colors for amino acids, similar to those in JMOL, have no chemical meaning but are chosen to provide a wide, distinguishing range of colors. There is no correspondence between the background color of the stippled entries and the background color for the codons. (B1) Dose-response relations for purified iSketSnFR1, studied for various ligands at pH 7.0, 3× phosphate-buffered saline (PBS; Shivange et al., 2019). The data for S-ketamine have been fitted to the Hill equation, ΔFmax/F0 = 3.4 ± 0.1 and EC50 10.7 ± 1.5 μM, Hill coefficient (nH) = 0.91 ± 0.09. The other seven ligands tested yielded responses that were too small for systematic study. (B2) Dose-response relations for purified iSketSnFR2, studied forvarious ligands at pH 7.0, 3× PBS (Shivange et al., 2019). The data for S-ketamine have been fitted to the Hill equation, ΔFmax/F0 = 3.0 ± 0.3 and EC50 1.16 ± 0.6 μM, Hill coefficient (nH) = 1.18 ± 0.07. The other 12 ligands tested yielded responses that were too small for systematic study. (C) Dose-response parameters at varying pH values between 6.0 and 8.5, for S-ketamine at purified iSketSnFR1 and iSketSnFR2. Data are included for curve fits that gave nH values between 0.75 and 1.2 and EC50 values < 50 μM. The plots show that iSketSnFR2 has the most favorable S-slope at all pH values studied, because of both its lower EC50 and its higher ΔFmax/F0.
Figure 3
Figure 3
Confocal imaging. (A) Typical plasma membrane (PM) fluorescence pattern of a representative Neuro2a cell transfected with iSketSnFR2_PM. Panel (B) Typical intracellular fluorescence pattern of a representative Neuro2a cell transfected with iSketSnFR2_ER.
Figure 4
Figure 4
Fluorescence waveforms in Neuro2a cells transfected with iSketSnFR1 constructs. Neuro2a cells transfected with iSketSnFR1_PM or iSketSnFR1_ER were exposed to 20 s pulses of S-ketamine at varying concentrations, at intervals of 40 s. A descending concentration series was followed by an ascending series. (A) iSKetSnFR2_PM, average of 10 cells ± SEM. (B) iSketSnFR2_ER, average of 10 cells ± SEM.
Figure 5
Figure 5
Fluorescence waveforms in Neuro2a cells transfected with iSketSnFR2 constructs and exposed to sub-μM S-ketamine. Transfected Neuro2a Cells were exposed to an ascending concentration series of 10 s pulses of S-ketamine at intervals of 20 s. (A) iSKetSnFR2_PM, average of 10 cells ± SEM. (B) iSketSnFR2_ER, average of 10 cells ± SEM. (C) S-slope calculations from linear fits to the ΔF/F0 data for the final 5 s of each application.
Figure 6
Figure 6
Fluorescence waveforms in induced pluripotent stem cells (iPSCs) transfected with iKetSnFR1 constructs. Dopaminergic neurons differentiated from iPSCs were transfected with (A) iSketSnFR1_PM or (B) iSketSnFR1_ER. S-ketamine was perfused at varying concentrations for 20 s, at 38 s intervals. Average of five cells, ± SEM. (C) S-slope calculations. (D) Averaged waveforms for (B) on an expanded time axis.
Figure 7
Figure 7
485 vs. 400 nM excitation. (A) Dose-response relations in solution for iSketSnFR2, excited at 400 vs. 485 nm. (B) Live-cell imaging for iSketSnFR1, with either 485 nm or 400 nm excitation. Pulses of varying S-ketamine concentration lasting 20 s, at 40 s intervals.

References

    1. Adaikkan C., Taha E., Barrera I., David O., Rosenblum K. (2018). Calcium/calmodulin-dependent protein kinase II and eukaryotic elongation factor 2 kinase pathways mediate the antidepressant action of ketamine. Biol. Psychiatry 84, 65–75. 10.1016/j.biopsych.2017.11.028 - DOI - PubMed
    1. Autry A. E., Adachi M., Nosyreva E., Na E. S., Los M. F., Cheng P. F., et al. . (2011). NMDA receptor blockade at rest triggers rapid behavioural antidepressant responses. Nature 475, 91–95. 10.1038/nature10130 - DOI - PMC - PubMed
    1. Barnett L. M., Hughes T. E., Drobizhev M. (2017). Deciphering the molecular mechanism responsible for GCaMP6m’s Ca2+-dependent change in fluorescence. PLoS One 12:e0170934. 10.1371/journal.pone.0170934 - DOI - PMC - PubMed
    1. Berman R. M., Cappiello A., Anand A., Oren D. A., Heninger G. R., Charney D. S., et al. . (2000). Antidepressant effects of ketamine in depressed patients. Biol. Psychiatry 47, 351–354. 10.1016/s0006-3223(99)00230-9 - DOI - PubMed
    1. Beurel E., Song L., Jope R. S. (2011). Inhibition of glycogen synthase kinase-3 is necessary for the rapid antidepressant effect of ketamine in mice. Mol. Psychiatry 16, 1068–1070. 10.1038/mp.2011.47 - DOI - PMC - PubMed