. 2019 Nov 14:10:1395.
doi: 10.3389/fphys.2019.01395. eCollection 2019.

Characterising an Alternative Murine Model of Diabetic Cardiomyopathy

Affiliations

Characterising an Alternative Murine Model of Diabetic Cardiomyopathy

Mitchel Tate et al. Front Physiol. .

Erratum in

Abstract

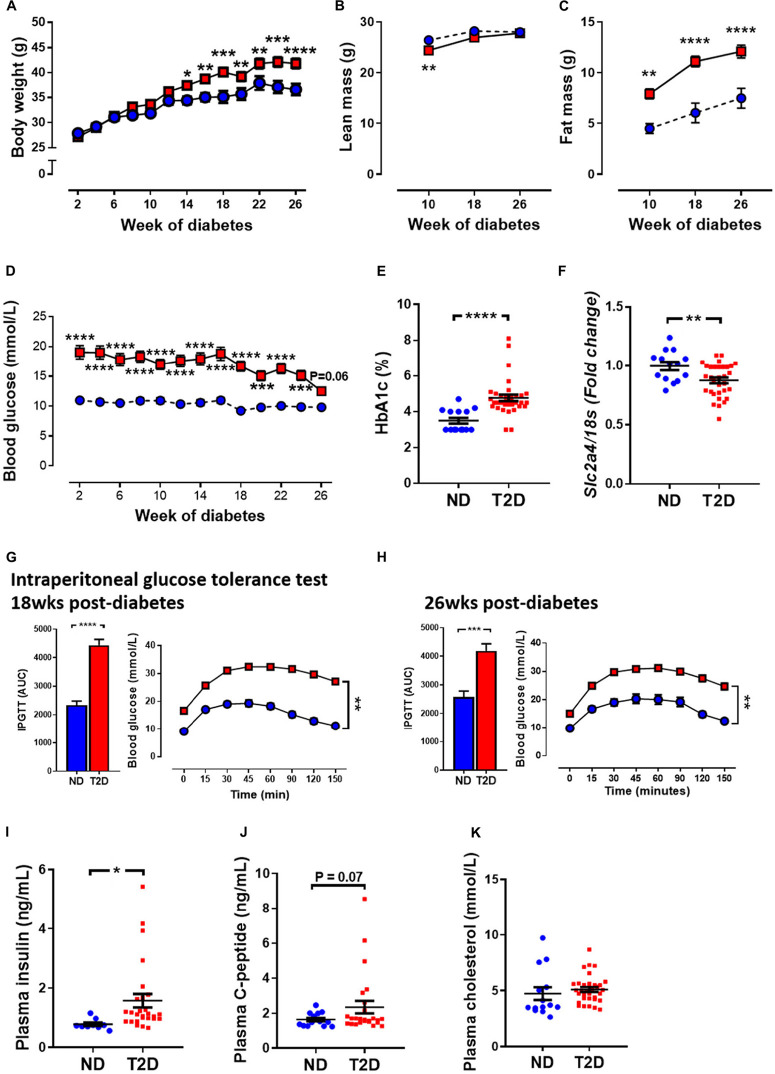
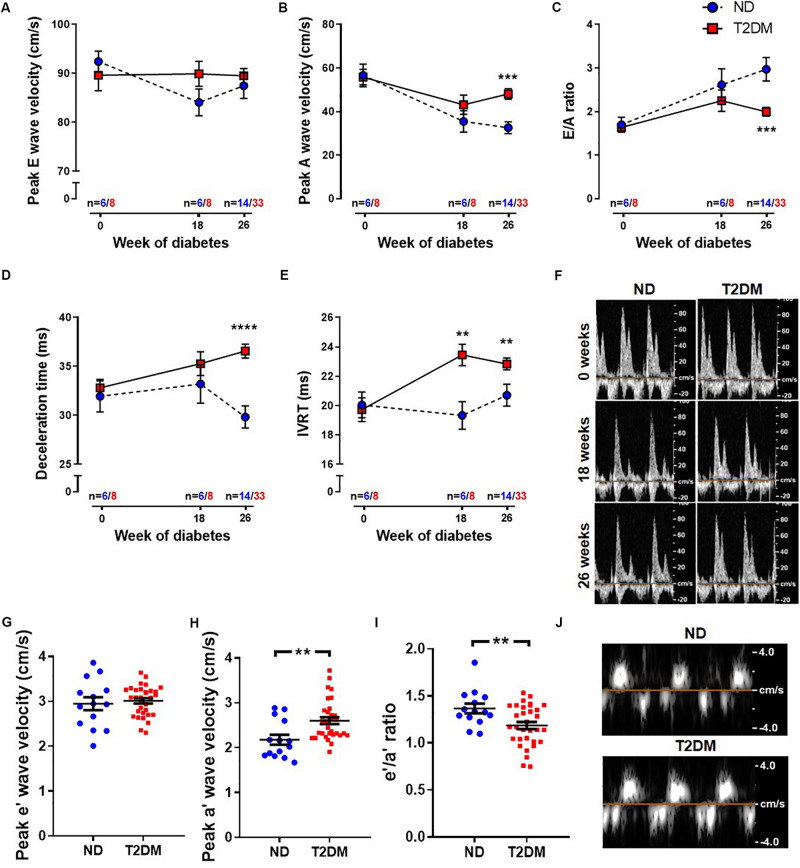
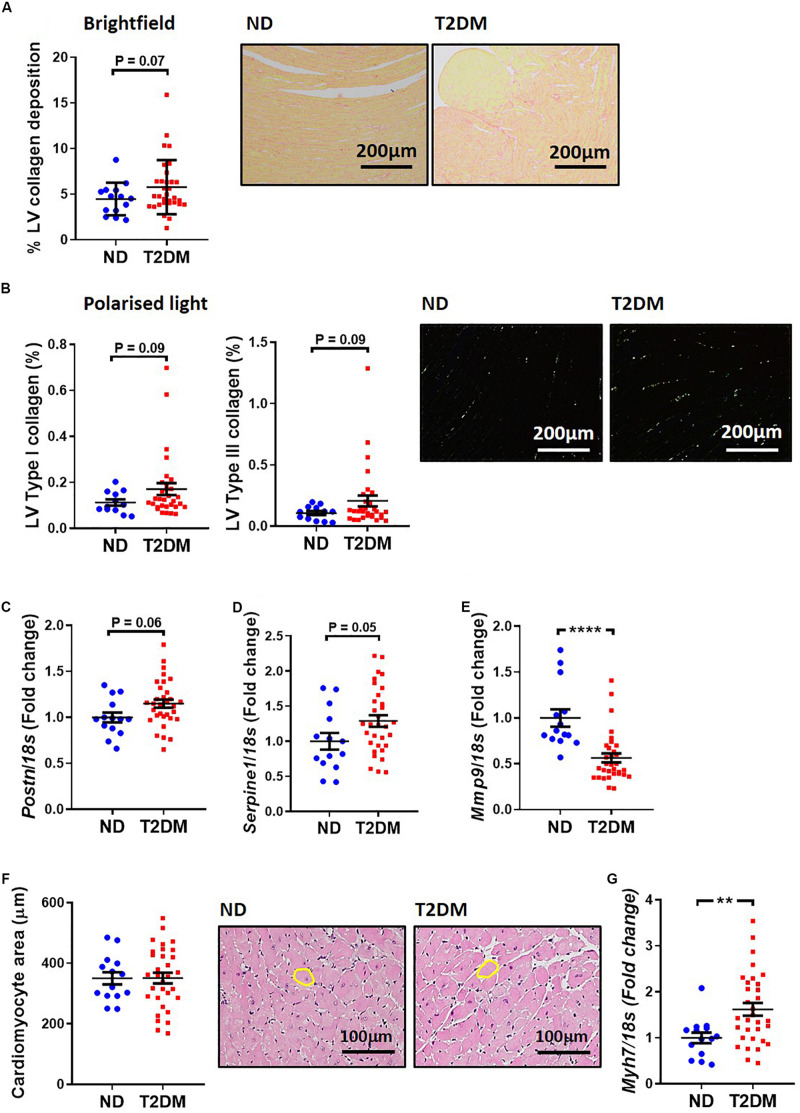
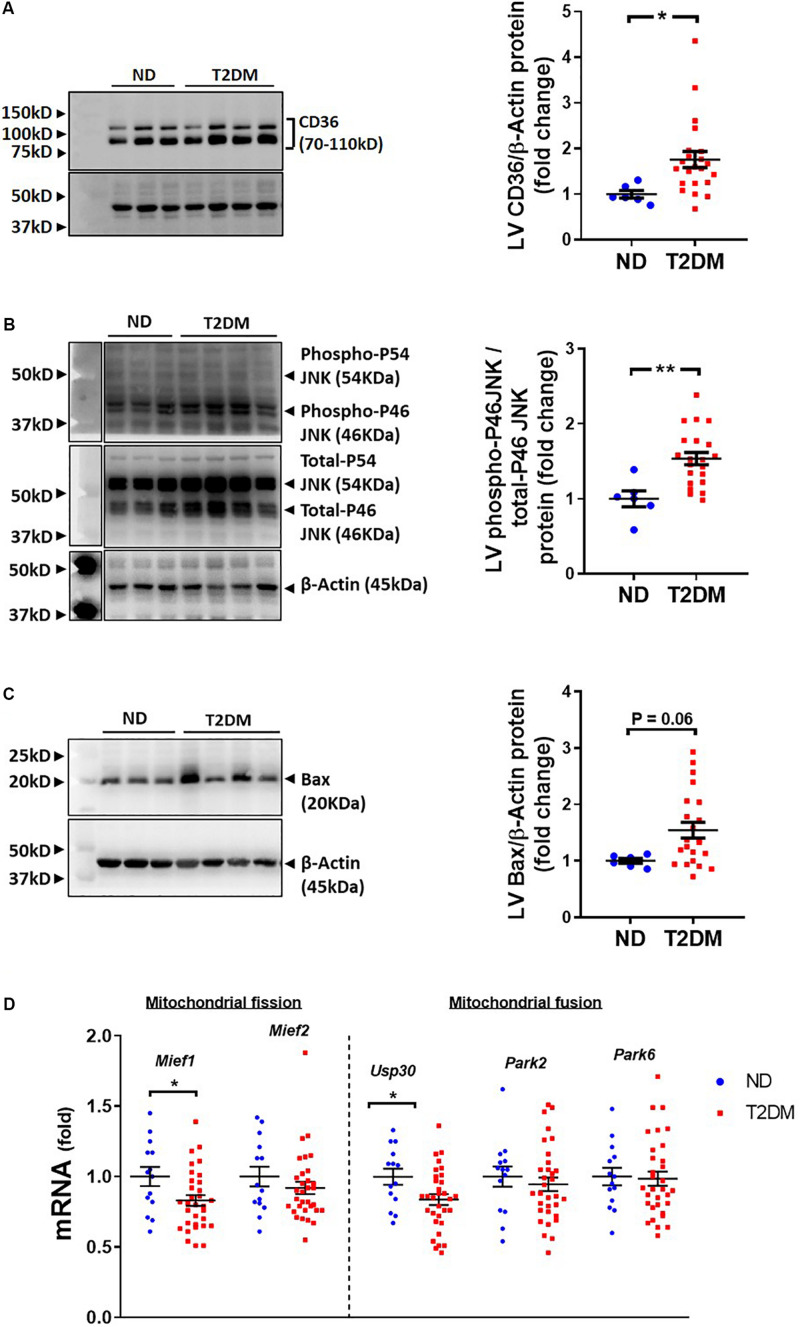
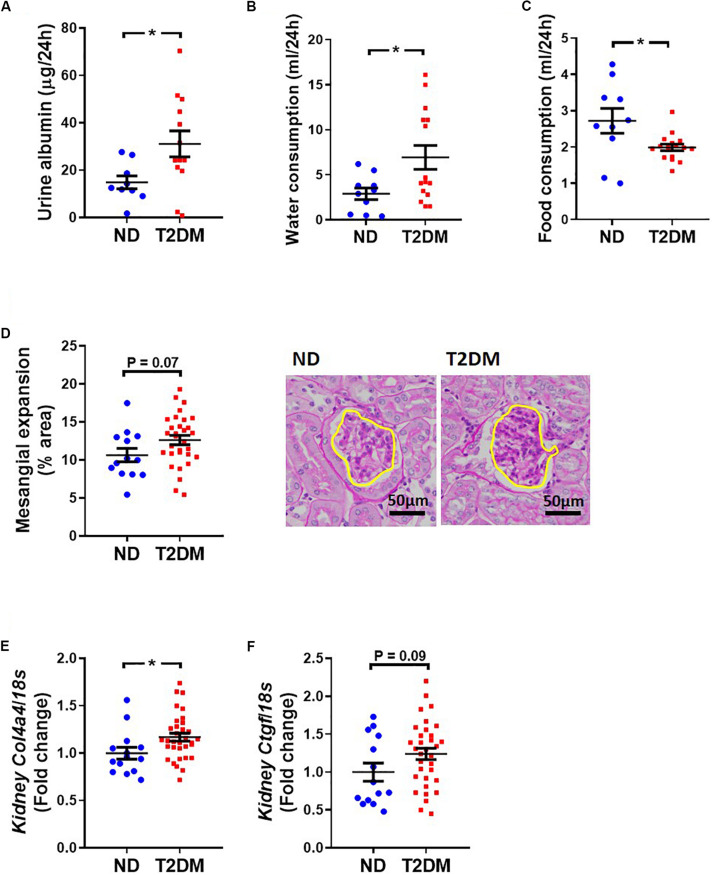
The increasing burden of heart failure globally can be partly attributed to the increased prevalence of diabetes, and the subsequent development of a distinct form of heart failure known as diabetic cardiomyopathy. Despite this, effective treatment options have remained elusive, due partly to the lack of an experimental model that adequately mimics human disease. In the current study, we combined three consecutive daily injections of low-dose streptozotocin with high-fat diet, in order to recapitulate the long-term complications of diabetes, with a specific focus on the diabetic heart. At 26 weeks of diabetes, several metabolic changes were observed including elevated blood glucose, glycated haemoglobin, plasma insulin and plasma C-peptide. Further analysis of organs commonly affected by diabetes revealed diabetic nephropathy, underlined by renal functional and structural abnormalities, as well as progressive liver damage. In addition, this protocol led to robust left ventricular diastolic dysfunction at 26 weeks with preserved systolic function, a key characteristic of patients with type 2 diabetes-induced cardiomyopathy. These observations corresponded with cardiac structural changes, namely an increase in myocardial fibrosis, as well as activation of several cardiac signalling pathways previously implicated in disease progression. It is hoped that development of an appropriate model will help to understand some the pathophysiological mechanisms underlying the accelerated progression of diabetic complications, leading ultimately to more efficacious treatment options.

Keywords: cardiac; diabetes; diabetic cardiomyopathy; experimental model; type 2 diabetes.


Figures

FIGURE 1
FIGURE 1
Effect of experimental diabetes (combining low-dose STZ and high fat diet) on metabolic characteristics. (A) Body weight, (B) lean mass, (C) fat mass, (D) blood glucose, (E) percentage glycated haemoglobin (HbA1c) and (F) LV Slc2a4 gene expression (glucose transporter GLUT4). Intraperitoneal glucose tolerance test (IPGTT) at (G) 18 weeks and (H) 26 weeks. Plasma (I) insulin, (J) C-peptide levels and (K) cholesterol at 26 weeks. Data are presented as mean ± SEM. n = 9–33 per group (note individual data points). Data analysed using unpaired t-test. P < 0.05, ∗∗P < 0.01, ∗∗∗P < 0.001, ****P < 0.0001 compared to ND. Blue circles ND; red squares T2DM. ND, non-diabetic; T2DM, type 2 diabetes; HbA1c, glycated haemoglobin; LV, left ventricle; STZ, streptozotocin, AUC, area-under-the-curve.
FIGURE 2
FIGURE 2
Effect of experimental diabetes on LV diastolic dysfunction. Quantification of (A) peak E wave velocity, (B) peak A wave velocity, (C) E/A ratio, (D) deceleration time and (E) IVRT obtained from pulsed-wave Doppler echocardiography at 0, 18 and 26 weeks of diabetes. (F) Representative mitral flow patterns from pulsed-wave Doppler echocardiography. Quantification of (G) peak e′ wave velocity, (H) peak a′ wave velocity and (I) e′/a′ ratio obtained from tissue Doppler echocardiography at 26 weeks of diabetes. (J) Representative images from tissue Doppler echocardiography. Data are presented as mean ± SEM. 0 and 18 weeks n = 6–8; 26 weeks n = 14–33 per group (note individual data points). Data analysed using unpaired t-test. P < 0.05, ∗∗P < 0.01, ∗∗∗P < 0.001, ****P < 0.0001 compared to ND. Blue circles ND; red squares T2DM. ND, non-diabetic; T2DM, type 2 diabetes; IVRT, isovolumic relaxation time.
FIGURE 3
FIGURE 3
Effect of experimental diabetes on LV structural changes. (A) Quantification of total LV interstitial collagen in picrosirius red-stained sections; representative brightfield images shown (x200 magnification). (B) Quantification of type I and type III in picrosirius red-stained sections; representative polarised light images shown (x200 magnification). LV gene expression of markers of cardiac fibrosis; (C) Postn (periostin), (D) Serpine1 (plasminogen activator inhibitor-1), (E) Mmp9 (matrix metalloproteinase 9). (F) Quantification of total LV cardiomyocyte area in haemotoxylin and eosin-stained sections; representative brightfield images shown (x200 magnification). (G) LV gene expression of cardiomyocyte hypertrophy marker Myh7 (β-myosin heavy chain). Data are presented as mean ± SEM. n = 12–31 per group (note individual data points). Data analysed using unpaired t-test. ∗∗P < 0.01, ****P < 0.0001 compared to ND. Blue circles ND; red squares T2DM. ND, non-diabetic; T2DM, type 2 diabetes; LV, left ventricle.
FIGURE 4
FIGURE 4
Effect of experimental diabetes on cardiac signalling pathways. Quantification data and representative images of western blot assessment of (A) CD36/β-Actin, (B) phospho-P46 JNK/total-P46 JNK and (C) Bax/β-Actin. Uncropped blots are included in Supplementary Figure 4. (D) LV gene expression of markers of mitochondrial fission and fusion; Mief1, Mief2, Usp30, Park2 and Park6. Data are presented as mean ± SEM. n = 6–22 per group (note individual data points). Data analysed using unpaired t-test. P < 0.05, ∗∗P < 0.01, ∗∗∗P < 0.001, ****P < 0.0001 compared to ND. Blue circles ND; red squares T2DM. ND, non-diabetic; T2DM, type 2 diabetes; LV, left ventricle.
FIGURE 5
FIGURE 5
Effect of experimental diabetes on liver structure and function. Plasma (A) alanine aminotransferase (ALT) and (B) aspartate aminotransferase (AST) at 26 weeks. (C) Liver Cd36 gene expression. (D) Representative images of liver haemotoxylin and eosin staining, (E) grade of steatosis and (F) NAFLD activity scoring. Liver (G) Ccl2 (monocyte chemoattractant protein 1), (H) ProCol3 (procollagen 3) and (I) Postn (periostin) gene expression. Data are presented as mean ± SEM. n = 8–33 per group (note individual data points). Data analysed using unpaired t-test. P < 0.05, ∗∗P < 0.01, ****P < 0.0001 compared to ND. Blue circles ND; red squares T2DM. ND, non-diabetic; T2DM, type 2 diabetes; NAFLD, non-alcoholic fatty liver disease; NAS, NAFLD activity score.
FIGURE 6
FIGURE 6
Effect on experimental diabetes on kidney structure and function. (A) Twenty four-hour urinary albumin excretion. Metabolic caging assessment of (B) food and (C) water consumption. (D) PAS stained glomeruli to assess mesangial expansion; mean data and representative images (x400 magnification). Kidney (E) Col4a4 (collagen IV) and (F) Ctgf (CTGF) gene expression. Data are presented as mean ± SEM. n = 9–33 per group (note individual data points). Data analysed using unpaired t-test. P < 0.05 compared to ND. Blue circles ND; red squares T2DM. ND, non-diabetic; T2DM, type 2 diabetes; CTGF, connective tissue growth factor; PAS, periodic acid–Schiff.

Similar articles

Cited by

References

    1. Adler A. I., Boyko E. J., Ahroni J. H., Stensel V., Forsberg R. C., Smith D. G. (1997). Risk factors for diabetic peripheral sensory neuropathy. results of the seattle prospective diabetic foot study. Diabetes Care 20 1162–1167. 10.2337/diacare.20.7.1162 - DOI - PubMed
    1. Barrière D. A., Noll C., Roussy G., Lizotte F., Kessai A., Kirby K., et al. (2018). Combination of high-fat/high-fructose diet and low-dose streptozotocin to model long-term type-2 diabetes complications. Sci. Rep. 8:424. 10.1038/s41598-017-18896-5 - DOI - PMC - PubMed
    1. De Blasio M.J., Ramalingam A., Cao A. H., Prakoso D., Ye J.-M., Pickering R., et al. (2017). The superoxide dismutase mimetic tempol blunts diabetes-induced upregulation of NADPH oxidase and endoplasmic reticulum stress in a rat model of diabetic nephropathy. Eur. J. Pharmacol. 807 12–20. 10.1016/j.ejphar.2017.04.026 - DOI - PubMed
    1. Di Bonito P., Moio N., Cavuto L., Covino G., Murena E., Scilla C., et al. (2005). Early detection of diabetic cardiomyopathy, usefulness of tissue doppler imaging. Diabet. Med. 22 1720–1725. 10.1111/j.1464-5491.2005.01685.x - DOI - PubMed
    1. Boudina S., Abel E.D. (2007). Diabetic cardiomyopathy revisited. Circulation 115 3213–3223. 10.1161/circulationaha.106.679597 - DOI - PubMed

LinkOut - more resources