

Critical Orientation in the Jungle of Currently Available Methods and Types of Data for Source Attribution of Foodborne Diseases
- PMID: 31798549
- PMCID: PMC6861836
- DOI: 10.3389/fmicb.2019.02578
Critical Orientation in the Jungle of Currently Available Methods and Types of Data for Source Attribution of Foodborne Diseases
Abstract
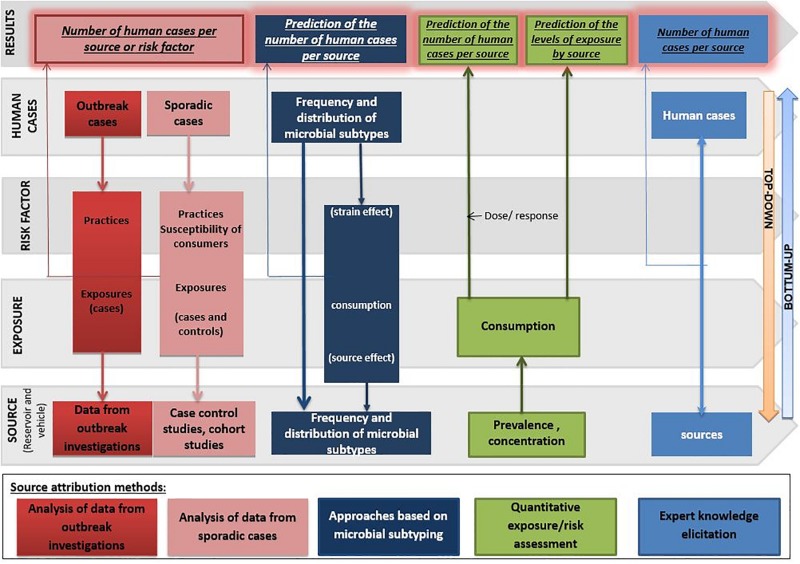
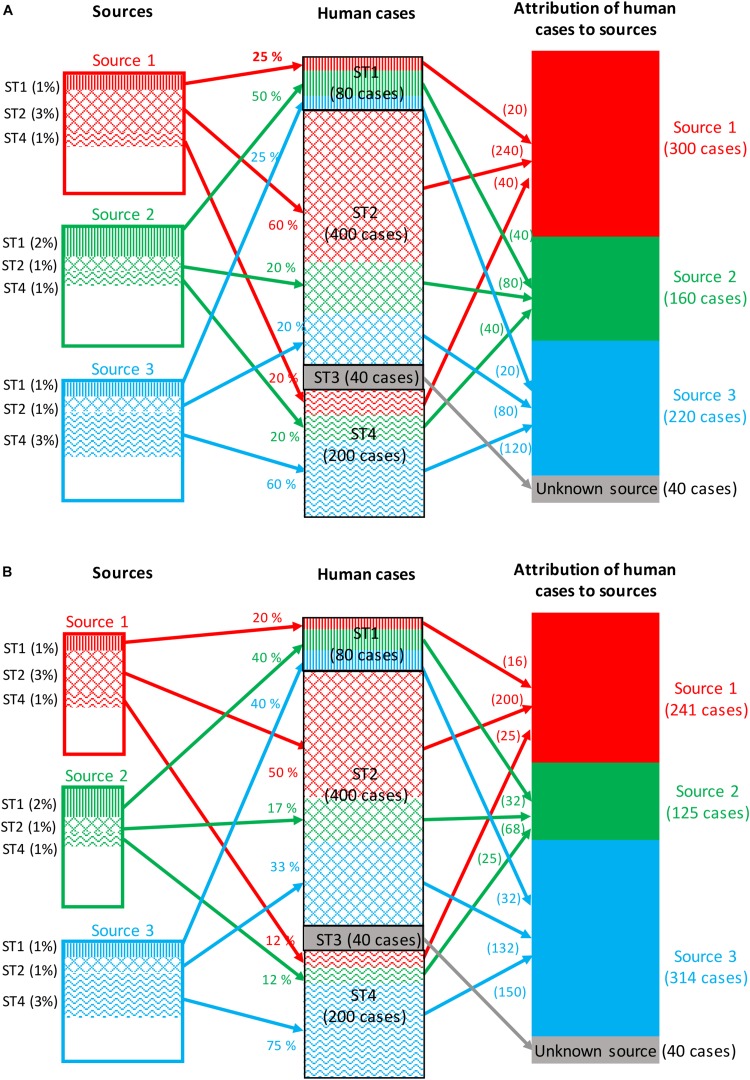
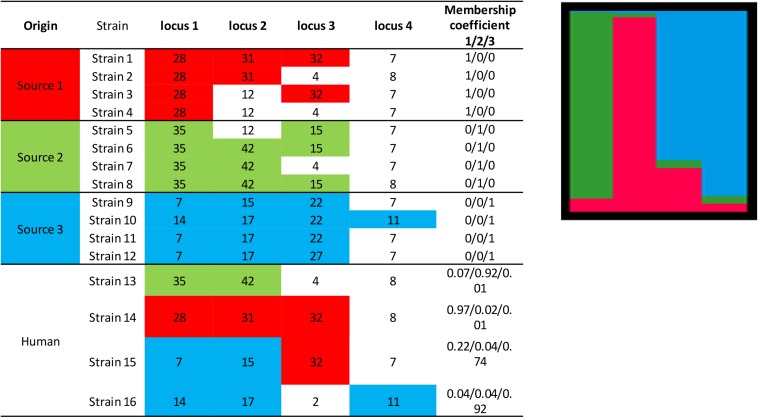
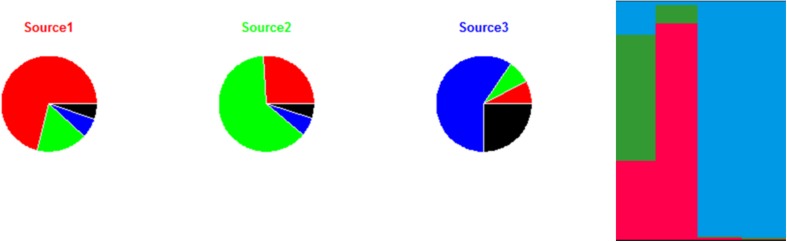
With increased interest in source attribution of foodborne pathogens, there is a need to sort and assess the applicability of currently available methods. Herewith we reviewed the most frequently applied methods for source attribution of foodborne diseases, discussing their main strengths and weaknesses to be considered when choosing the most appropriate methods based on the type, quality, and quantity of data available, the research questions to be addressed, and the (epidemiological and microbiological) characteristics of the pathogens in question. A variety of source attribution approaches have been applied in recent years. These methods can be defined as top-down, bottom-up, or combined. Top-down approaches assign the human cases back to their sources of infection based on epidemiological (e.g., outbreak data analysis, case-control/cohort studies, etc.), microbiological (i.e., microbial subtyping), or combined (e.g., the so-called 'source-assigned case-control study' design) methods. Methods based on microbial subtyping are further differentiable according to the modeling framework adopted as frequency-matching (e.g., the Dutch and Danish models) or population genetics (e.g., Asymmetric Island Models and STRUCTURE) models, relying on the modeling of either phenotyping or genotyping data of pathogen strains from human cases and putative sources. Conversely, bottom-up approaches like comparative exposure assessment start from the level of contamination (prevalence and concentration) of a given pathogen in each source, and then go upwards in the transmission chain incorporating factors related to human exposure to these sources and dose-response relationships. Other approaches are intervention studies, including 'natural experiments,' and expert elicitations. A number of methodological challenges concerning all these approaches are discussed. In absence of an universally agreed upon 'gold' standard, i.e., a single method that satisfies all situations and needs for all pathogens, combining different approaches or applying them in a comparative fashion seems to be a promising way forward.
Keywords: epidemiological studies; expert knowledge elicitation; foodborne pathogen; frequency-matching models; population genetics models; quantitative risk assessment; source attribution; typing methods.
Copyright © 2019 Mughini-Gras, Kooh, Fravalo, Augustin, Guillier, David, Thébault, Carlin, Leclercq, Jourdan-Da-Silva, Pavio, Villena, Sanaa and Watier.
Figures
References
-
- Audurier A., Chatelain R., Chalons F., Piechaud M. (1979). [Bacteriophage typing of 823 Listeria monocytogenes strains isolated in france from 1958 to 1978 (author’s transl)]. Ann. Microbiol. 130b 179–189. - PubMed
-
- Barco L., Barrucci F., Cortini E., Ramon E., Olsen J. E., Luzzi I., et al. (2015). Ascertaining the relationship between Salmonella Typhimurium and Salmonella 4,[5],12:i:- by MLVA and inferring the sources of human Salmonellosis due to the two serovars in Italy. Front. Microbiol. 6:301 10.3389/fmicb.2015.00301 - DOI - PMC - PubMed
Publication types
LinkOut - more resources
Full Text Sources