. 2019 Oct 11;10(11):5675-5686.
doi: 10.1364/BOE.10.005675. eCollection 2019 Nov 1.

In vivo corneal endothelium imaging using ultrahigh resolution OCT

Affiliations

In vivo corneal endothelium imaging using ultrahigh resolution OCT

Xinwen Yao et al. Biomed Opt Express. .

Abstract

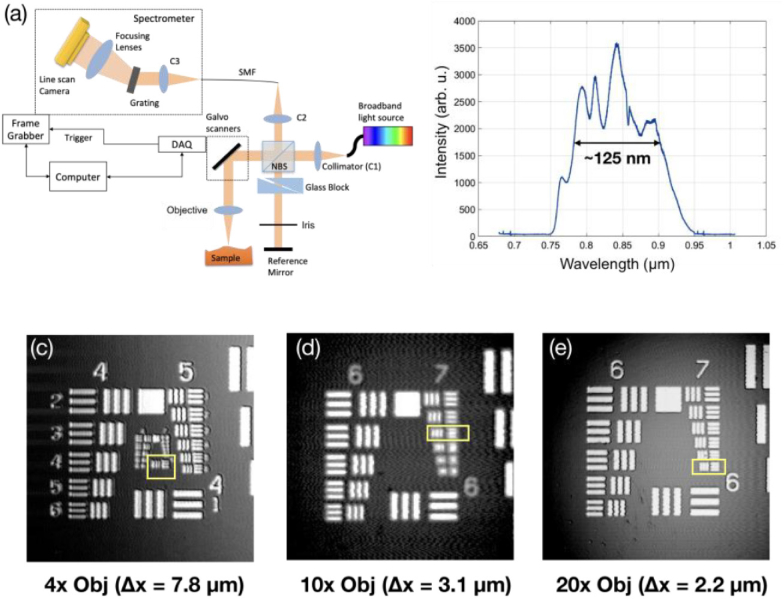
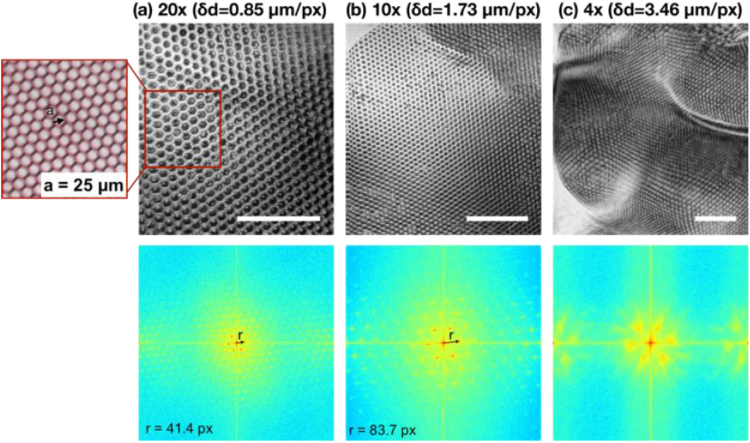
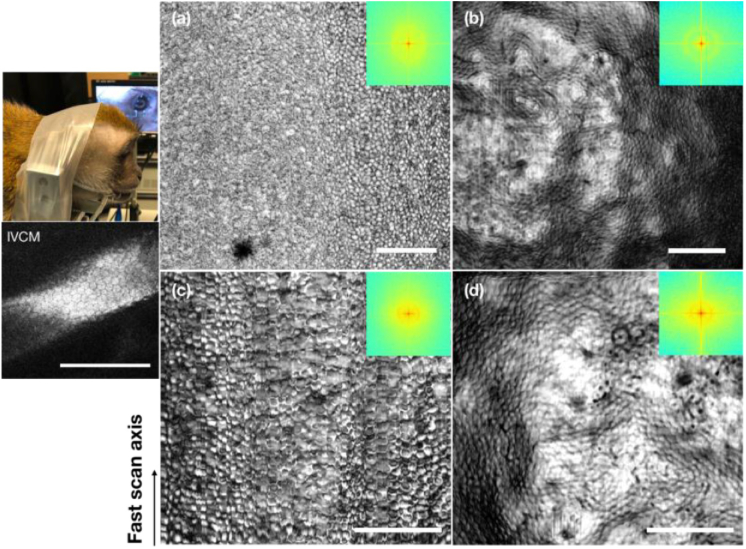
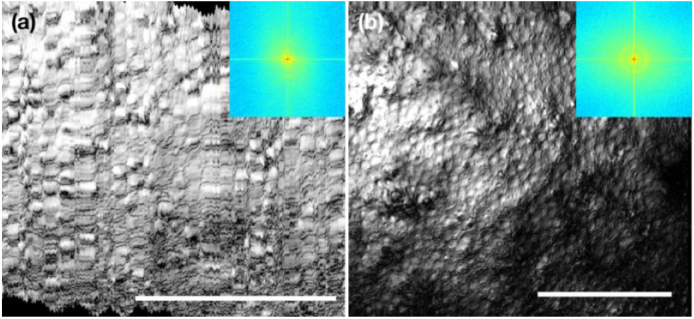
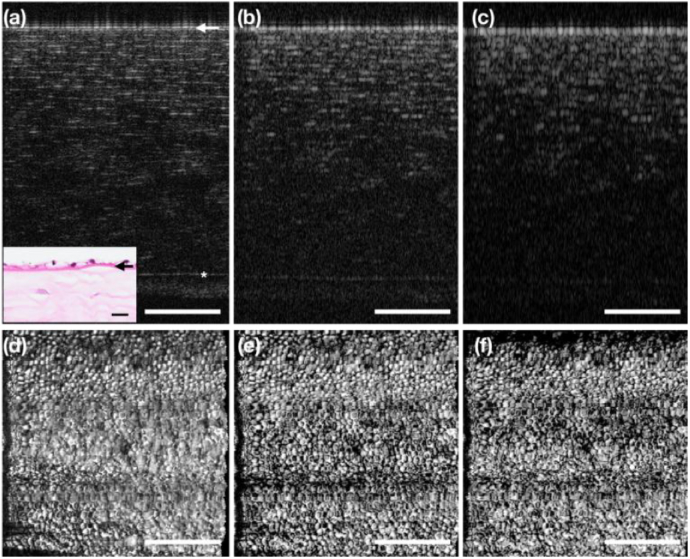
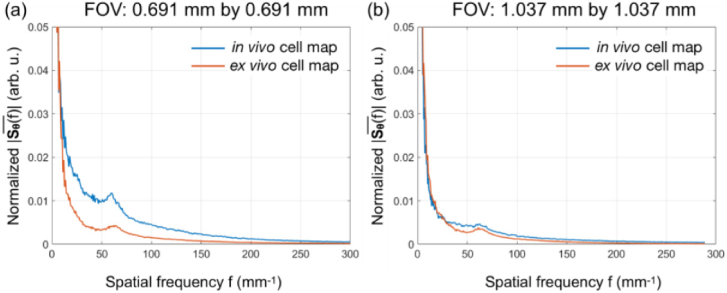
We investigate the influence of optical coherence tomography (OCT) system resolution on high-quality in vivo en face corneal endothelial cell images of the monkey eye, to allow for quantitative analysis of cell density. We vary the lateral resolution of the ultrahigh resolution (UHR) OCT system (centered at 850 nm) by using different objectives, and the axial resolution by windowing the source spectrum. By suppressing the motion of the animal, we are able to obtain a high-quality en face corneal endothelial cell map in vivo using UHR OCT for the first time with a lateral resolution of 3.1 µm. Increasing lateral resolution did not result in a better image quality but a smaller field of view (FOV), and the axial resolution had little impact on the visualization of corneal endothelial cells. Quantitative analysis of cell density was performed on in vivo en face OCT images of corneal endothelial cells, and the results are in agreement with previously reported data. Our study may offer a practical guideline for designing OCT systems that allow for in vivo corneal endothelial cell imaging with high quality.


Conflict of interest statement

The authors declare that there are no conflicts of interest related to this article.

Figures

Fig. 1.
Fig. 1.
(a) The schematic of the UHR SD-OCT system. (b) The source spectrum read from the spectrometer. (c) (d) (e) The 1951 USAF resolution target imaged with 4x, 10x, and 20x objectives, respectively. The lateral resolution for each objective is read out as the line width of the last resolvable group, which is 7.8 µm, 3.1 µm, and 2.2 µm for 4x, 10x, and 20x objective respectively.
Fig. 2.
Fig. 2.
En face OCT images as well as its corresponding spatial frequency spectra of the hexagonal grid taken with (a) 20X, (b) 10X, and (c) 4X objectives, respectively. The spatial sampling interval was 0.85 µm, 1.73 µm, and 3.46 µm for 20X, 10X, and 4X objectives, respectively. The characteristic frequency, marked by “r”, was measured to be 42.4/1024 px−1 and 83.7/1024 px−1 for 20X and 10X maps, respectively. The 4X objective failed to resolve the periodic grid patterns and therefore the characteristic frequency was not given here. Inset: white light camera image of the hexagonal grid. Scale bar: 200 µm.
Fig. 3.
Fig. 3.
Monkey corneal endothelial cell maps acquired using the 10X objective (a) (c) in vivo and (b) (d) ex vivo. (a) (b) FOV: 1.037 mm by 1.037 mm. (c) (d) FOV: 0.691 mm by 0.691 mm. Left top: animal management for in vivo imaging. Left bottom: the IVCM image of the same eye. Arrow: fast scan direction. Insets: spatial frequency spectra of the corresponding en face cell maps. Scale bar: 200 µm.
Fig. 4.
Fig. 4.
Monkey corneal endothelial cell maps acquired using the 20X objective (a) in vivo and (b) ex vivo, with a FOV of 0.343 mm by 0.343 mm and 0.510 mm by 0.510 mm, respectively. Insets: spatial frequency spectra of the corresponding en face cell maps. Scale bar: 200 µm.
Fig. 5.
Fig. 5.
The impact of OCT axial resolution on en face visualization of corneal endothelial cell map. (a) Representative OCT B-scan of the Monkey cornea with the original axial resolution (∼ 2 µm in tissue). (b) The same B-scan with the axial resolution reduced by half (∼4 µm in tissue) and (c) quarter (∼ 8 µm in tissue). (d)–(f) The en face corneal endothelial cell images generated from the MP of the endothelial layer stacks of the respective volumes with different axial resolutions. Inset: histology slide of the cornea. The star (*) indicates the Bowman’s layer, and the arrow indicates the Descemet’s membrane. Scale bar: 200 µm
Fig. 6.
Fig. 6.
The averaged radial power spectra reconstructed from the 2D FFT maps for in vivo and ex vivo corneal endothelial cell maps with FOV of (a) 0.691 mm by 0.691 mm and (b) 1.037 mm by 1.037 mm). In (a), salient peaks were observed at f = 60.3 mm−1 and 61.9 mm−1 for in vivo and ex vivo images, respectively. In (b), less salient peaks were observed at f = 62.2 mm−1 and 61.0 mm−1 for in vivo and ex vivo images, respectively.

References

    1. Park C. Y., Lee J. K., Gore P. K., Lim C.-Y., Chuck R. S., “Keratoplasty in the United States: a 10-year review from 2005 through 2014,” Ophthalmology 122(12), 2432–2442 (2015).10.1016/j.ophtha.2015.08.017 - DOI - PubMed
    1. Woo J. H., Ang M., Htoon H. M., Tan D. T., “Descemet membrane endothelial keratoplasty versus descemet stripping automated endothelial keratoplasty and penetrating keratoplasty,” Am. J. Ophthalmol. 207, 288–303 (2019).10.1016/j.ajo.2019.06.012 - DOI - PubMed
    1. Ang M., Wilkins M. R., Mehta J. S., Tan D., “Descemet membrane endothelial keratoplasty,” Br. J. Ophthalmol. 100(1), 15–21 (2016).10.1136/bjophthalmol-2015-306837 - DOI - PubMed
    1. Ang M., Mehta J. S., Lim F., Bose S., Htoon H. M., Tan D., “Endothelial cell loss and graft survival after Descemet's stripping automated endothelial keratoplasty and penetrating keratoplasty,” Ophthalmology 119(11), 2239–2244 (2012).10.1016/j.ophtha.2012.06.012 - DOI - PubMed
    1. Bourne W. M., Kaufman H. E., “Specular microscopy of human corneal endothelium in vivo,” Am. J. Ophthalmol. 81(3), 319–323 (1976).10.1016/0002-9394(76)90247-6 - DOI - PubMed

LinkOut - more resources