. 2019 Oct 31;10(11):5974-5988.
doi: 10.1364/BOE.10.005974. eCollection 2019 Nov 1.

Imaging hair cells through laser-ablated cochlear bone

Affiliations

Imaging hair cells through laser-ablated cochlear bone

Marilisa Romito et al. Biomed Opt Express. .

Abstract

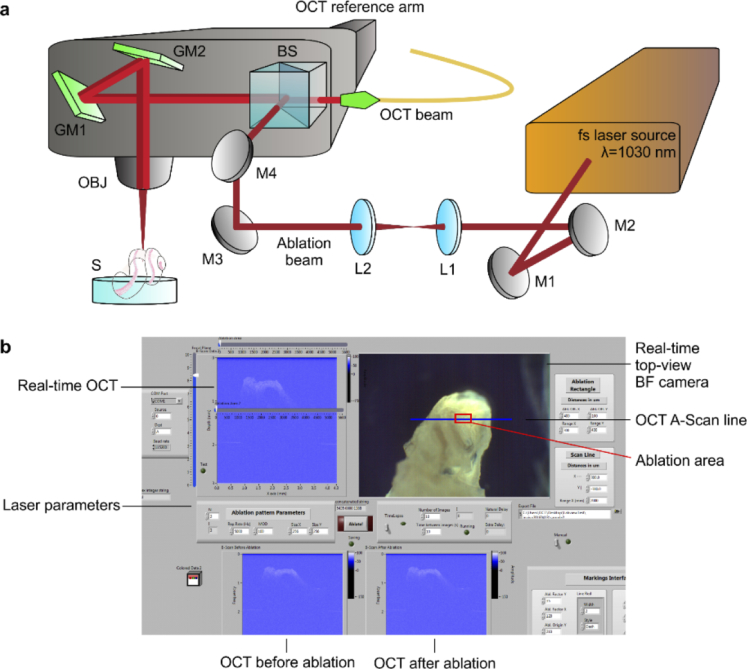
We report an innovative technique for the visualization of cells through an overlying scattering medium by combining femtosecond laser bone ablation and two-photon excitation fluorescence (TPEF) microscopy. We demonstrate the technique by imaging hair cells in an intact mouse cochlea ex vivo. Intracochlear imaging is important for the assessment of hearing disorders. However, the small size of the cochlea and its encasement in the densest bone in the body present challenging obstacles, preventing the visualization of the intracochlear microanatomy using standard clinical imaging modalities. The controlled laser ablation reduces the optical scattering of the cochlear bone while the TPEF allows visualization of individual cells behind the bone. We implemented optical coherence tomography (OCT) simultaneously with the laser ablation to enhance the precision of the ablation and prevent inadvertent damage to the cells behind the bone.


Conflict of interest statement

The authors declare no conflicts of interest.

Figures

Fig. 1.
Fig. 1.
Experimental setup for ultrafast laser ablation of cochlear bone. (a) Laser ablation setup combined with the OCT system. The ablation beam is expanded, collimated and directed into the OCT head. After the beamsplitter (BS), both OCT beam and ablation beam reach a pair of galvanometric mirrors (GM1 and GM2) and are then redirected toward the focusing objective (OBJ) onto the sample (S). L1 and L2, lenses. M1-M4, mirrors. (b) User interface for the control of laser ablation. The interface allows the control of simultaneous real time OCT and BF imaging systems, the choice of the laser parameters for ablation, the selection of the targeted area and the OCT imaging comparison of the sample before and after ablation.
Fig. 2.
Fig. 2.
Preparation of a whole mount sample covered with a bony chip for TPEF efficiency studies. (a) Sectional sketch of the sample. The whole mount includes a fixed OC stained with Rhodamine 6G and placed between two microscope slides (in blue). The bony chip varies in thickness (based on precise laser ablation) and is placed on the coverslipped whole mount. (b) Schematic of the light transmission through cochlear bone. Depending on bone thickness, a certain amount of light will excite the OC and a fraction of emitted light will be collected back for imaging. CB, cochlear bone. OC, organ of Corti. OBJ, objective.
Fig. 3.
Fig. 3.
Dissection of a murine cochlea. (a) Photograph of an extracted murine inner ear. (b) Image of the cochlea as viewed using the integrated BF microscope in the OCT system. Anatomic details are clearly visible. Arrows point to the natural windows (round and oval windows) in the cochlea. Scale bar: 1 mm.
Fig. 4.
Fig. 4.
Ultrafast laser ablation of murine cochlear bone. (a) Bright-field view of the ablated bone area (150×150 µm2). (b) A-scan OCT of the bone sample along the yellow dashed line in (a) before ablation. (c) A-scan OCT of the bone sample along the yellow dashed line in (a) after ablation. Scale bars: 50 µm. (d) Single-round ablation depth (rate of ablation) as a function of pulse energy delivered to the sample at various focal positions. Blue squares, laser focus is on the bone surface. Green circles, laser focus is 5 µm into the bone surface. Red triangles, laser focus is 10 µm into the bone surface. Cyan triangles, laser focus is 20 µm into the bone surface. Black solid diamonds, average rate of ablation. Error bars represent one standard deviation. Black line is a visual aide. (e) Ablation depth as a function of rounds of ablation at constant feeding steps of the laser focus. Colors represent pulse energy used. Blue, 0.82 µJ. Green, 1.3 µJ. Red, 2.0 µJ. Cyan, 2.8 µJ. Symbols represent feeding step size. Squares, 5 µm. Circles, 10 µm. Triangles, 20 µm. Gray shaded region shows range of ablation depth practically achievable. (f) Measurements of the optical properties of bone based on ablation-controlled thickness. The combined scattering and absorption coefficient is 203 cm−1, which are not separated. Gray shaded region suggests the possible range of variations among different samples.
Fig. 5.
Fig. 5.
Effects of bone thickness on the imaging through cochlear bone. (a) Distorted laser focus of 0.25 NA through different bone thicknesses. Curves are the intensity line profiles across the center of the focal spots normalized with the undistorted focus intensity. Insets show the corresponding images of the foci. (b) TPEF microscopy images in cochlear whole mounts through three bone thicknesses at three levels of excitation laser power. Mouse intracochlear structures are clearly visible through bone chips of 60 µm and 100 µm thickness. The images show signs of photobleaching at the thickness of 60 µm, and reduced acuity and contrast at 100 µm thickness. Images through a 250 µm thick bone chip requires the highest excitation power used to reveal vaguely identifiable structures with a significantly compromised acuity and contrast. The excitation wavelength used was 785 nm, and the whole mounts were stained with Rhodamine 6G. IHC, inner hair cell. OHC, outer hair cell. TC, tunnel of Corti. Scale bars: 20 µm.
Fig. 6.
Fig. 6.
Intracochlear hair cell imaging in intact murine cochlea through laser-ablated bone. (a) The BF image of the 3D intact cochlea before the ablation. Red dashed rectangle indicates the ablation area. (b) Cross-sectional OCT image acquired along the red arrow line in (a). (c) The BF image of the 3D intact cochlea before the ablation. (d) Cross-sectional OCT image acquired along the red arrow line in (c). Scale bars: 100 µm. (e) (f) (g) Three TPEF microscopy images acquired while focusing from the external ablated cochlear surface to the region of the organ of Corti, revealing intracochlear cells and anatomic details. Hair cells were stained with Phalloidin 488. AB, apical bone. OC, organ of Corti. SM, scala media. M, interscalar septum. IHC, inner hair cell. OHC, outer hair cell. TC, tunnel of Corti. Scale bars: 10 µm.

Similar articles

Cited by

References

    1. Hsieh C. L., Pu Y., Grange R., Psaltis D., “Digital phase conjugation of second harmonic radiation emitted by nanoparticles in turbid media,” Opt. Express 18(12), 12283–12290 (2010).10.1364/OE.18.012283 - DOI - PubMed
    1. Mosk A. P., Lagendijk A., Lerosey G., Fink M., “Controlling waves in space and time for imaging and focusing in complex media,” Nat. Photonics 6(5), 283–292 (2012).10.1038/nphoton.2012.88 - DOI
    1. Vellekoop I. M., Mosk A. P., “Focusing coherent light through opaque strongly scattering media,” Opt. Lett. 32(16), 2309–2311 (2007).10.1364/OL.32.002309 - DOI - PubMed
    1. Hsieh C. L., Pu Y., Grange R., Laporte G., Psaltis D., “Imaging through turbid layers by scanning the phase conjugated second harmonic radiation from a nanoparticle,” Opt. Express 18(20), 20723–20731 (2010).10.1364/OE.18.020723 - DOI - PubMed
    1. Yang X., Hsieh C. L., Pu Y., Psaltis D., “Three-dimensional scanning microscopy through thin turbid media,” Opt. Express 20(3), 2500–2506 (2012).10.1364/OE.20.002500 - DOI - PubMed

LinkOut - more resources