. 2019 Sep 30;6(11):509-523.
doi: 10.15698/mic2019.11.697.

Transcriptomic and chemogenomic analyses unveil the essential role of Com2-regulon in response and tolerance of Saccharomyces cerevisiae to stress induced by sulfur dioxide

Affiliations

Transcriptomic and chemogenomic analyses unveil the essential role of Com2-regulon in response and tolerance of Saccharomyces cerevisiae to stress induced by sulfur dioxide

Patrícia Lage et al. Microb Cell. .

Abstract

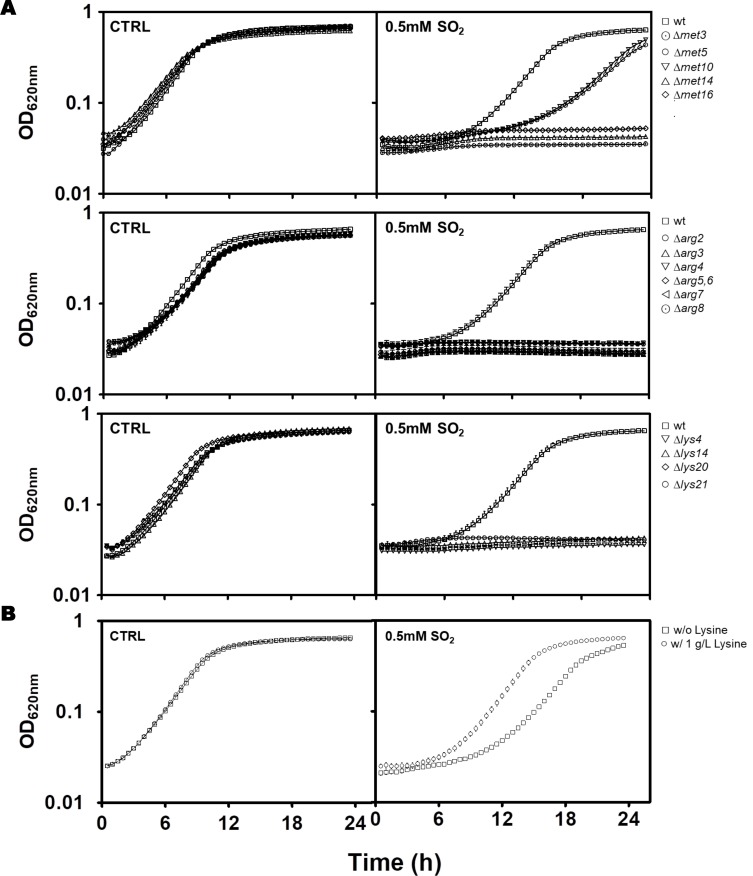
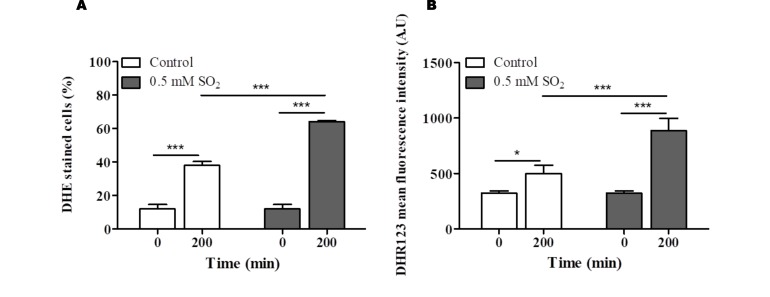
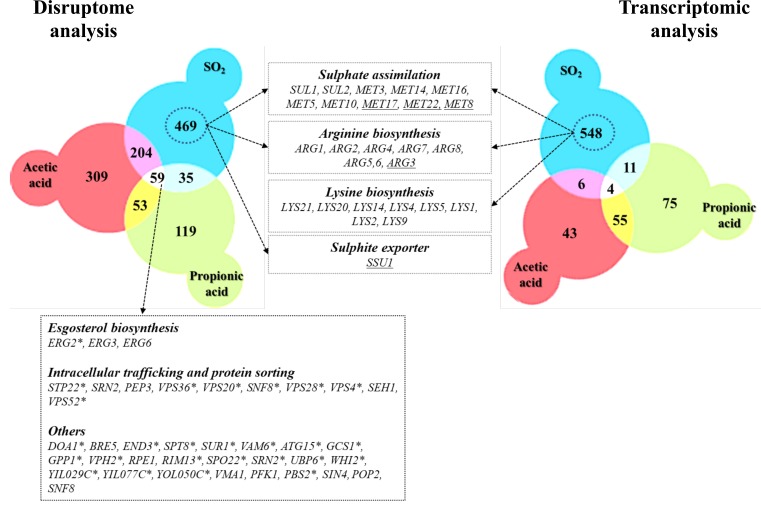
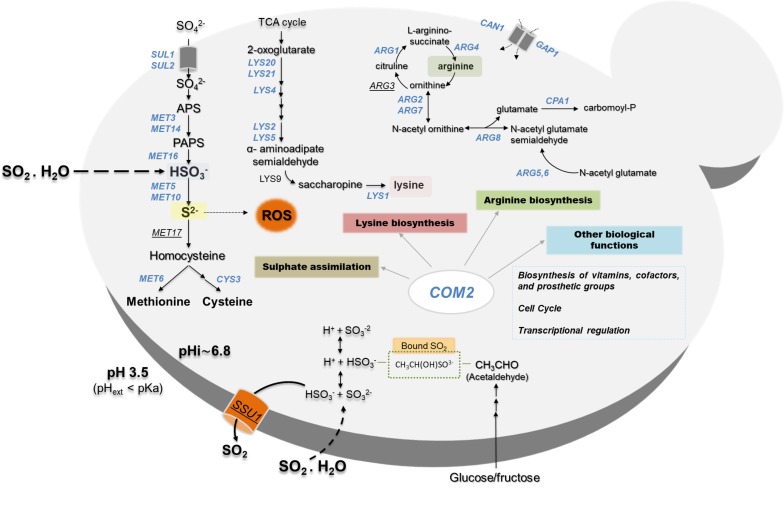
During vinification Saccharomyces cerevisiae cells are frequently exposed to high concentrations of sulfur dioxide (SO2) that is used to avoid overgrowth of unwanted bacteria or fungi present in the must. Up to now the characterization of the molecular mechanisms by which S. cerevisiae responds and tolerates SO2 was focused on the role of the sulfite efflux pump Ssu1 and investigation on the involvement of other players has been scarce, especially at a genome-wide level. In this work, we uncovered the essential role of the poorly characterized transcription factor Com2 in tolerance and response of S. cerevisiae to stress induced by SO2 at the enologically relevant pH of 3.5. Transcriptomic analysis revealed that Com2 controls, directly or indirectly, the expression of more than 80% of the genes activated by SO2, a percentage much higher than the one that could be attributed to any other stress-responsive transcription factor. Large-scale phenotyping of the yeast haploid mutant collection led to the identification of 50 Com2-targets contributing to the protection against SO2 including all the genes that compose the sulfate reduction pathway (MET3, MET14, MET16, MET5, MET10) and the majority of the genes required for biosynthesis of lysine (LYS2, LYS21, LYS20, LYS14, LYS4, LYS5, LYS1 and LYS9) or arginine (ARG5,6, ARG4, ARG2, ARG3, ARG7, ARG8, ORT1 and CPA1). Other uncovered determinants of resistance to SO2 (not under the control of Com2) included genes required for function and assembly of the vacuolar proton pump and enzymes of the antioxidant defense, consistent with the observed cytosolic and mitochondrial accumulation of reactive oxygen species in SO2-stressed yeast cells.

Keywords: Com2 (YER130c); Saccharomyces cerevisiae; Sulfur dioxide tolerance; stress response; wine preservation.


Conflict of interest statement

Conflict of interest: The authors declare no conflict of interest.

Figures

Figure 1
Figure 1. FIGURE 1.
Comparison of the susceptibility to SO2 of the Saccharomyces cerevisiae BY4741 parental strain and the deletion mutants Δmsn2, Δmsn4, Δhaa1 and Δcom2 by spot assays (A) or by cultivation in MMB liquid medium (pH 3.5) (▪) or in this medium supplemented with 0.5 mM of SO2 (□) (B). In (A) the cells used to prepare the spots were grown in MMB liquid medium until mid-exponential phase and then inoculated (at an OD of 0.05) in MMB (pH 3.5) agarized medium supplemented with the indicated concentrations of SO2. Lanes (b) and (c) are, respectively, 1:5 and 1:10 dilutions of the suspension used in lane (a). In (B) growth was followed by measuring culture OD600 and the concentration of viable cells was assessed as the number of colony forming units per ml of cell culture (CFU ml-1). All the results presented are representative of at least three independent experiments that gave the same pattern of results.
Figure 2
Figure 2. FIGURE 2: Overview on the transcriptomic profile of SO2-challenged BY4741 or Δcom2 cells.
The genes whose transcription increased more than 2-fold in the presence of SO2, comparing with the levels attained in control conditions, were selected for this representation. Genes activated by SO2 in wild-type cells but not in the mutant were considered as Com2-targets and are herein highlighted in blue.
Figure 3
Figure 3. FIGURE 3.
(A) Comparison of the susceptibility towards SO2 of the mutants devoid of the expression of genes whose transcription is activated in response to SO2 in a Com2p-dependent manner. Cells of the parental strain (wt) and of the indicated deletion mutants were grown until mid-exponential phase in liquid MMB medium (at pH 3.5) and then used to inoculate the same basal medium either supplemented (open symbols) or not supplemented with 0.5 mM SO2 (filled symbols) (at pH 3.5). Cells were batch cultured at 30ºC and growth was monitored based on OD620nm. The growth curves presented are representative of at least three independent growth experiments. (B) Wild-type strain was challenged for 24h in MMB pH 3.5 without and/or with 0.5 mM SO2 supplemented with 1 g/L of lysine.
Figure 4
Figure 4. FIGURE 4.
Assessment of the intracellular accumulation of ROS in S. cerevisiae BY4741 cells cultivated in MMB medium (at pH 3.5) (white bars) or in this same medium supplemented with 0.5 mM SO2 (grey bars). Quantification of intracellular ROS accumulation was made based on fluorescence emitted by cells stained with the ROS specific dyes DHE (A) and DHR123 (B) and analysed by flow cytometry. Significance was determined by two-way ANOVA (*p≤0.05, ***p≤0.001) between cells at time 0 and 200 minutes and between control cells and cells supplemented with SO2. Data represents mean ± SEM (the standard error of the mean) of at least three biological independent replicas.
Figure 5
Figure 5. FIGURE 5.
Venn diagrams comparing genes that were found to confer resistance to SO2, propionic and acetic acids (left panel) and the set of genes up-regulated by SO2 with those responding to acetic or propionic acids (right panel). Genes with asterisk corresponds to the MDR (multidrug resistance) genes and underlined genes represents the identified SO2-resistance genes with those that were found to be transcriptionally activated in response to this chemical.
Figure 6
Figure 6. FIGURE 6.
Schematic model for the adaptive response of S. cerevisiae to SO2 -induced stress according with the results obtained in the herein described transcriptomic and chemogenomic analyses and also integrating previously described adaptive responses. Genes regulated by Com2 are highlighted in blue.

Comment in

References

    1. Corte L, Roscini L, Zadra C, Antonielli L, Tancini B, Magini A, Emiliani C, Cardinali G. Effect of pH on potassium metabisulphite biocidic activity against yeast and human cell cultures. Food Chem. 2012;134(3):1327–1336. doi: 10.1016/j.foodchem.2012.03.025. - DOI - PubMed
    1. STRATFORD M, MORGAN P, ROSE AH. Sulphur Dioxide Resistance in Saccharomyces cerevisiae and Saccharomycodes ludwigii. Microbiology. 1987;133(8):2173–2179. doi: 10.1099/00221287-133-8-2173. - DOI
    1. Mira NP, Teixeira MC, Sa-Correia I. Adaptive response and tolerance to weak acids in Saccharomyces cerevisiae: a genome-wide view. OMICS. 2010;14(5):525–540. doi: 10.1089/omi.2010.0072. - DOI - PMC - PubMed
    1. Hinze H, Holzer H. Analysis of the energy metabolism after incubation of Saccharomyces cerevisiae with sulfite or nitrite. Arch Microbiol. 1986;145(1):27–31. doi: 10.1007/bf00413023. - DOI - PubMed
    1. Romano P, Suzzi G. Sulphur dioxide and wine microorganisms. In: Fleet G, editor. Wine Microbiology and Biotechnology. Harwood; Amsterdam: 1993. pp. 373–393.