. 2020 Apr;41(4):759-773.
doi: 10.1002/humu.23963. Epub 2019 Dec 19.

Comparison of the functional and structural characteristics of rare TSC2 variants with clinical and genetic findings

Affiliations

Comparison of the functional and structural characteristics of rare TSC2 variants with clinical and genetic findings

Luiz G Dufner Almeida et al. Hum Mutat. 2020 Apr.

Abstract

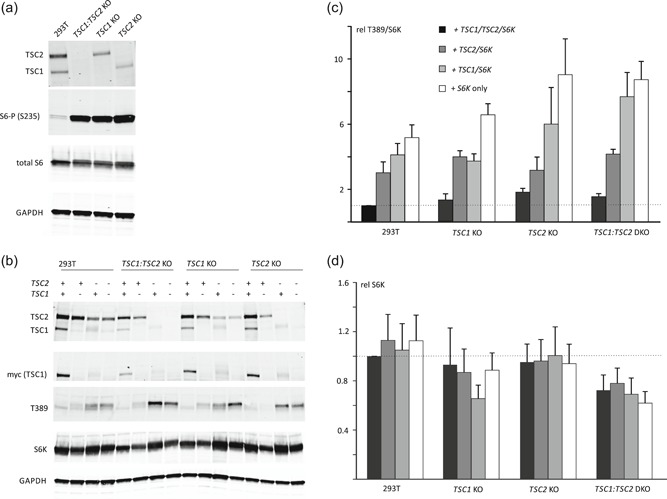
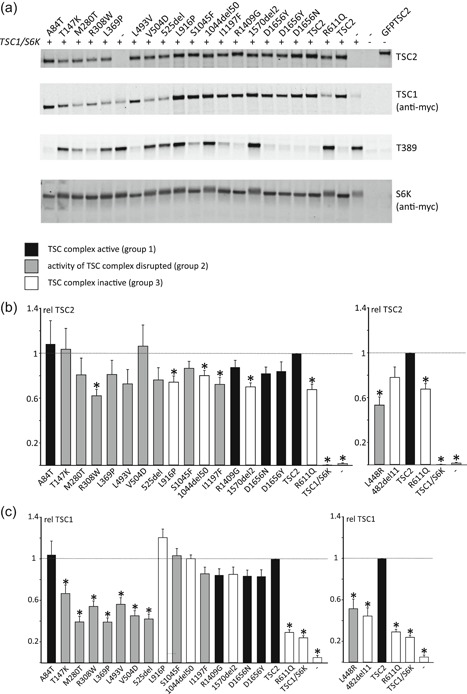
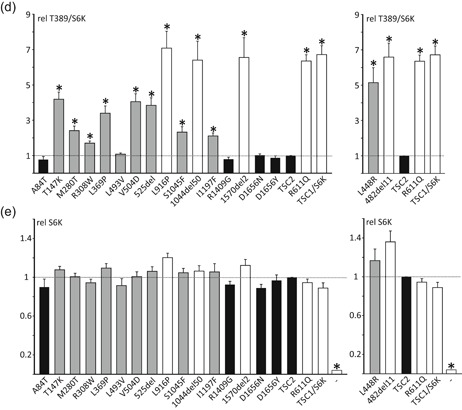
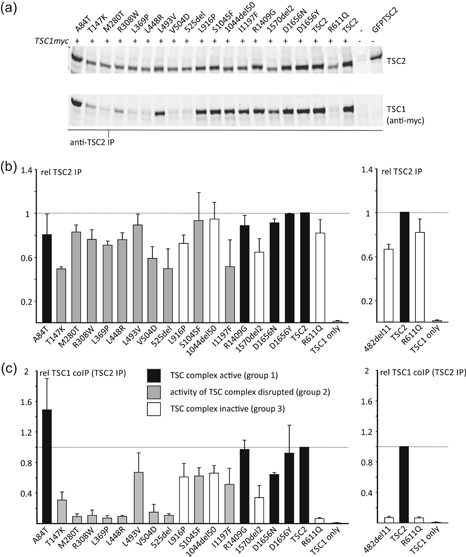
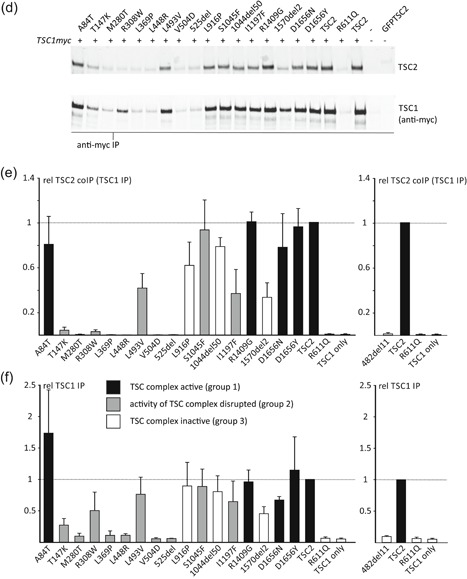
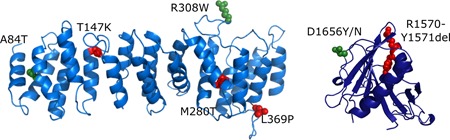
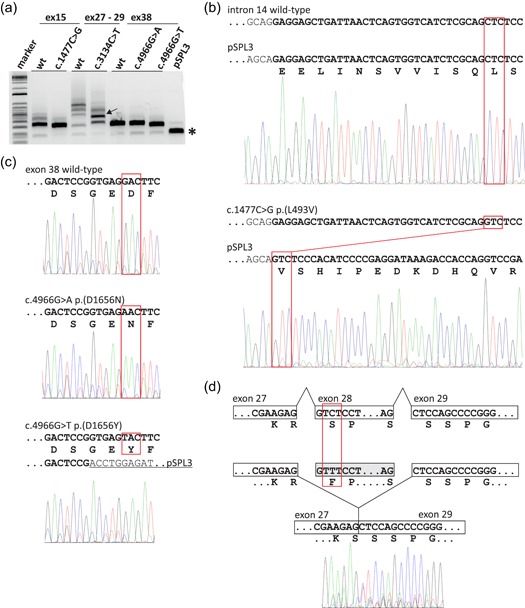
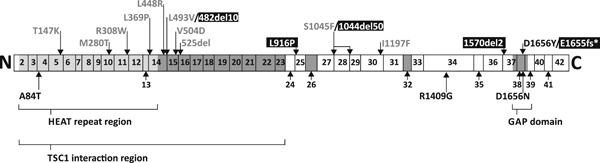
The TSC1 and TSC2 gene products interact to form the tuberous sclerosis complex (TSC), an important negative regulator of the mechanistic target of rapamycin complex 1 (TORC1). Inactivating mutations in TSC1 or TSC2 cause TSC, and the identification of a pathogenic TSC1 or TSC2 variant helps establish a diagnosis of TSC. However, it is not always clear whether TSC1 and TSC2 variants are inactivating. To determine whether TSC1 and TSC2 variants of uncertain clinical significance affect TSC complex function and cause TSC, in vitro assays of TORC1 activity can be employed. Here we combine genetic, functional, and structural approaches to try and classify a series of 15 TSC2 VUS. We investigated the effects of the variants on the formation of the TSC complex, on TORC1 activity and on TSC2 pre-mRNA splicing. In 13 cases (87%), the functional data supported the hypothesis that the identified TSC2 variant caused TSC. Our results illustrate the benefits and limitations of functional testing for TSC.

Keywords: CRISPR/Cas9; TORC1; TSC2; VUS; functional assay; tuberous sclerosis complex.


Conflict of interest statement

The authors declare that there are no conflict of interests.

Figures

Figure 1
Figure 1
TSC1 and TSC2 knockout (KO) clone analysis. CRISPR/Cas9 genome editing was used to inactivate TSC2 and/or TSC1 in HEK 293T cells. The TSC1 knockout (TSC1 KO), TSC2 knockout (TSC2 KO), and TSC1:TSC2 double knockout (TSC1:TSC2 DKO) subclones were compared to the parental HEK 293T cell‐line (293T). To characterize TORC1 signaling in the different cell‐lines, cells were starved of growth factors (serum) overnight before harvesting. The cleared cell lysates were analyzed by immunoblotting. (a) TSC1 and/or TSC2 protein signals were absent from the TSC1 and/or TSC2 KO cells and, in contrast to the parental 293T cells, the KO cells showed robust S6‐S235 phosphorylation (S6‐P (S235)), a marker for TORC1 activity. Total protein content of the lysates was estimated from the total S6 and GAPDH signals. To investigate the effects of exogenous TSC1 and TSC2 expression the KO cells were transfected with S6K, TSC1, and/or TSC2 expression constructs, as indicated, and analyzed by immunoblotting. (b) The total S6K (S6K) and T389‐phosphorylated S6K (T389) signals were determined per cell‐line in three independent experiments, and the mean T389/S6K ratios (c) and mean total S6K signals (d), relative to 293T cells expressing exogenous TSC complexes, were determined. An increased T389/S6K ratio corresponds to increased TORC1 activity. The T389/S6K ratio was highest in the TSC2 KO and TSC1:TSC2 DKO cells expressing S6K only and was reduced by expression of either TSC2 or TSC1 and TSC2. Error bars represent the standard error of the mean. GAPDH, glyceraldehyde phosphate dehydrogenase; HEK, human embryonic kidney; TORC1, target of rapamycin complex 1
Figure 2
Figure 2
Functional assessment of the TSC2 variants. The signals for TSC2, TSC1, total S6K (S6K), and T389‐phosphorylated S6K (T389) were determined per variant, relative to the wild‐type control (TSC2) in at least four independent transfection experiments. An example of an immunoblot is shown in (a). The mean TSC2 (b), TSC1 (c), and S6K (e) signals and mean T389/S6K ratio (d) are shown for each variant. In each case, the dotted line indicates the signal/ratio for wild‐type TSC2 (=1.0). Error bars represent the standard error of the mean. Mean signals for the p.L448R and p.482_493delinsV (482del11) variants are shown separately as they were not included on the blot shown in (a). Amino acid changes are given according to the TSC2 Leiden Open Variation Database (TSC2 reference transcript sequence NM_000548.3; http://www.lovd.nl/TSC2; see main text for variant abbreviations). Variants classified in Group 1 (no effect on TSC complex function) are shown in black, Group 2 variants (disrupt TSC complex activity) are in gray, and Group 3 variants (inactivate TSC complex) are in white (see main text for details). (b) Mean signals for the TSC2 variants, relative to wild‐type TSC1–TSC2 (TSC2; TSC2 signal = 1). Values that were significantly different from the wild‐type control (TSC2) are indicated with an asterisk (p < .025; Student's t test). (c) Mean TSC1 signals in the presence of the TSC2 variants, relative to wild‐type TSC1–TSC2 (TSC2; TSC1 signal = 1). Values that were significantly different from the wild‐type control (TSC2) are indicated with an asterisk (p < .025; Student's t test). (d) Mean T389/S6K ratios for the TSC2 variants, relative to wild‐type TSC1–TSC2 (TSC2; T389/S6K ratio = 1). Ratios that were significantly increased compared to the wild‐type control (TSC2) are indicated with an asterisk (p < .025; Student's t test). (e) Mean total S6K signals in the presence of the TSC2 variants, relative to wild‐type TSC2 (TSC2; S6K signal = 1). Values that were significantly different from the wild‐type control (TSC2) are indicated with an asterisk (p < .025; Student's t test)
Figure 2
Figure 2
Functional assessment of the TSC2 variants. The signals for TSC2, TSC1, total S6K (S6K), and T389‐phosphorylated S6K (T389) were determined per variant, relative to the wild‐type control (TSC2) in at least four independent transfection experiments. An example of an immunoblot is shown in (a). The mean TSC2 (b), TSC1 (c), and S6K (e) signals and mean T389/S6K ratio (d) are shown for each variant. In each case, the dotted line indicates the signal/ratio for wild‐type TSC2 (=1.0). Error bars represent the standard error of the mean. Mean signals for the p.L448R and p.482_493delinsV (482del11) variants are shown separately as they were not included on the blot shown in (a). Amino acid changes are given according to the TSC2 Leiden Open Variation Database (TSC2 reference transcript sequence NM_000548.3; http://www.lovd.nl/TSC2; see main text for variant abbreviations). Variants classified in Group 1 (no effect on TSC complex function) are shown in black, Group 2 variants (disrupt TSC complex activity) are in gray, and Group 3 variants (inactivate TSC complex) are in white (see main text for details). (b) Mean signals for the TSC2 variants, relative to wild‐type TSC1–TSC2 (TSC2; TSC2 signal = 1). Values that were significantly different from the wild‐type control (TSC2) are indicated with an asterisk (p < .025; Student's t test). (c) Mean TSC1 signals in the presence of the TSC2 variants, relative to wild‐type TSC1–TSC2 (TSC2; TSC1 signal = 1). Values that were significantly different from the wild‐type control (TSC2) are indicated with an asterisk (p < .025; Student's t test). (d) Mean T389/S6K ratios for the TSC2 variants, relative to wild‐type TSC1–TSC2 (TSC2; T389/S6K ratio = 1). Ratios that were significantly increased compared to the wild‐type control (TSC2) are indicated with an asterisk (p < .025; Student's t test). (e) Mean total S6K signals in the presence of the TSC2 variants, relative to wild‐type TSC2 (TSC2; S6K signal = 1). Values that were significantly different from the wild‐type control (TSC2) are indicated with an asterisk (p < .025; Student's t test)
Figure 3
Figure 3
Immunoprecipitation of variant TSC complexes. TSC1:TSC2 double knockout cells were cotransfected with expression constructs encoding C‐terminal myc‐tagged TSC1 and either TSC2 or a TSC2 variant. TSC complexes were immunoprecipitated from the cleared cell lysates using either antibodies specific for the (TSC1) myc‐epitope tag (anti‐myc IP) or for an epitope close to the TSC2 C‐terminus (TSC2 IP). Immunoprecipitated TSC complexes were detected by immunoblotting (a and d) and the TSC2 and TSC1 signals were determined per variant relative to the wild‐type control (TSC2) in two independent transfection experiments. (b) The mean signals are shown for immunoprecipitated TSC2 (TSC2 IP) and (c) coimmunoprecipitated TSC1 (TSC1 coIP (TSC2 IP), (e) immunoprecipitated TSC1 (TSC1 IP), and (f) coimmunoprecipitated TSC2 (TSC2 co IP (TSC1 IP). In each case, the dotted line indicates the signal corresponding to wild‐type TSC2 (=1.0). Error bars represent the standard error of the mean. Mean signals for the p.482_493delinsV (482del11) variant are shown separately as it was not included on the blots shown in (a) and (d). Amino acid changes are given according to the TSC2 Leiden Open Variation Database (TSC2 reference transcript sequence NM_000548.3; http://www.lovd.nl/TSC2; see main text for variant abbreviations). Variants classified in Group 1 (no effect on TSC complex function) are shown in black, Group 2 variants (disrupt TSC complex activity) are in gray and Group 3 variants (inactivate TSC complex) are in white (see main text for details)
Figure 3
Figure 3
Immunoprecipitation of variant TSC complexes. TSC1:TSC2 double knockout cells were cotransfected with expression constructs encoding C‐terminal myc‐tagged TSC1 and either TSC2 or a TSC2 variant. TSC complexes were immunoprecipitated from the cleared cell lysates using either antibodies specific for the (TSC1) myc‐epitope tag (anti‐myc IP) or for an epitope close to the TSC2 C‐terminus (TSC2 IP). Immunoprecipitated TSC complexes were detected by immunoblotting (a and d) and the TSC2 and TSC1 signals were determined per variant relative to the wild‐type control (TSC2) in two independent transfection experiments. (b) The mean signals are shown for immunoprecipitated TSC2 (TSC2 IP) and (c) coimmunoprecipitated TSC1 (TSC1 coIP (TSC2 IP), (e) immunoprecipitated TSC1 (TSC1 IP), and (f) coimmunoprecipitated TSC2 (TSC2 co IP (TSC1 IP). In each case, the dotted line indicates the signal corresponding to wild‐type TSC2 (=1.0). Error bars represent the standard error of the mean. Mean signals for the p.482_493delinsV (482del11) variant are shown separately as it was not included on the blots shown in (a) and (d). Amino acid changes are given according to the TSC2 Leiden Open Variation Database (TSC2 reference transcript sequence NM_000548.3; http://www.lovd.nl/TSC2; see main text for variant abbreviations). Variants classified in Group 1 (no effect on TSC complex function) are shown in black, Group 2 variants (disrupt TSC complex activity) are in gray and Group 3 variants (inactivate TSC complex) are in white (see main text for details)
Figure 4
Figure 4
Structural predictions for TSC2 variants. Models for the human TSC2 N‐terminal domain (left) and GTPase activating protein (GAP) domain (right) were generated with SWISS‐MODEL based on PDBID:5HIU (Zech et al., 2016) and PDBID:1SRQ (Daumke et al., 2004), respectively. Amino acid changes are given according to the TSC2 Leiden Open Variation Database (TSC2 reference transcript sequence NM_000548.3; http://www.lovd.nl/TSC2); changes to the residues shown in green are predicted to be structurally tolerated; changes to the residues shown in red are likely to disrupt protein structure
Figure 5
Figure 5
In vitro analysis of TSC2 pre‐mRNA splicing. RT‐PCR was performed on RNA isolated from cells transfected with constructs encoding either wild‐type (wt) or variant TSC2 exons 15 (ex15), 27–29 (ex27–29) or 38 (ex38); the pSPL3 splicing vector without an insert was included as a control (pSPL3). (a) Agarose gel of the RT‐PCR amplification products. Sanger sequencing results are shown in (b–d). A constitutive ~230 bp splice product of the vector donor and acceptor sites is indicated with an asterisk and is the primary cause of the background peaks visible in the electropherograms shown in (b–d). Multiple RT‐PCR products were obtained from both the wild‐type and c.3134C>T p.(S1045F) variant constructs containing TSC2 exons 27–29. The arrow indicates the major product derived from the c.3134C>T p.(S1045F) variant construct. This product was excised from the gel before sequencing (see (d), below). (b) Noncanonical TSC2 splicing caused by the c.1477C>G p.(L493V) substitution. Exonic DNA sequences are indicated in bold and the corresponding amino acid sequence is shown below the sequence of the pSPL3–TSC2 exon 15 splice product; codon 493 is highlighted in red. The first 11 codons of exon 15 are missing from the sequence derived from the c.1477C>G p.(L493V) variant (lower panel). (c) Noncanonical TSC2 splicing caused by the c.4966G>T p.(D1656Y) substitution (bottom panel), but not the c.4966G>A p.(D1656N) substitution (middle panel). Exonic sequences are indicated in bold; sequences corresponding to the pSPL3 acceptor site are underlined; codon 1656 is highlighted in red. The c.4966G>T p.(D1656Y) substitution results in the utilization of a noncanonical donor site at c.4960 (see Figure S2c). (d) TSC2 exon 28 skipping associated with the c.3134C>T p.(S1045F) substitution. The sequence obtained from the RT‐PCR product indicated with an arrow in (a) is shown. Sequences corresponding to exon 28 were absent from the electropherogram. bp, base pair; mRNA, messenger RNA; RT‐PCR, reverse transcriptase‐polymerase chain reaction
Figure 6
Figure 6
Schematic overview of the TSC2 variants investigated as part of this study. The approximate positions of the variants, relative to the coding exons according to genomic reference sequence NG_005895.1, are indicated. Variants are colored according to their classification group, as shown in Figures 2 and 3: Group 1, black; Group 2, gray; Group 3, white (on black background); see main text for details. Alternatively spliced exons and regions of known structure and/or function are indicated with shading

References

    1. Arnold, K. , Bordoli, L. , Kopp, J. , & Schwede, T. (2006). The SWISS‐MODEL workspace: A web‐based environment for protein structure homology modelling. Bioinformatics, 22, 195–201. - PubMed
    1. Buchan, D. , Minneci, F. , Nugent, T. , Bryson, K. , & Jones, D. (2013). Scalable web services for the PSIPRED Protein Analysis Workbench. Nucleic Acids Research, 41, W349–357. - PMC - PubMed
    1. Chantranupong, L. , Wolfson, R. L. , Orozco, J. M. , Saxton, R. A. , Scaria, S. M. , Bar‐Peled, L. , … Sabatini, D. M. (2014). The sestrins interact with GATOR2 to negatively regulate the amino‐acid‐sensing pathway upstream of mTORC1. Cell Reports, 9, 1–8. - PMC - PubMed
    1. Cong, L. , Ran, F. A. , Cox, D. , Lin, S. , Barretto, R. , Habib, N. , … Zhang, F. (2013). Multiplex genome engineering using CRISPR/Cas systems. Science, 339, 819–823. - PMC - PubMed
    1. Daumke, O. , Weyland, M. , Chakrabarti, P. P. , Vetter, I. R. , & Wittinghofer, A. (2004). The GTPase activating protein Rap1GAP uses a catalytic asparagine. Nature, 429, 197–201. - PubMed

Publication types

Substances