Keratinocytic Skin Cancer Detection on the Face Using Region-Based Convolutional Neural Network
- PMID: 31799995
- PMCID: PMC6902187
- DOI: 10.1001/jamadermatol.2019.3807
Keratinocytic Skin Cancer Detection on the Face Using Region-Based Convolutional Neural Network
Abstract
Importance: Detection of cutaneous cancer on the face using deep-learning algorithms has been challenging because various anatomic structures create curves and shades that confuse the algorithm and can potentially lead to false-positive results.
Objective: To evaluate whether an algorithm can automatically locate suspected areas and predict the probability of a lesion being malignant.
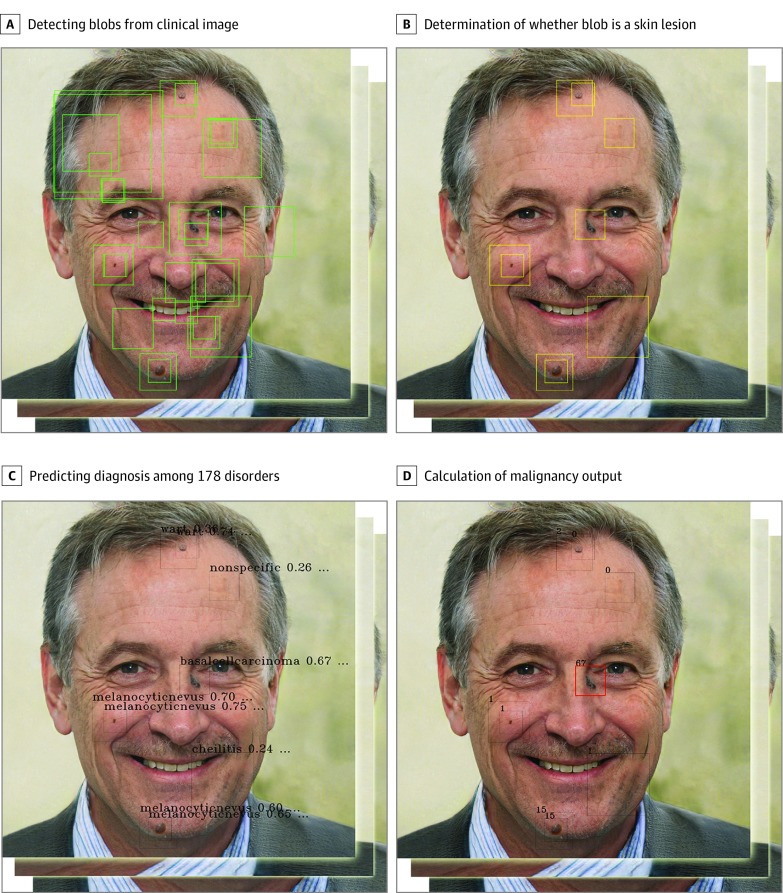
Design, setting, and participants: Region-based convolutional neural network technology was used to create 924 538 possible lesions by extracting nodular benign lesions from 182 348 clinical photographs. After manually or automatically annotating these possible lesions based on image findings, convolutional neural networks were trained with 1 106 886 image crops to locate and diagnose cancer. Validation data sets (2844 images from 673 patients; mean [SD] age, 58.2 [19.9] years; 308 men [45.8%]; 185 patients with malignant tumors, 305 with benign tumors, and 183 free of tumor) were obtained from 3 hospitals between January 1, 2010, and September 30, 2018.
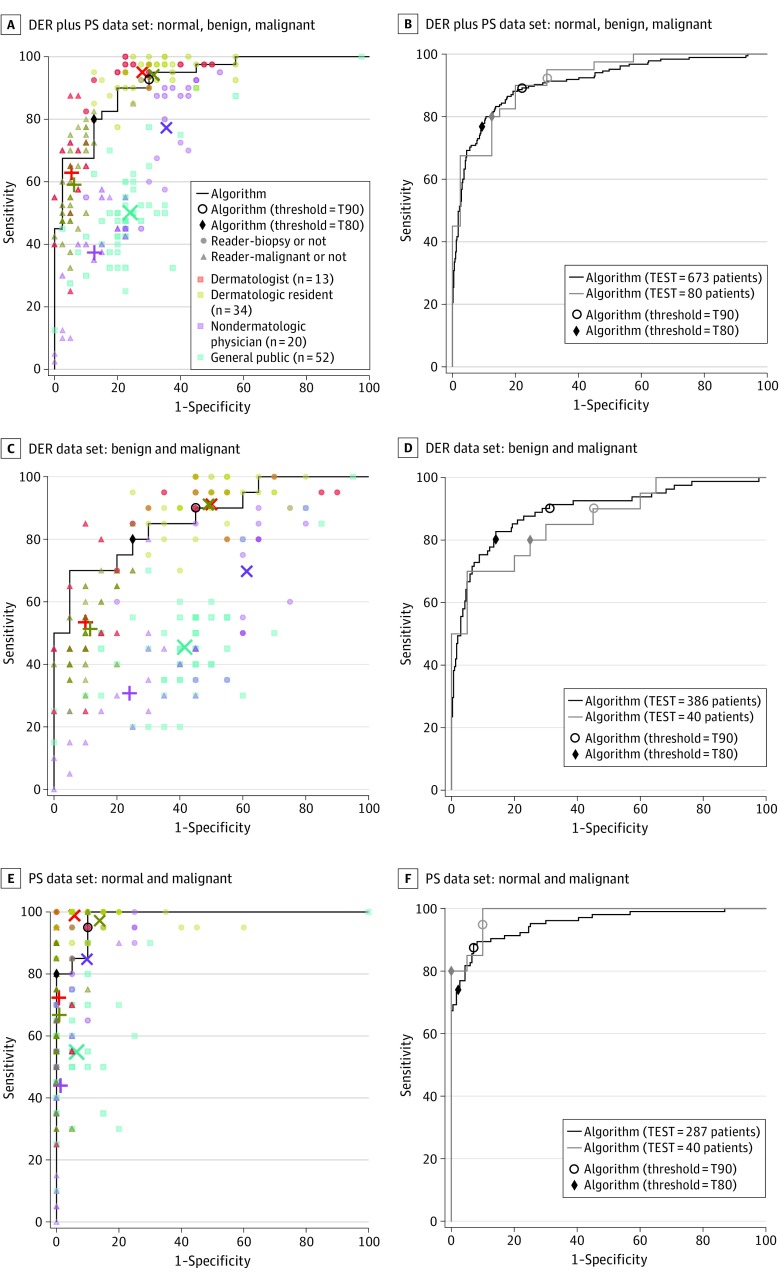
Main outcomes and measures: The area under the receiver operating characteristic curve, F1 score (mean of precision and recall; range, 0.000-1.000), and Youden index score (sensitivity + specificity -1; 0%-100%) were used to compare the performance of the algorithm with that of the participants.
Results: The algorithm analyzed a mean (SD) of 4.2 (2.4) photographs per patient and reported the malignancy score according to the highest malignancy output. The area under the receiver operating characteristic curve for the validation data set (673 patients) was 0.910. At a high-sensitivity cutoff threshold, the sensitivity and specificity of the model with the 673 patients were 76.8% and 90.6%, respectively. With the test partition (325 images; 80 patients), the performance of the algorithm was compared with the performance of 13 board-certified dermatologists, 34 dermatology residents, 20 nondermatologic physicians, and 52 members of the general public with no medical background. When the disease screening performance was evaluated at high sensitivity areas using the F1 score and Youden index score, the algorithm showed a higher F1 score (0.831 vs 0.653 [0.126], P < .001) and Youden index score (0.675 vs 0.417 [0.124], P < .001) than that of nondermatologic physicians. The accuracy of the algorithm was comparable with that of dermatologists (F1 score, 0.831 vs 0.835 [0.040]; Youden index score, 0.675 vs 0.671 [0.100]).
Conclusions and relevance: The results of the study suggest that the algorithm could localize and diagnose skin cancer without preselection of suspicious lesions by dermatologists.
Conflict of interest statement
Figures
Comment in
-
Problems and Potentials of Automated Object Detection for Skin Cancer Recognition.JAMA Dermatol. 2020 Jan 1;156(1):23-24. doi: 10.1001/jamadermatol.2019.3360. JAMA Dermatol. 2020. PMID: 31799989 No abstract available.
Similar articles
-
Assessment of deep neural networks for the diagnosis of benign and malignant skin neoplasms in comparison with dermatologists: A retrospective validation study.PLoS Med. 2020 Nov 25;17(11):e1003381. doi: 10.1371/journal.pmed.1003381. eCollection 2020 Nov. PLoS Med. 2020. PMID: 33237903 Free PMC article.
-
Dermatologist-level classification of malignant lip diseases using a deep convolutional neural network.Br J Dermatol. 2020 Jun;182(6):1388-1394. doi: 10.1111/bjd.18459. Epub 2019 Nov 19. Br J Dermatol. 2020. PMID: 31449661
-
Automated Diagnosis of Plus Disease in Retinopathy of Prematurity Using Deep Convolutional Neural Networks.JAMA Ophthalmol. 2018 Jul 1;136(7):803-810. doi: 10.1001/jamaophthalmol.2018.1934. JAMA Ophthalmol. 2018. PMID: 29801159 Free PMC article.
-
Dermatoscopy of Neoplastic Skin Lesions: Recent Advances, Updates, and Revisions.Curr Treat Options Oncol. 2018 Sep 20;19(11):56. doi: 10.1007/s11864-018-0573-6. Curr Treat Options Oncol. 2018. PMID: 30238167 Free PMC article. Review.
-
Unveiling the power of convolutional neural networks in melanoma diagnosis.Eur J Dermatol. 2023 Oct 1;33(5):495-505. doi: 10.1684/ejd.2023.4559. Eur J Dermatol. 2023. PMID: 38297925
Cited by
-
Construction of Sports Training Performance Prediction Model Based on a Generative Adversarial Deep Neural Network Algorithm.Comput Intell Neurosci. 2022 May 21;2022:1211238. doi: 10.1155/2022/1211238. eCollection 2022. Comput Intell Neurosci. 2022. PMID: 35637721 Free PMC article.
-
Hypothesis testing procedure for binary and multi-class F1 -scores in the paired design.Stat Med. 2023 Oct 15;42(23):4177-4192. doi: 10.1002/sim.9853. Epub 2023 Aug 1. Stat Med. 2023. PMID: 37527903 Free PMC article.
-
Generation of a Melanoma and Nevus Data Set From Unstandardized Clinical Photographs on the Internet.JAMA Dermatol. 2023 Nov 1;159(11):1223-1231. doi: 10.1001/jamadermatol.2023.3521. JAMA Dermatol. 2023. PMID: 37792351 Free PMC article.
-
Pre-trained multimodal large language model enhances dermatological diagnosis using SkinGPT-4.Nat Commun. 2024 Jul 5;15(1):5649. doi: 10.1038/s41467-024-50043-3. Nat Commun. 2024. PMID: 38969632 Free PMC article.
-
Artificial intelligence and skin cancer.Front Med (Lausanne). 2024 Mar 19;11:1331895. doi: 10.3389/fmed.2024.1331895. eCollection 2024. Front Med (Lausanne). 2024. PMID: 38566925 Free PMC article. Review.
References
-
- Haenssle HA, Fink C, Schneiderbauer R, et al. ; Reader study level-I and level-II Groups . Man against machine: diagnostic performance of a deep learning convolutional neural network for dermoscopic melanoma recognition in comparison to 58 dermatologists. Ann Oncol. 2018;29(8):1836-1842. doi:10.1093/annonc/mdy166 - DOI - PubMed
Publication types
MeSH terms
LinkOut - more resources
Full Text Sources
Other Literature Sources
Medical