. 2019 Dec 4;14(12):e0225193.
doi: 10.1371/journal.pone.0225193. eCollection 2019.

A global model for predicting the arrival of imported dengue infections

Affiliations

A global model for predicting the arrival of imported dengue infections

Jessica Liebig et al. PLoS One. .

Abstract

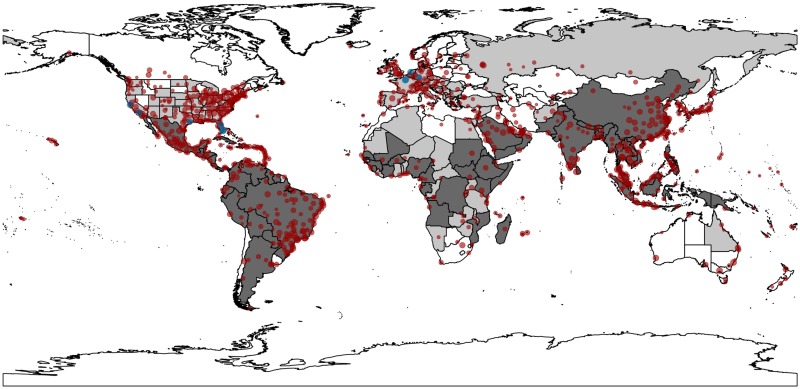
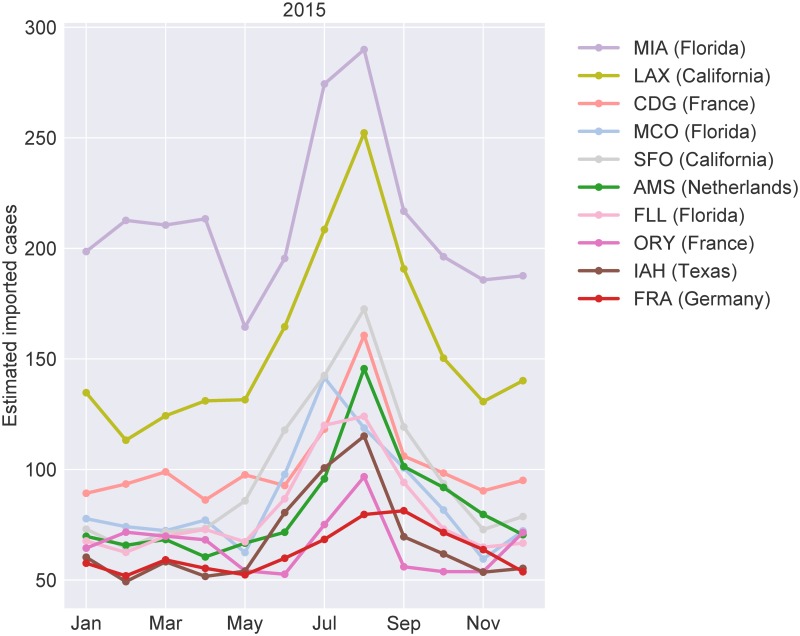
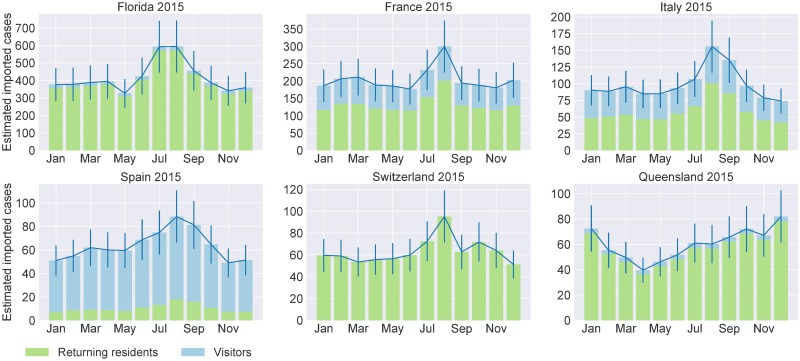
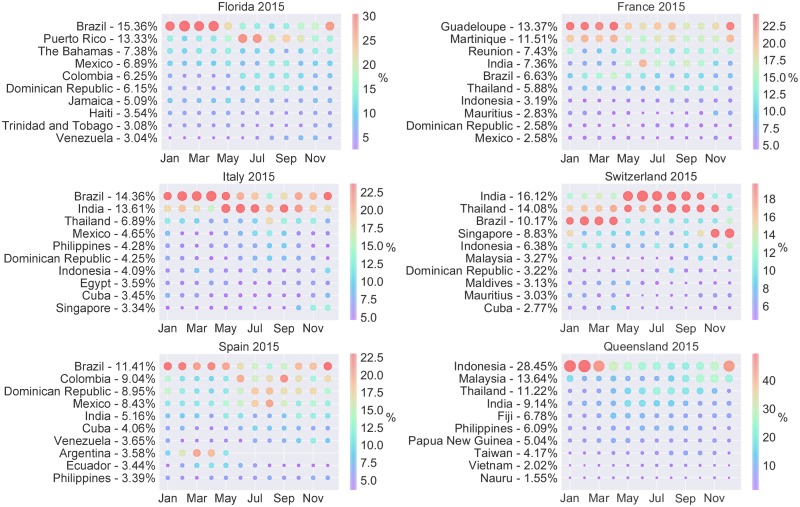
With approximately half of the world's population at risk of contracting dengue, this mosquito-borne disease is of global concern. International travellers significantly contribute to dengue's rapid and large-scale spread by importing the disease from endemic into non-endemic countries. To prevent future outbreaks and dengue from establishing in non-endemic countries, knowledge about the arrival time and location of infected travellers is crucial. We propose a network model that predicts the monthly number of dengue-infected air passengers arriving at any given airport. We consider international air travel volumes to construct weighted networks, representing passenger flows between airports. We further calculate the probability of passengers, who travel through the international air transport network, being infected with dengue. The probability of being infected depends on the destination, duration and timing of travel. Our findings shed light onto dengue importation routes and reveal country-specific reporting rates that have been until now largely unknown. This paper provides important new knowledge about the spreading dynamics of dengue that is highly beneficial for public health authorities to strategically allocate the often limited resources to more efficiently prevent the spread of dengue.


Conflict of interest statement

The authors have declared that no competing interests exist.

Figures

Fig 1
Fig 1. Predicted dengue importations for August 2015.
The map shows the output of our model for August 2015.The area of a node increases with the number of dengue cases imported through the corresponding airport. Airports that are predicted to not receive any infections are not shown on the map. Endemic countries are coloured dark grey. Countries that are non-endemic and where dengue vectors Aedes aegypti and/or Aedes albopictus are present are coloured in light grey. The blue circles correspond to the top ten airports identified in Fig 2. The map was created with the Python GeoPandas package and publicly available shapefiles from Natural Earth (http://www.naturalearthdata.com/).
Fig 2
Fig 2. Predicted monthly dengue importations by airport for 2015.
The number of predicted imported dengue infections for the top ten airports in non-endemic countries/states with vector presence for each month in 2015. A break in a line indicates that the corresponding airport was not amongst the top ten during the respective month. Airports are abbreviated using the corresponding IATA code. A full list of abbreviations can be found in the supplementary material (see Table A in S1 File).
Fig 3
Fig 3. Predicted dengue infections imported by returning residents and visitors in 2015.
Here we show the results for non-endemic countries/states with vector presence with the highest number of predicted imported dengue cases in 2015. The bars are stacked to distinguish between returning residents (green) and visitors (blue). The blue solid line corresponds to the total number of imported cases. The error bars correspond to the model’s coefficient of variation (see Material and methods). The six countries were selected because they are predicted to receive the highest number of dengue importations, are non-endemic and dengue vectors are established.
Fig 4
Fig 4. Predicted percentage contribution of dengue importations by country of acquisition in 2015.
The predicted percentage contribution by source country and month in 2015. The size and colour of the circles indicate the percentage contribution of the corresponding country to the total number of imported cases. The y-labels indicate the yearly percentage contribution of the corresponding source country.
Fig 5
Fig 5. Rank-based validation and correlation between reported and predicted imported cases for Queensland in 2015.
(A) Countries are ranked by the total number of predicted and reported imported dengue cases. The reported ranking is then plotted against the predicted ranking. Countries that were ranked by the model, but did not appear in the dataset receive a rank of i + 1, were i is the number of unique importation sources according to the dengue case data. Similarly, countries that appeared in the data and were not ranked by the model receive a rank of i + 1. For circles that lie on the x = y line (grey solid line) the predicted and reported rankings are equal. Circles that lie between the two dashed lines correspond to countries with a difference in ranking that is less than or equal to five. The circle areas are scaled proportionally to the number of reported cases that were imported from the corresponding country. Spearman’s rank correlation coefficient between the absolute numbers of reported and predicted importations is equal to 0.6. (B) The absolute number of reported dengue importations are plotted against the absolute number of predicted importations.

References

    1. Bloom DE, Black S, Rappuoli R. Emerging infectious diseases: A proactive approach. Proc Natl Acad Sci. 2017;114(16):4055–4059. 10.1073/pnas.1701410114 - DOI - PMC - PubMed
    1. Brockmann D, Helbing D. The hidden geometry of complex, network-driven contagion phenomena. Science. 2013;342(6164):1337–1342. 10.1126/science.1245200 - DOI - PubMed
    1. Dorigatti I, Hamlet A, Aguas R, Cattarino L, Cori A, Donnelly CA, et al. International risk of yellow fever spread from the ongoing outbreak in Brazil, December 2016 to May 2017. Eurosurveillance. 2017;22(28):30572 10.2807/1560-7917.ES.2017.22.28.30572 - DOI - PMC - PubMed
    1. Guimera R, Mossa S, Turtschi A, Amaral LAN. The worldwide air transportation network: Anomalous centrality, community structure, and cities’ global roles. Proc Natl Acad Sci. 2005;102(22):7794–7799. 10.1073/pnas.0407994102 - DOI - PMC - PubMed
    1. Huang Z, Tatem AJ. Global malaria connectivity through air travel. Malar J. 2013;12(1):269 10.1186/1475-2875-12-269 - DOI - PMC - PubMed

Publication types

MeSH terms