. 2019 Dec 3;29(10):3303-3312.e3.
doi: 10.1016/j.celrep.2019.10.124.

Identification of Neuronal Lineages in the Drosophila Peripheral Nervous System with a "Digital" Multi-spectral Lineage Tracing System

Affiliations

Identification of Neuronal Lineages in the Drosophila Peripheral Nervous System with a "Digital" Multi-spectral Lineage Tracing System

Macy W Veling et al. Cell Rep. .

Abstract

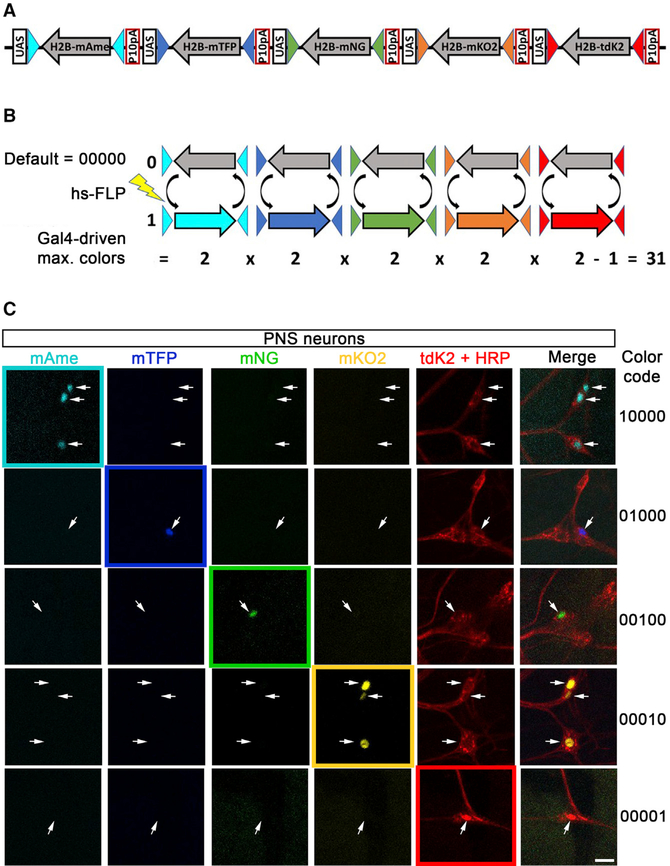
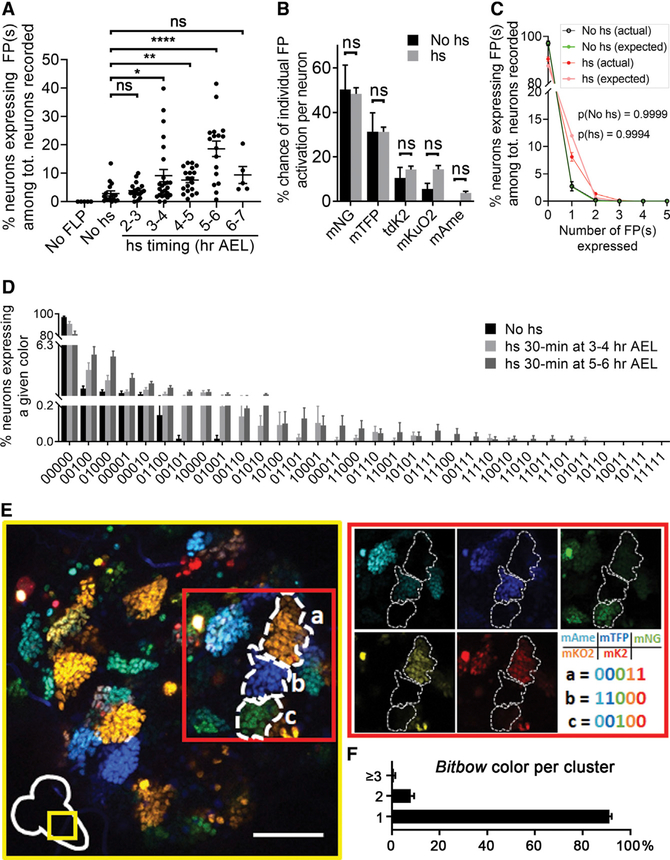
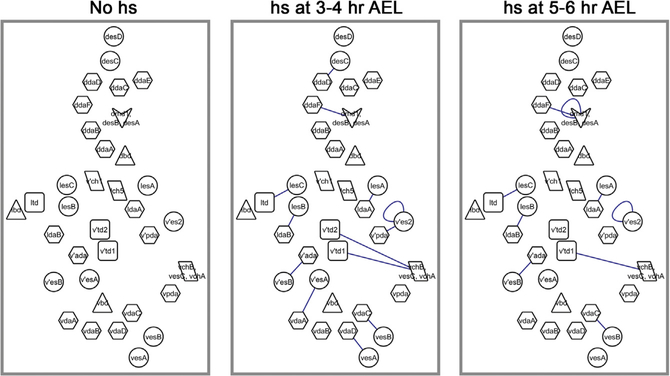
Elucidating cell lineages provides crucial understanding of development. Recently developed sequencing-based techniques enhance the scale of lineage tracing but eliminate the spatial information offered by conventional approaches. Multi-spectral labeling techniques, such as Brainbow, have the potential to identify lineage-related cells in situ. Here, we report nuclear Bitbow (nBitbow), a "digital" version of Brainbow that greatly expands the color diversity for scoring cells, and a suite of statistical methods for quantifying the lineage relationship of any two cells. Applying these tools to the Drosophila peripheral nervous system (PNS), we determined lineage relationship between all neuronal pairs. This study demonstrates nBitbow as an efficient tool for in situ lineage mapping, and the complete lineage relationship among larval PNS neurons opens new possibilities for studying how neurons gain specific features and circuit connectivity.

Keywords: Bitbow; Brainbow; Drosophila; development; lineage tracing; multi-spectral labeling; peripheral nervous system; statistics.


Conflict of interest statement

DECLARATION OF INTERESTS

The authors declare no competing interests.

Figures

Figure 1.
Figure 1.. Design and Color-Coding Principles of nBitbow
(A) Schematic of the nBitbow spinning design The H2B fusion nuclear FP (nucFP) open reading frames are positioned in the reverse direction as a default non-detectable color in the absence of FLP. (B) Schematics of color-coding in nBitbow. Upon heat shock-induced FLP expression, which causes recombination of FRT sites, each H2B-FP module can stochastically and independently spin into a forward (1, visible) or reversed (0, nondetectable) expression state. A maximum of 31 visible colors can be detected in the presence of a Gal4 driver. (C) Spectral imaging and linear unmixing are performed to identify the five-bit nBitbow color code for each cell, in which 1s represent the FPs that are turned on and 0s represent those that are not turned on. Images shown are PNS neurons. HRP, anti-HRP immunostaining, which specifically labels PNS neurons. Scale bar: 10 mm.
Figure 2.
Figure 2.. Labeling and Lineage Tracing Efficacy of nBitbow in the Drosophila Nervous System
(A) Quantification of the labeling coverage of nBitbow by heat shock FLP induction in the PNS at various time points during early embryonic development. Sample numbers (larvae): no FLP, 5; no hs, 16; 2–3 h AEL, 18; 3–4 h AEL, 25; 4–5 h AEL, 19; 5–6 h AEL, 17; 6–7 h AEL, 5. The p values were calculated by Dunn’s multiple comparison test. ns, p > 0.05; *0.01 < p ≤ 0.05; **0.001 < p ≤ 0.01; ***0.001 < p ≤ 0.001; and ****p < 0.0001. (B) Comparison of the turn-on efficiency of each FRT-nucFP-FRT module in the PNS. Heat shock (hs) data are the combined data from hs at 2–3, 3–4, 4–5, 5–6, and 6–7 h AEL. Sample numbers (larvae): no hs, 16; hs, 81. The p values were calculated by multiple comparison using the Holm-Sidak method. (C) The actual FP frequency distribution is not different from the theoretical distribution (expected) as the number of activated FP increases in the PNS. This indicates that the recombination of each FRT-nucFP-FRT module is independent of each other. Sample numbers (larvae): no hs, 15; hs, 81. The p values were calculated by the chi-square goodness-of-fit test for Poisson distribution. (D) 27 color codes were observed with different frequencies in the PNS from a Drosophila line that carries only one nBitbow cassette. Sample numbers (larvae): no hs, 15; 3–4 h AEL, 25; 5–6 h AEL, 17. (E) Representative images of nBitbow labeling in thoracic segments in the CNS of the third-instar larvae with embryonic heat shock FLP induction. Most cell clusters (i.e., lineage clones) were labeled with the same color. 193 clusters were analyzed. Scale bar: 50 μm. (F) Proportion of thoracic lineage clones labeled by one, two, or more Bitbow color tags, quantified across n = 193 clusters. The p values were calculated using unpaired two-tailed t test, and α of 0.05 is used as the cutoff for significance. Error bars: SEM.
Figure 3.
Figure 3.. nBitbow Efficiently Identifies Neuronal Lineages of Drosophila PNS Neurons
(A) Schematic drawing of the distribution of PNS neurons in one hemisegment of the larval body wall. In the PNS, multipolar neurons include the md, da, bipolar dendrite (bd), and td types, whereas bipolar neurons include the es and chordotonal (ch) types. (B) Schematic drawing of the experimental steps. (C) Representative fluorescent images that show matching color codes of pairs of neurons previously thought to be independent of each other. These neuronal pairs are the five es neurons (desC, lesC, v’esA, vesA, and vesB) and their lineage-related da or td neurons. These es neurons have been previously reported as the only neuron from individual SOPs (Brewster and Bodmer, 1995). Larvae were heat-shocked at 3–4 h AEL. Scale bar: 10 μm. (D) Statistical analysis confirms that these neuron pairs are lineage related. The κ values calculated based on experimental observations (red arrows) are significantly higher (i.e., closer to 1) than those calculated based on a random color distribution (blue). See also Figures S1 and S2.
Figure 4.
Figure 4.. PNS Lineage Maps Revealed by nBitbow at Different Developmental Times
Neurons in a hemisegment are shown. These maps are based on the lineage relationships of all neurons determined by their calculated κ values from experiments with no heat shock (left), heat shock at 3–4 h AEL (middle), and heat shock at 5–6 h AEL (right). Each line connects a pair of lineage-related neurons with ≤2% false discovery rate (FDR). Three groups of neurons that cannot be identified individually (dotted boxes in Figure 3A) are presented as single symbols in these maps: the arrowhead includes four neurons—dmd1, desB, and 2 desA—that are located close together; the parallelogram labeled as lch5 includes 5 ch neurons; and the parallelogram labeled as vchA, vchB, and vesC includes the three neurons indicated. See also Figure S3.
Figure 5.
Figure 5.. Lineage Tracing of Basin Neurons in the CNS of Drosophila
(A) Quantification of color activation frequency inBasin neurons with 1-h heat shock at 3–4 h AEL. Sample number (larvae): 13. Error bars: SEM. (B) Representative fluorescent images that showBasin neurons expressing the same color in a cluster that is different from the adjacent cluster. Scale bar: 10 μm. (C) κ value and random distribution of Basin neurons. Statistical analysis confirms that all four basin neurons are lineage related. See also Figure S4

References

    1. Ai HW, Henderson JN, Remington SJ, and Campbell RE (2006). Directed evolution of a monomeric, bright and photostable version of Clavularia cyan fluorescent protein: structural characterization and applications in fluorescence imaging. Biochem. J 400, 531–540. - PMC - PubMed
    1. Ai HW, Hazelwood KL, Davidson MW, and Campbell RE (2008). Fluorescent protein FRET pairs for ratiometric imaging of dual biosensors. Nat. Methods 5, 401–403. - PubMed
    1. Bateman JR, Lee AM, and Wu CT (2006). Site-specific transformation of Drosophila via phiC31 integrase-mediated cassette exchange. Genetics 173, 769–777. - PMC - PubMed
    1. Benjamini Y, and Hochberg Y (1995). Controlling the False Discovery Rate—a Practical and Powerful Approach to Multiple Testing. J. R. Stat. Soc. B 57, 289–300.
    1. Birkholz O, Rickert C, Nowak J, Coban IC, and Technau GM (2015). Bridging the gap between postembryonic cell lineages and identified embryonic neuroblasts in the ventral nerve cord of Drosophila melanogaster. Biol. Open 4, 420–434. - PMC - PubMed

Publication types

LinkOut - more resources