

Development of a Microfluidic Array to Study Drug Response in Breast Cancer
- PMID: 31801265
- PMCID: PMC6930663
- DOI: 10.3390/molecules24234385
Development of a Microfluidic Array to Study Drug Response in Breast Cancer
Abstract
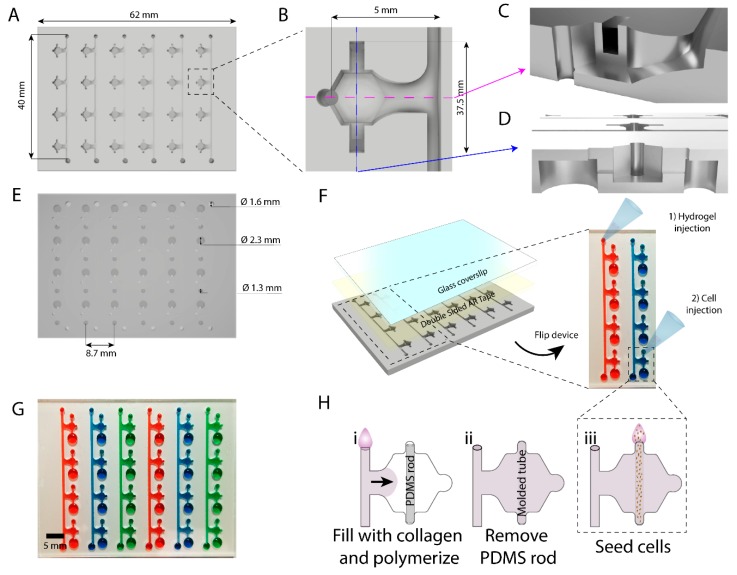
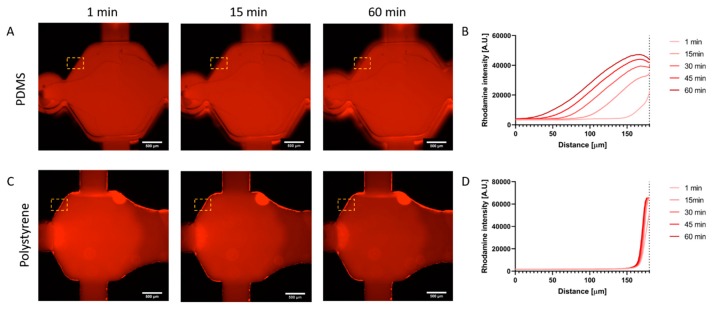
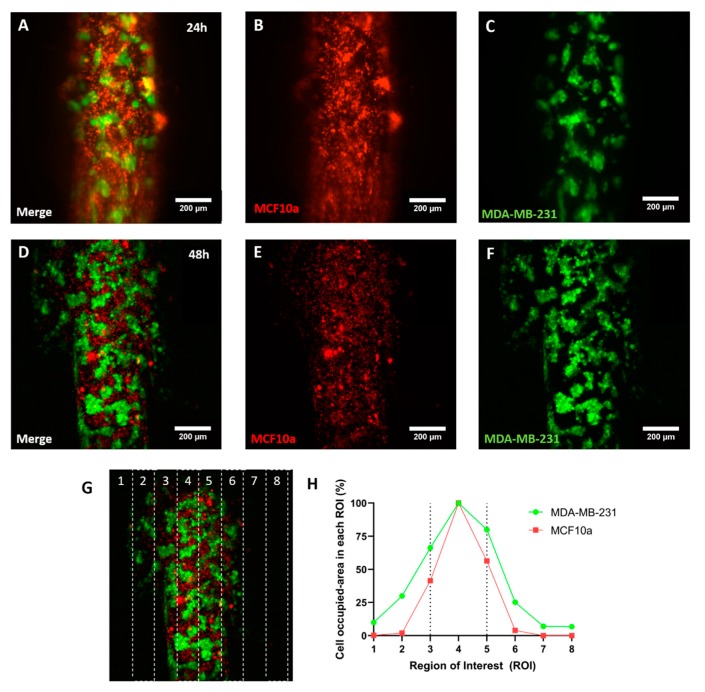
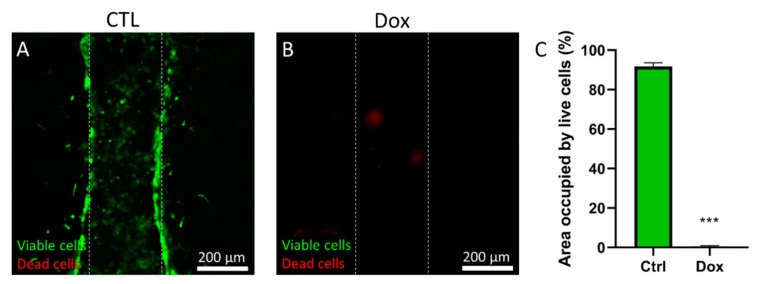
Luminal geometries are common structures in biology, which are challenging to mimic using conventional in vitro techniques based on the use of Petri dishes. In this context, microfluidic systems can mimic the lumen geometry, enabling a large variety of studies. However, most microfluidic models still rely on polydimethylsiloxane (PDMS), a material that is not amenable for high-throughput fabrication and presents some limitations compared with other materials such as polystyrene. Thus, we have developed a microfluidic device array to generate multiple bio-relevant luminal structures utilizing polystyrene and micro-milling. This platform offers a scalable alternative to conventional microfluidic devices designed in PDMS. Additionally, the use of polystyrene has well described advantages, such as lower permeability to hydrophobic molecules compared with PDMS, while maintaining excellent viability and optical properties. Breast cancer cells cultured in the devices exhibited high cell viability similar to PDMS-based microdevices. Further, co-culture experiments with different breast cell types showed the potential of the model to study breast cancer invasion. Finally, we demonstrated the potential of the microfluidic array for drug screening, testing chemotherapy drugs and photodynamic therapy agents for breast cancer.
Keywords: lumen; microfluidics; polystyrene.
Conflict of interest statement
Funding: We would like to thank EPA STAR Grant #83573701 for funding this research. Additional funding was provided by University of Wisconsin Carbone Cancer Center: Cancer Center Support Grant, NIH NCI P30 CA014520. University of Wisconsin Carbone Cancer Center Morgridge Research Institute. NIH grants R01 CA164492, R01 CA185747, R01 CA205101.
Figures
Similar articles
-
High-Throughput Screening of Anti-cancer Drugs Using a Microfluidic Spheroid Culture Device with a Concentration Gradient Generator.Curr Protoc. 2022 Sep;2(9):e529. doi: 10.1002/cpz1.529. Curr Protoc. 2022. PMID: 36066205
-
A microfluidic cell culture array with various oxygen tensions.Lab Chip. 2013 Aug 21;13(16):3239-45. doi: 10.1039/c3lc50388g. Epub 2013 Jun 20. Lab Chip. 2013. PMID: 23784347
-
Surface Modification Techniques for Endothelial Cell Seeding in PDMS Microfluidic Devices.Biosensors (Basel). 2020 Nov 19;10(11):182. doi: 10.3390/bios10110182. Biosensors (Basel). 2020. PMID: 33228050 Free PMC article. Review.
-
Polydimethylsiloxane SlipChip for mammalian cell culture applications.Analyst. 2015 Nov 7;140(21):7355-65. doi: 10.1039/c5an00547g. Analyst. 2015. PMID: 26381390
-
The revolution of PDMS microfluidics in cellular biology.Crit Rev Biotechnol. 2023 May;43(3):465-483. doi: 10.1080/07388551.2022.2034733. Epub 2022 Apr 11. Crit Rev Biotechnol. 2023. PMID: 35410564 Review.
Cited by
-
Human breast tissue engineering in health and disease.EMBO Mol Med. 2024 Oct;16(10):2299-2321. doi: 10.1038/s44321-024-00112-3. Epub 2024 Aug 23. EMBO Mol Med. 2024. PMID: 39179741 Free PMC article. Review.
-
A role for microfluidic systems in precision medicine.Nat Commun. 2022 Jun 2;13(1):3086. doi: 10.1038/s41467-022-30384-7. Nat Commun. 2022. PMID: 35654785 Free PMC article. Review.
-
A comparative study of tumour-on-chip models with patient-derived xenografts for predicting chemotherapy efficacy in colorectal cancer patients.Front Bioeng Biotechnol. 2022 Aug 16;10:952726. doi: 10.3389/fbioe.2022.952726. eCollection 2022. Front Bioeng Biotechnol. 2022. PMID: 36147524 Free PMC article.
-
Toward improved in vitro models of human cancer.APL Bioeng. 2021 Jan 21;5(1):010902. doi: 10.1063/5.0026857. eCollection 2021 Mar. APL Bioeng. 2021. PMID: 33532672 Free PMC article.
-
Engineering Breast Cancer On-chip-Moving Toward Subtype Specific Models.Front Bioeng Biotechnol. 2021 Jun 23;9:694218. doi: 10.3389/fbioe.2021.694218. eCollection 2021. Front Bioeng Biotechnol. 2021. PMID: 34249889 Free PMC article. Review.
References
-
- Scannell J.W., Blanckley A., Boldon H., Warrington B. Diagnosing the decline in pharmaceutical R&D efficiency. Nat. Rev. Drug Discov. 2012;11:191–200. - PubMed
-
- Morgana M.M., Johnsona B.P., Livingston M.K., Schuler L.A., Alarid E.T., Sung K.E., Beebe D.J. Personalized in vitro cancer models to predict therapeutic response: Challenges and a framework for improvement. Pharmacol. Ther. 2016;165:79–92. doi: 10.1016/j.pharmthera.2016.05.007. - DOI - PMC - PubMed
MeSH terms
Substances
Grants and funding
LinkOut - more resources
Full Text Sources
