. 2020 Jan 21;141(3):217-233.
doi: 10.1161/CIRCULATIONAHA.119.042178. Epub 2019 Dec 5.

A Novel Role of Cyclic Nucleotide Phosphodiesterase 10A in Pathological Cardiac Remodeling and Dysfunction

Affiliations

A Novel Role of Cyclic Nucleotide Phosphodiesterase 10A in Pathological Cardiac Remodeling and Dysfunction

Si Chen et al. Circulation. .

Abstract

Background: Heart failure is a leading cause of death worldwide. Cyclic nucleotide phosphodiesterases (PDEs), through degradation of cyclic nucleotides, play critical roles in cardiovascular biology and disease. Our preliminary screening studies have revealed PDE10A upregulation in the diseased heart. However, the roles of PDE10A in cardiovascular biology and disease are largely uncharacterized. The current study is aimed to investigate the regulation and function of PDE10A in cardiac cells and in the progression of cardiac remodeling and dysfunction.

Methods: We used isolated adult mouse cardiac myocytes and fibroblasts, as well as preclinical mouse models of hypertrophy and heart failure. The PDE10A selective inhibitor TP-10, and global PDE10A knock out mice were used.

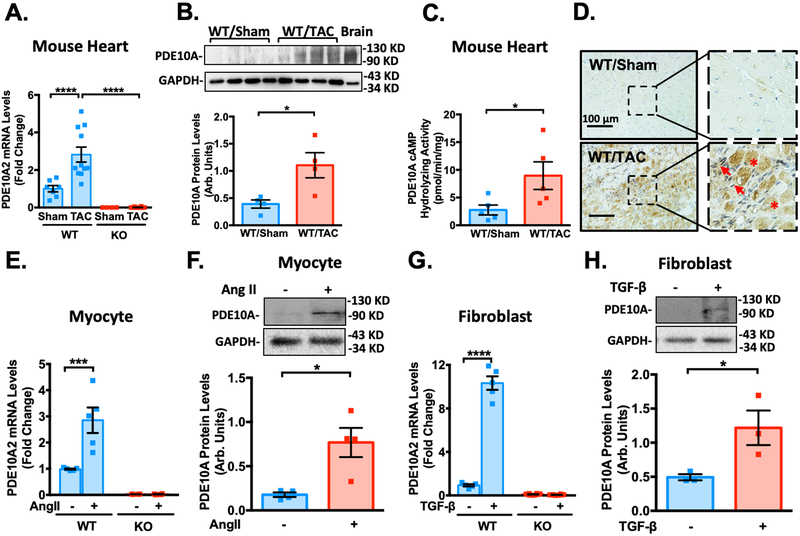
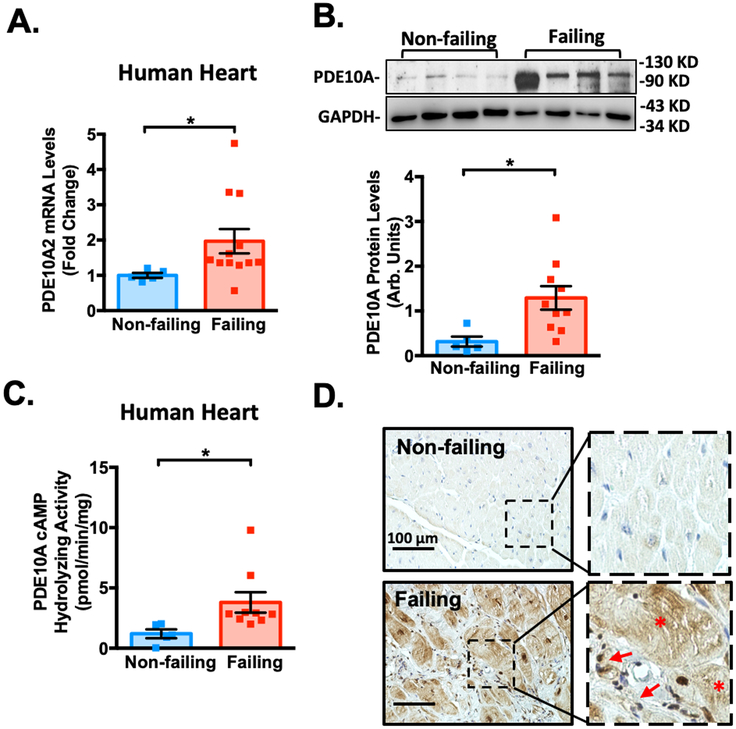
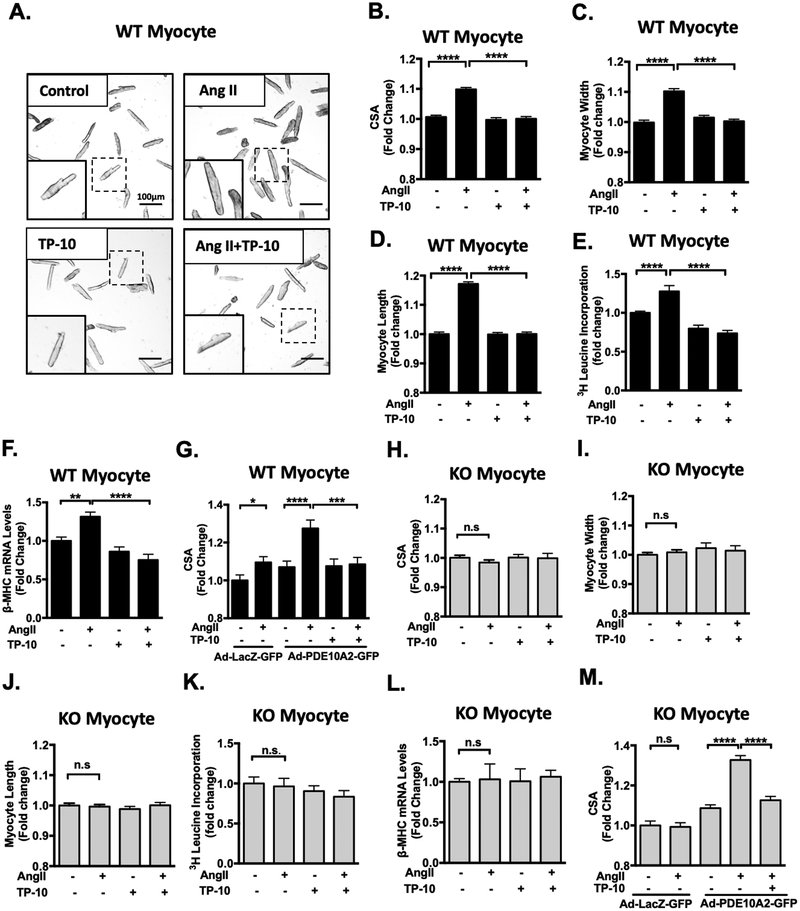
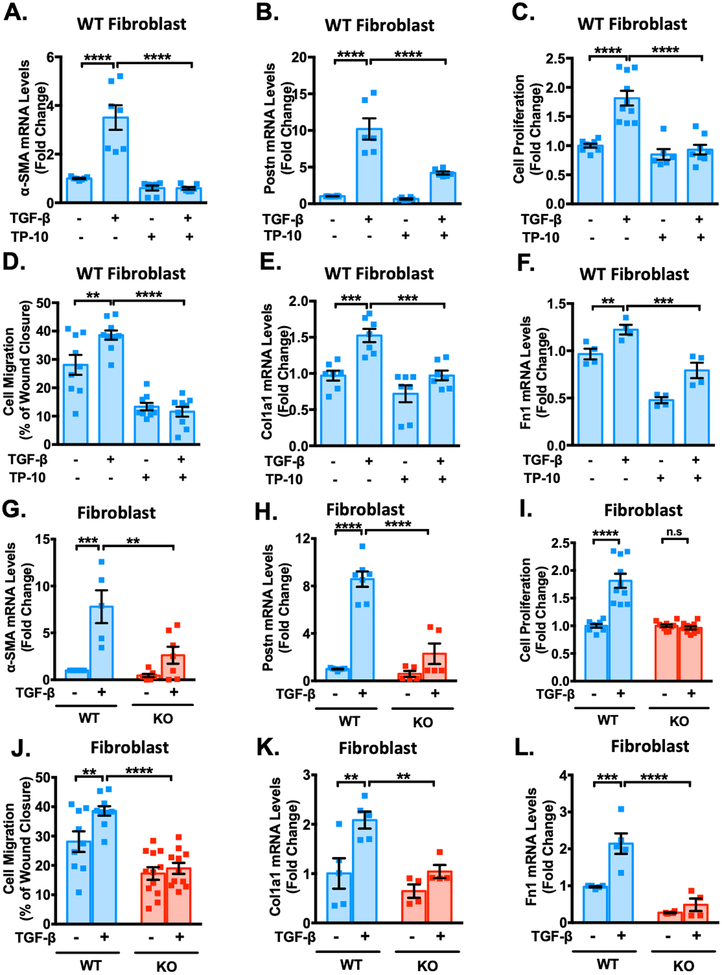
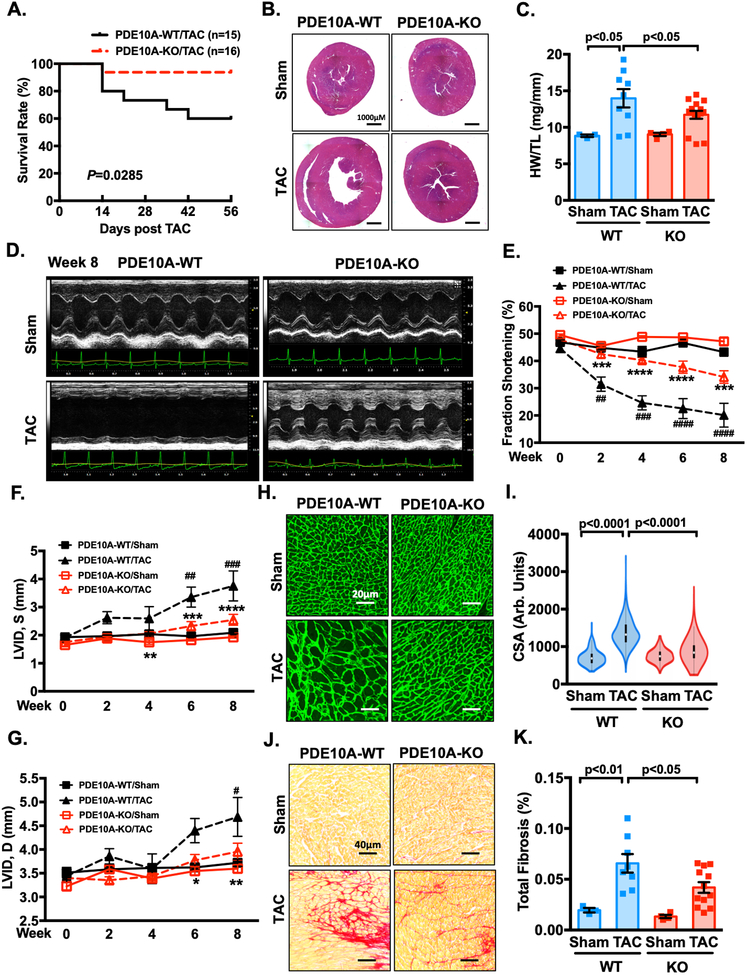
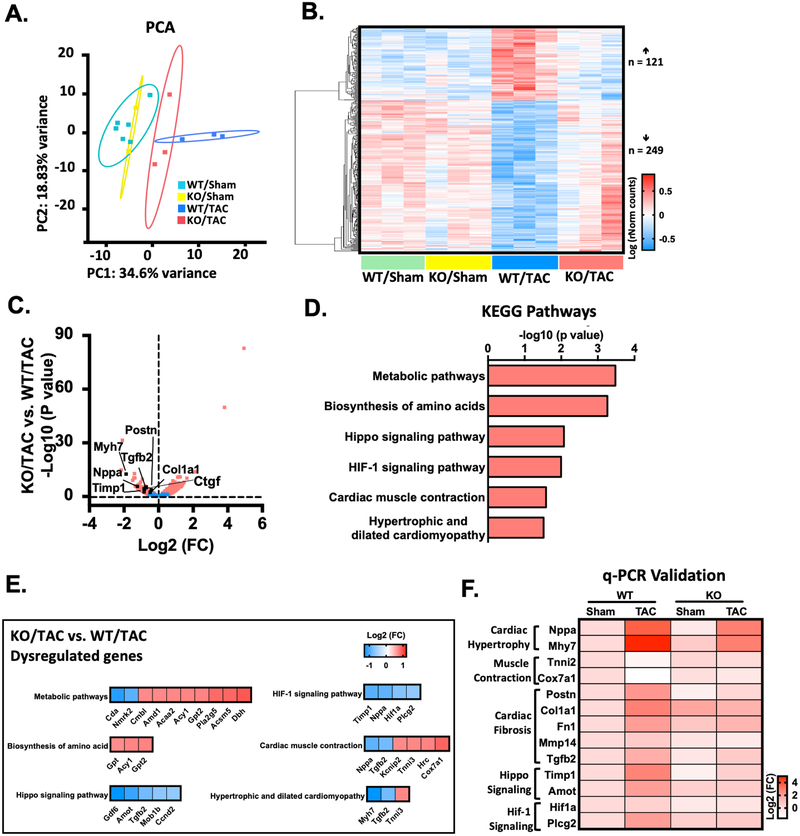
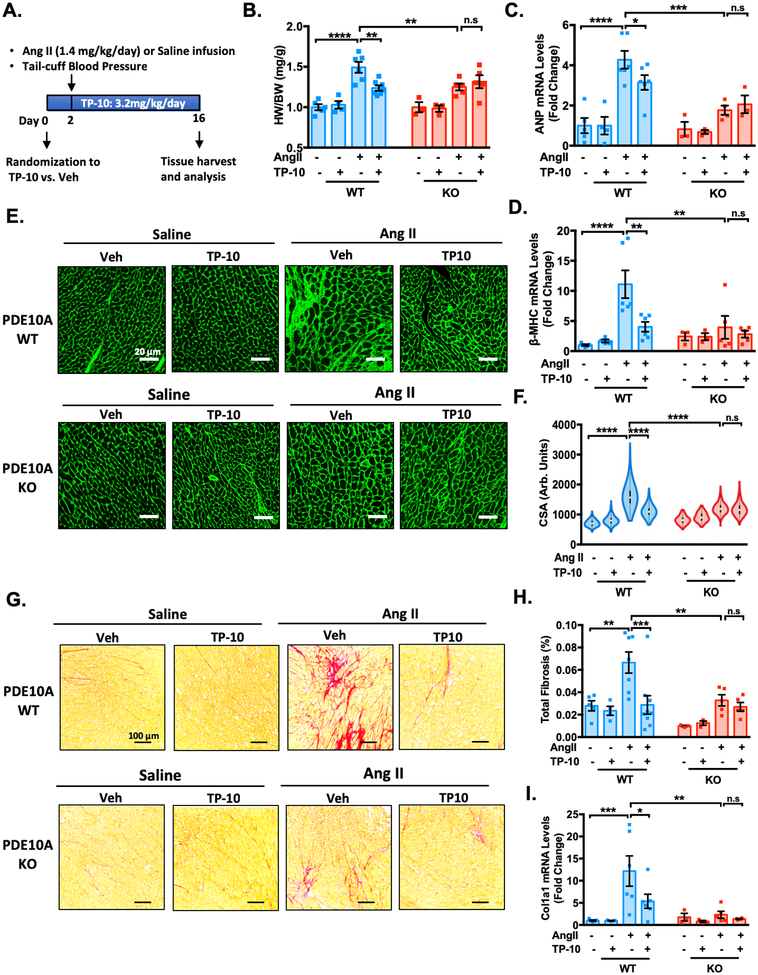
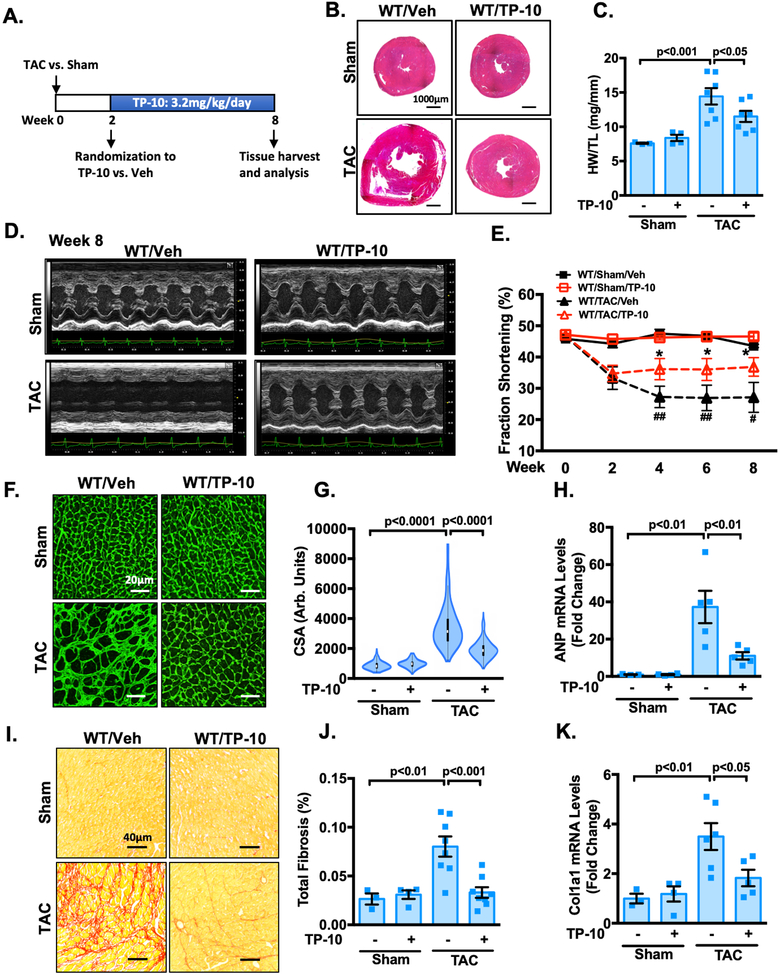
Results: We found that PDE10A expression remains relatively low in normal and exercised heart tissues. However, PDE10A is significantly upregulated in mouse and human failing hearts. In vitro, PDE10A deficiency or inhibiting PDE10A with selective inhibitor TP-10, attenuated cardiac myocyte pathological hypertrophy induced by Angiotensin II, phenylephrine, and isoproterenol, but did not affect cardiac myocyte physiological hypertrophy induced by IGF-1 (insulin-like growth factor 1). TP-10 also reduced TGF-β (transforming growth factor-β)-stimulated cardiac fibroblast activation, proliferation, migration and extracellular matrix synthesis. TP-10 treatment elevated both cAMP and cGMP levels in cardiac myocytes and cardiac fibroblasts, consistent with PDE10A as a cAMP/cGMP dual-specific PDE. In vivo, global PDE10A deficiency significantly attenuated myocardial hypertrophy, cardiac fibrosis, and dysfunction induced by chronic pressure overload via transverse aorta constriction or chronic neurohormonal stimulation via Angiotensin II infusion. Importantly, we demonstrated that the pharmacological effect of TP-10 is specifically through PDE10A inhibition. In addition, TP-10 is able to reverse pre-established cardiac hypertrophy and dysfunction. RNA-Sequencing and bioinformatics analysis further identified a PDE10A-regualted transcriptome involved in cardiac hypertrophy, fibrosis, and cardiomyopathy.

Conclusions: Taken together, our study elucidates a novel role for PDE10A in the regulation of pathological cardiac remodeling and development of heart failure. Given that PDE10A has been proven to be a safe drug target, PDE10A inhibition may represent a novel therapeutic strategy for preventing and treating cardiac diseases associated with cardiac remodeling.

Keywords: cardiac hypertrophy; cyclic nucleotide phosphodiesterases.


Figures

Figure 1:
Figure 1:. PDE10A expression is upregulated in mouse failing hearts as well as in isolated cardiac myocytes (CMs) and cardiac fibroblasts (CFs).
(A) PDE10A2 mRNA levels assessed by qPCR in mouse heart tissues from mice with 8 weeks of TAC or sham operation, normalized to GAPDH. n=7 for PDE10A-WT/Sham; n=11 for PDE10A-WT/TAC; n=4 for PDE10A-KO/Sham; and n=12 for PDE10A-KO/TAC. (B) PDE10A protein levels measured by western blotting in mouse tissues from mice with 8 weeks of TAC or sham operation, bar graph shows the average of n=4 WT/Sham; n=4 WT/TAC. (C) PDE10A cAMP-hydrolyzing activity in mouse heart tissues from mice with 8 weeks of TAC or sham operation; n=5 for WT/Sham; and n=5 for WT/TAC. (D) Immunohistochemistry staining of PDE10A in myocardium of WT mouse hearts with sham or TAC operation for 8 weeks. Arrows indicate activated CFs. Asterisks indicate CMs. Scale bars: 100 μm. Similar results were obtained from 3 pairs of tissue samples. (E) PDE10A2 mRNA levels assessed by qPCR in mouse adult CMs isolated from PDE10A-WT and -KO mice and stimulated with Ang II (100nM) or vehicle for 72 h, normalized to GAPDH; n=5 replicates from 4 PDE10A-WT mice and n=4 replicates from 4 PDE10A-KO mice. (F) PDE10A protein levels measured by western blotting in CMs isolated from PDE10A-WT mice and stimulated with Ang II (100nM) for 72 h; bar graph shows the average of n=4 replicates from 3 hearts. (G) PDE10A2 mRNA levels assessed by qPCR in CFs isolated from PDE10A-WT and -KO mice and stimulated with TGF-β (10ng/ml) or vehicle for 24 h, normalized to GAPDH; n=5 replicates from 4 PDE10A-WT mice and n=8 replicates from 5 PDE10A-KO mice. (H) PDE10A protein levels measured by western blot in CFs isolated from PDE10A-WT mice and stimulated with TGF-β (10ng/ml) for 24 h; bar graph shows the average of n=3 replicates from 3 hearts. All data represents the mean ± SEM. Statistics in A, E and G were performed using a two-way ANOVA and Holm-Sidak post-hoc test. Statistics in B-C, F and H were performed using a student t-test. *P < 0.05, ***P < 0.001, ****P < 0.0001.
Figure 2:
Figure 2:. PDE10A expression is upregulated in human failing hearts.
(A) PDE10A2 mRNA levels assessed by qPCR in human non-failing or failing heart tissues, normalized to GAPDH; n=5 for non-failing hearts; n=12 for failing hearts. (B) PDE10A protein levels measured by western blotting in human non-failing or failing heart tissues; bar graph shows the average of n=5 for non-failing hearts and n=10 for failing hearts. (C) PDE10A cAMP-hydrolyzing activity in human non-failing or failing heart tissues; n=5 for non-failing hearts; n=9 for failing hearts. (D) Immuno-histochemistry staining of PDE10A in the human non-failing and failing heart tissues. Arrows indicate activated cardiac fibroblasts (CFs). Asterisks indicate cardiac myocytes (CMs). Scale bars: 100 μm. Similar results were obtained from 3 pairs of tissue samples. Statistics in A-C were performed using a student t-test. *P < 0.05
Figure 3:
Figure 3:. PDE10A inhibition attenuates Ang II-stimulated cardiac myocyte hypertrophy in vitro.
(A) Representative images of cardiac myocytes (CMs) isolated from PDE10A-WT mice and pretreated with TP-10 (5 μM) or vehicle, followed by Ang II (100 nM) or vehicle treatment for 72 h. Cells were then fixed and photographed under a microscope. Scale bars: 100 μm. CM cell surface areas (CSAs) (B), width (C) and length (D) were averaged from n > 1500 CMs from 5–7 isolations. (E) [3H]-leucine incorporation in CMs; n = 5–6 replicates from 3 mice. (F) qPCR results showing the mRNA levels of β-MHC, normalized to GAPDH; n= 5–6 replicates from 3 mice. (G) PDE10A-WT CMs were infected with adenovirus expressing LacZ-GFP or PDE10A2-GFP for 24 hours. Cells were then treated with Ang II (100 nM), TP-10 (5 μM) as indicated for 48 hours. (H-M) CMs isolated from PDE10A-KO mice pretreated with TP-10 (5 μM) or vehicle, followed by Ang II (100nM) or vehicle treatment for 72 h. CSAs (H), width (I) and length (J) were averaged from n > 1500 myocytes from 5–7 isolations. (K) [3H]-leucine incorporation in CMs; n = 5–6 replicates from 3 mice. (L) qPCR results showing the mRNA levels of β-MHC, normalized to GAPDH; n= 5–6 replicates from 3 mice. (M) PDE10A-KO CMs were infected with adenovirus expressing LacZ-GFP or PDE10A2-GFP for 24 hours. Cells were then treated with Ang II (100 nM), TP-10 (5 μM) as indicated for 48 hours. CSAs were averaged from n > 500 CMs from 3 isolations. All data represents the mean ± SEM. Statistics were performed using a two-way ANOVA and Holm-Sidak post-hoc test. *P < 0.05, **P < 0.01, ***P < 0.001, ****P < 0.0001. n.s.: no significant difference.
Figure 4:
Figure 4:. PDE10A inhibition and deficiency attenuate TGF-β-stimulated cardiac fibroblast activation, proliferation, migration and ECM synthesis and in vitro.
Cardiac fibroblasts (CFs) isolated from PDE10A-WT or PDE10A-KO mice as indicated, serum starved for 24 h, and pretreated with TP-10 (5 μM) or vehicle, followed by TGF-β (10ng/ml) or vehicle treatment for 24 h or 48 h. mRNA levels of α-SMA (A) and Postn (B) were assessed via qPCR, normalized to GAPDH; n = 4–7 replicates from 3 mice. (C) PDE10A-WT CFs were pretreated with TP-10 (5 μM) or vehicle for 30 min prior to TGF-β (10 ng/ml) for 48 h. Cell proliferation was measured by CCK8 assay; n = 6–10 replicates from 3 mice. (D) After the monolayer formation, PDE10A-WT CFs were serum starved for 24 h and scratches were made in the monolayer. CFs were pretreated with TP-10 (5 μM) or vehicle for 30 min prior to TGF-β (10 ng/ml) for 18 h, and imaged for comparison of wound closure, n = 9–10 replicates from 4 mice. mRNA levels of Col1a1 (E) and Fn1 (F) were assessed via qPCR, normalized to GAPDH; n = 4–7 replicates from 3 mice. mRNA levels of α-SMA (G), Postn (H) were assessed via qPCR, normalized to GAPDH; n = 5–7 replicates from 3–5 mice. (I) PDE10A-WT or -KO CFs were stimulated with TGF-β (10 ng/ml) for 48 h. Cell proliferation was measured by CCK8 assay; n = 8–10 replicates from 3 mice. (J) After the monolayer formation, PDE10A-WT or -KO CFs were serum starved for 24 h and scratches were made in the monolayer. CFs were stimulated with TGF-β (10 ng/ml) for 18 h, and imaged for comparison of wound closure, n = 9–12 replicates from 4 mice. mRNA levels of Col1a1 (K) and Fn1 (L) were assessed via qPCR, normalized to GAPDH; n = 4–5 replicates from 3–5 mice. All data represents the mean ± SEM. Statistics were performed using a two-way ANOVA and Holm-Sidak post-hoc test. **P < 0.01, ***P < 0.001, ****P < 0.0001. n.s.: no significant difference.
Figure 5:
Figure 5:. PDE10A deficiency attenuates TAC-induced cardiac remodeling and dysfunction.
Male PDE10A-WT and PDE10A-KO mice at 8–12 week of age were subjected to TAC or sham operation for 8 weeks. (A) The survival curve of PDE10A-WT and PDE10A-KO mice after TAC surgery. P < 0.05, Log-Rank (Mantel-Cox) test. (B) Representative images of hematoxylin and eosin staining in mouse hearts after TAC or sham operation. Scale bars: 1000 μm. (C) Quantification of heart weight/tibia length. (D-G) Cardiac function was monitored via echocardiography at baseline and at 2, 4, 6 and 8 week points after the surgery: (D) representative M-mode echocardiographic images of each study group at 8 week point; (E) progressive percent fraction shortening, (F) left ventricular diameter at systole (LVID,s); and (G) left ventricular diameter at diastole (LVID,d). (H) Representative images of wheat germ agglutinin (WGA)-fluorescein isothiocyanate-staining in mouse hearts after TAC or sham, showing cardiac myocyte (CM) cross-sectional area (CSA). Scale bars: 20 μm. (I) Quantitative data of CM hypertrophy assessed by CSA; n = 3–12 hearts per group with 300–600 CMs analyzed per heart. (J) Representative images of heart sections stained with picrosirius red. Red staining shows fibrotic areas. Scale bars: 40 μm. (K) Quantification of total fibrosis. All data represents the mean ± SEM. Statistics in C, I and K were performed using a two-way ANOVA and Holm-Sidak post-hoc test. Statistics in E-G were performed using a repeated measures ANOVA and Holm-Sidak post-hoc test. *P < 0.05, **P < 0.01, ***P < 0.001, ****P < 0.0001 PDE10A-KO/TAC vs. PDE10A-WT/TAC; # P < 0.05, ## P < 0.01, ### P < 0.001, #### P < 0.0001 PDE10A-WT/TAC vs. PDE10A-WT/sham. Animal numbers: PDE10A-WT/sham: n = 3 in C, E-G, I and K; PDE10A-WT/TAC: n = 15 in A, n = 9 in C, n = 8 in E-G and K, n = 6 in I; PDE10A-KO/sham: n = 4 in C, E-G, I and K; PDE10A-KO/TAC: n = 16 in A, n = 15 in C, n =12 in E-G, I and K.
Figure 6:
Figure 6:. RNA-Seq identifies transcriptome that are dysregulated by PDE10A during heart failure pathogenesis.
(A) Principle component analysis (PCA) reveals the variance in transcriptome distribution in PDE10A-WT and PDE10A-KO hearts at sham and 8 weeks after TAC. Each point represents the projections of individual hearts onto principle component (PC). The majority of genetic variation is addressed by the first (PC1, 34.6%), followed by the second (PC2, 18.83%). (B) Heatmap of genes differentially expressed in PDE10A-WT or PDE10A-KO hearts at 8 weeks after TAC or sham. Each column represents an individual replicate and there are 3 replicates per group. Each row represents an individual gene. The top of heatmap is the cluster of genes that are upregulated in PDE10A-WT/TAC, while the bottom is the cluster of genes downregulated in PDE10A-WT/TAC compared to PDE10A-WT/sham or PDE10A-KO/sham and reversed in PDE10A-KO/TAC. The color bar represents relative expression of log-transformed, normalized counts with upregulated genes shown in red and downregulated genes in blue. (C) Volcano plot shows magnitude and significance of genes that altered in PDE10A-KO hearts versus PDE10A-WT hearts after TAC. Genes that significantly downregulated (left) and upregulated (right) in PDE10A-KO/TAC versus PDE10A-WT/TAC are plotted in red. Representative known genes involved in pathologic remodeling, such as Myh7, Nppa, Tgfb2, Ctgf, Timp1, Postn and Col1a1, are picked out (black dots) for each volcano plot. (D) Kyoto Encyclopedia of Genes and Genomes (KEGG) pathway analysis of differentially expressed genes in PDE10A-WT and PDE10A-KO after TAC. Signaling pathways are organized in the order of significance as -log10 of P value. P value was corrected by Benjamini & Hochberg multiple test, which < 0.05 was considered significant. (E) Gene list in each KEGG signaling pathway. The color bar represents relative expression of log2-transformed. (F) qPCR validation of cardiac hypertrophic genes Nppa and Myh7, muscle contraction genes Tnni2 and Cox7a1, cardiac fibrotic genes Postn, Col1a1, Fn1, Mmp14 and Tgfb2, hippo signaling related genes Timp1 and Amot, and HIF-1 signaling related genes Hif1a and Plcg2 identified by RNA-seq in the hearts of PDE10A-WT or PDE10A-KO mice after sham or TAC surgery, normalized to GAPDH; n = 3 hearts per group. The color bar represents relative expression of log-transformed.
Figure 7:
Figure 7:. TP-10 attenuates Ang II-induced cardiac remodeling and cardiac fibrosis by specifically inhibiting PDE10A.
PDE10A-WT and PDE10A-KO mice at 8–12 week of age were infused with saline or Ang II (1.4 mg/kg/day) for 2 weeks and administered vehicle or TP-10 (3.2 mg/kg/day) daily via s.c. injection for 16 days (2 days prior and 14 days during Ang II infusion). (A) Experiment timeline. (B) Quantification of heart weight/body weight. (C-D) qPCR analysis of heart failure genes ANP (C) and β-MHC (D) in the hearts of PDE10A-WT or PDE10A-KO mice after saline or Ang II infusion and treatment as indicated, normalized to GAPDH. (E) Representative images of wheat germ agglutinin (WGA)-fluorescein isothiocyanate-staining in mouse hearts showing cardiac myocyte (CM) cross-sectional area (CSA). Scale bars: 20 μm. (F) CM hypertrophy was quantified by assessing CSA from WGA staining; n = 3–9 hearts per group with 300–500 cardiac myocytes measured per heart. (G) Representative images of heart sections stained with picrosirius red. Red staining shows fibrotic areas. Scale bars: 100 μm. (H) Quantification of total fibrosis. (I) qPCR analysis of fibrotic genes Col1a1 in the hearts of PDE10A-WT or PDE10A-KO mice after saline or Ang II infusion and treatment as indicated, normalized to GAPDH. All data represents the mean ± SEM. Statistics were performed using a two-way ANOVA and Holm-Sidak post-hoc test. *P < 0.05, **P < 0.01, ***P < 0.001, ****P < 0.0001. n.s.: no significant difference. Animal numbers: PDE10A-WT/saline infusion/vehicle: n = 5 in B-D, F and H-I; PDE10A-WT/saline infusion/TP-10: n = 4 in B-D, F and H-I; PDE10A-WT/Ang II infusion/vehicle: n = 6 in B-D and I, n = 7 in F-H; PDE10A-WT/Ang II infusion/TP-10: n = 7 in B, n = 6 in C-D and I, and n = 9 in F-H; PDE10A-KO/saline infusion/vehicle: n = 3 in B-D, F and H-I; PDE10A-KO/saline infusion/TP-10: n = 3 in B-D, F and H-I; PDE10A-KO/Ang II infusion/vehicle: n = 5 in B, D, F and H-I, and n = 4 in C; PDE10A-KO/Ang II infusion/TP-10: n = 5 in B, D, F and H, n = 3 in C, and n = 4 in I.
Figure 8:
Figure 8:. TP-10 intervenes the progression of pre-stimulated cardiac remodeling and dysfunction.
Male WT mice at 8–12 week of age were subjected to TAC or sham operation for 8 weeks. Mice were then randomized to receive either TP-10 (3.2mg/kg/day) or vehicle treatment 2 weeks after sham or TAC and the drug treatment was continued for 6 weeks. (A) Experiment timeline. (B) Representative images of hematoxylin and eosin staining in mouse hearts after TAC or sham operation with vehicle or TP-10 treatment as indicated. Scale bars: 1000 μm. (C) Quantification of heart weight/tibia length. (D-E) Cardiac function was monitored via echocardiography at baseline and at 2, 4, 6 and 8 week points after the surgery. (D) representative M-mode echocardiographic images of each study group. (E) progressive percent fraction shortening. (F) Representative images of wheat germ agglutinin (WGA)-fluorescein isothiocyanate-staining in mouse, showing cardiac myocyte (CM) cross-sectional area (CSA). Scale bars: 20 μm. (G) Quantitative data of CM hypertrophy assessed by CSA; n = 3–6 hearts per group with 150–300 CMs analyzed per heart. (H) qPCR analysis of heart failure genes ANP, normalized to GAPDH. (I) Representative images of heart sections stained with picrosirius red. Red staining shows fibrotic areas. Scale bars: 40 μm. (J) Quantification of total fibrosis. (K) qPCR analysis of fibrotic genes Col1a1, normalized to GAPDH. All data represents the mean ± SEM. Statistics in C, G-H and J-K were performed using a two-way ANOVA and Holm-Sidak post-hoc test. Statistics in E was performed using a repeated measures ANOVA and Holm-Sidak post-hoc test. *P < 0.05 WT/TAC/TP-10 vs. WT/TAC/vehicle; # P < 0.05, ## P < 0.01 WT/TAC/vehicle vs. WT/sham/vehicle. Animal numbers: WT/sham/vehicle: n = 3 in C, E, G-H and J-K; WT/sham/TP-10: n = 4 in C, E, G-H and J-K; WT/TAC/vehicle: n = 7 in C, E, G, n = 5 in H and K, n = 8 in J; WT/TAC/TP-10: n = 7 in C, n = 8 in E, G and J, n = 5 in H and K.

Comment in

Similar articles

Cited by

References

    1. Frey N and Olson EN. Cardiac hypertrophy: the good, the bad, and the ugly. Annu Rev Physiol. 2003;65:45–79. - PubMed
    1. Benjamin EJ, Virani SS, Callaway CW, Chamberlain AM, Chang AR, Cheng S, Chiuve SE, Cushman M, Delling FN, Deo R, de Ferranti SD, Ferguson JF, Fornage M, Gillespie C, Isasi CR, Jimenez MC, Jordan LC, Judd SE, Lackland D, Lichtman JH, Lisabeth L, Liu S, Longenecker CT, Lutsey PL, Mackey JS, Matchar DB, Matsushita K, Mussolino ME, Nasir K, O’Flaherty M, Palaniappan LP, Pandey A, Pandey DK, Reeves MJ, Ritchey MD, Rodriguez CJ, Roth GA, Rosamond WD, Sampson UKA, Satou GM, Shah SH, Spartano NL, Tirschwell DL, Tsao CW, Voeks JH, Willey JZ, Wilkins JT, Wu JH, Alger HM, Wong SS, Muntner P, American Heart Association Council on E, Prevention Statistics C and Stroke Statistics S. Heart Disease and Stroke Statistics-2018 Update: A Report From the American Heart Association. Circulation. 2018;137:e67–e492. - PubMed
    1. Hill JA and Olson EN. Cardiac plasticity. N Engl J Med. 2008;358:1370–1380. - PubMed
    1. Porter KE and Turner NA. Cardiac fibroblasts: at the heart of myocardial remodeling. Pharmacol Ther. 2009;123:255–278. - PubMed
    1. Guellich A, Mehel H and Fischmeister R. Cyclic AMP synthesis and hydrolysis in the normal and failing heart. Pflugers Arch. 2014;466:1163–1175. - PubMed

Publication types

Substances