

Malnutrition as predictor of survival from anti-retroviral treatment among children living with HIV/AIDS in Southwest Ethiopia: survival analysis
- PMID: 31801487
- PMCID: PMC6892183
- DOI: 10.1186/s12887-019-1823-x
Malnutrition as predictor of survival from anti-retroviral treatment among children living with HIV/AIDS in Southwest Ethiopia: survival analysis
Abstract
Background: Approximately 70% of HIV positive people live in Africa where food insecurity and under nutrition are endemic. However the impact of malnutrition on treatment outcome is not clear. This study assessed the effect of under nutrition on Anti-Retroviral Therapy treatment outcome among pediatric age group living with HIV/AIDS in Public Hospitals, Southwest Ethiopia.
Method: A retrospective cohort study was conducted on records of 242 pediatric children in Guraghe zone Public Hospitals. Also median, mean, standard deviation and interquartile range were calculated. Life table, hazard function and survival function were plotted. Log rank test with 95% confidence interval of mean survival time was done. The nutritional status data were managed via WHO Anthros plus and BMI for age Z score was calculated. To assess effects of nutritional status on mortality, both Bivariate and multivariate cox proportional hazard regression was conducted with crude (CHR) and adjusted hazard ratio (AHR) (95% confidence interval and p value). P value of less than 0.05 was used as cut off point to declare statistical significance.
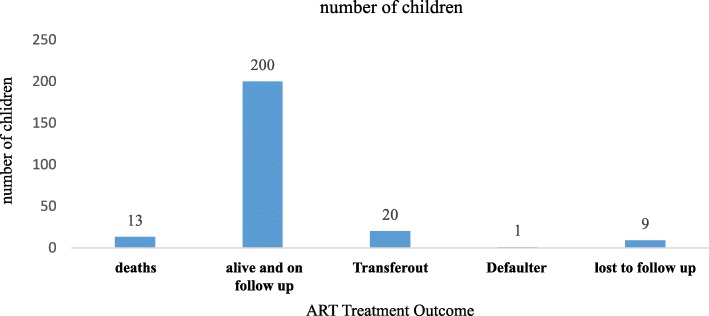
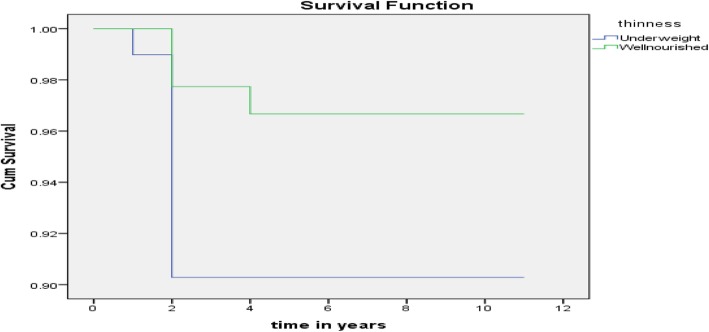
Results: A total of 243 records of pediatric ART records with mean age of 11.6 (± 3.8 years) were reviewed. About 178 (73.3%) have got therapeutic feeding on the course of ART treatment. Whereas significant number of children, 163 (67.1%) reported to had eating problems. A total of 13 (5.3%) children were dead with incidence density of 11.2 deaths per 1000 person years. There is significantly higher survival time among well nourished (11.1 years with 95% CI: 10.8 to 11.4) as compared to underweight children (9.76 with 95% CI: 9.19 to 10.32 years). Underweight children had almost three fold increase incidence of death (AHR = 3.01; 95% CI: 0.80-11.4). Similarly children with anemia had higher incidence of death than children without anemia (AHR = 1.55; 95% CI: 0.49-4.84).
Conclusions: Low nutritional status at the start of ART evidenced by underweight and anemia were found to be predictors of survival among HIV positive children. There should be improved, sustained and focused nutritional screening, care and treatment for children on ART follow up.
Keywords: Children; HIV/AIDS; Predictor; Treatment outcome; Under nutrition.
Conflict of interest statement
The authors declare that they have no competing interests.
Figures
References
-
- UNAIDS . Global nutrition report multi-sectoral nutrition strategy technical brief: nutrition, food security and HIV. 2015.
-
- PINSTRUP-ANDERSEN P. (Ed.). The African Food System and Its Interactions with Human Health and Nutrition. Cornell University Press; 2010. Retrieved from https://www.jstor.org/stable/10.7591/j.ctt7zd0x. - DOI
-
- Kalofonos IA. “All I eat is ARVs”: the paradox of AIDS treatment interventions in central Mozambique. Med Anthropol Q. 2010;24(3):363–380. - PubMed
Publication types
MeSH terms
Substances
LinkOut - more resources
Full Text Sources
Medical
