. 2019 Dec 5;17(1):219.
doi: 10.1186/s12916-019-1450-2.

Determinants of high residual post-PCV13 pneumococcal vaccine-type carriage in Blantyre, Malawi: a modelling study

Affiliations

Determinants of high residual post-PCV13 pneumococcal vaccine-type carriage in Blantyre, Malawi: a modelling study

J Lourenço et al. BMC Med. .

Abstract

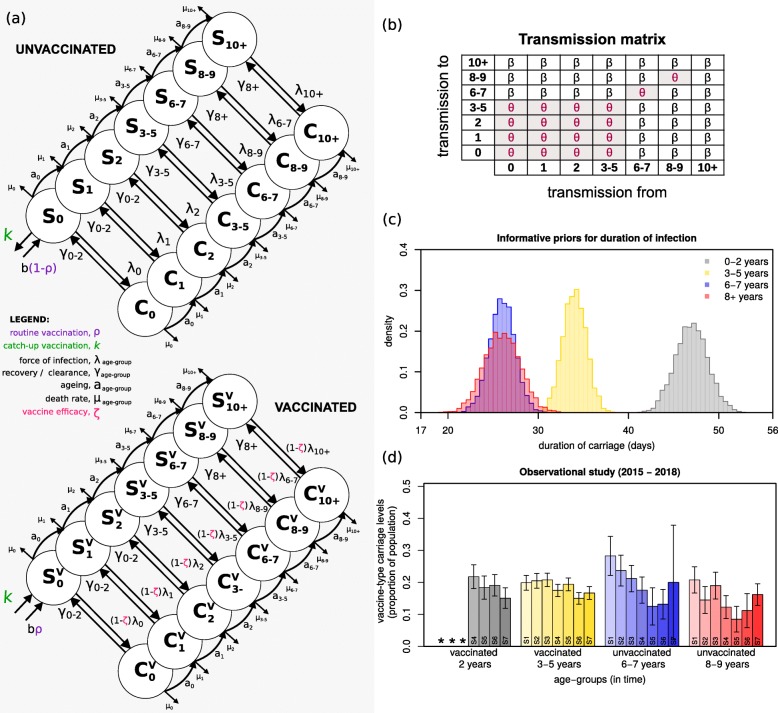
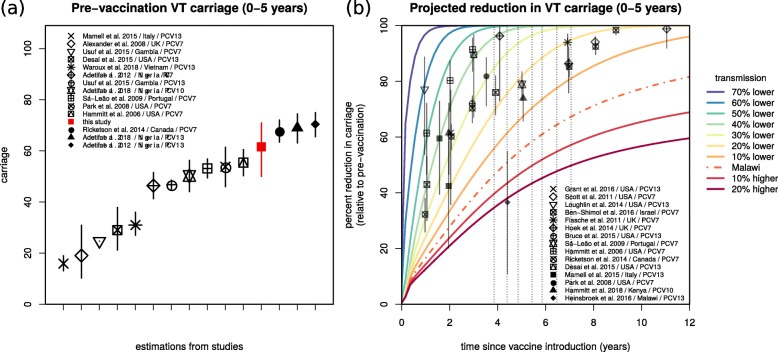
Background: In November 2011, Malawi introduced the 13-valent pneumococcal conjugate vaccine (PCV13) into the routine infant schedule. Four to 7 years after introduction (2015-2018), rolling prospective nasopharyngeal carriage surveys were performed in the city of Blantyre. Carriage of Streptococcus pneumoniae vaccine serotypes (VT) remained higher than reported in high-income countries, and impact was asymmetric across age groups.

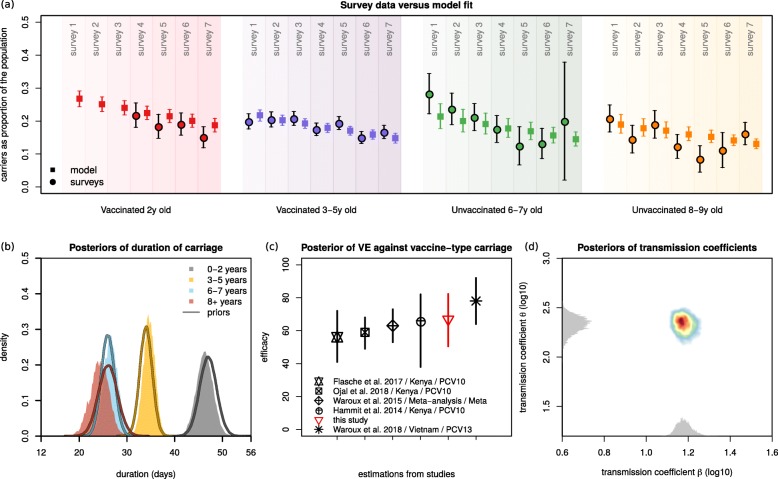
Methods: A dynamic transmission model was fit to survey data using a Bayesian Markov-chain Monte Carlo approach, to obtain insights into the determinants of post-PCV13 age-specific VT carriage.

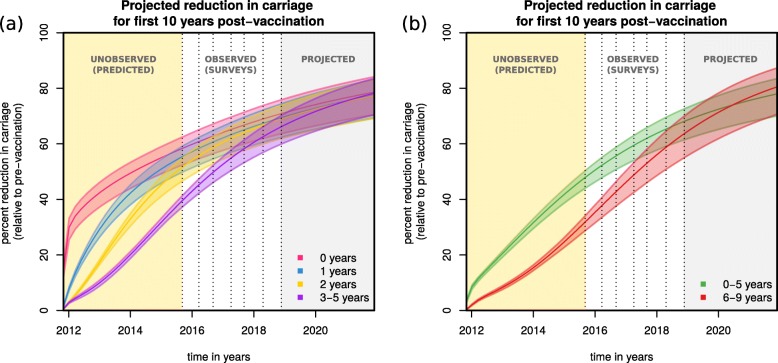
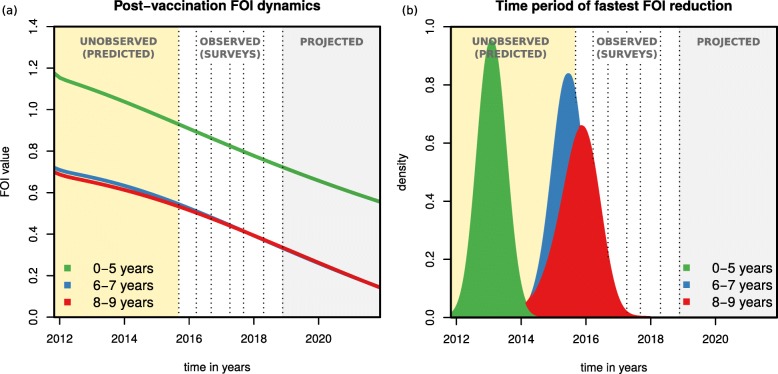
Results: Accumulation of naturally acquired immunity with age and age-specific transmission potential were both key to reproducing the observed data. VT carriage reduction peaked sequentially over time, earlier in younger and later in older age groups. Estimated vaccine efficacy (protection against carriage) was 66.87% (95% CI 50.49-82.26%), similar to previous estimates. Ten-year projected vaccine impact (VT carriage reduction) among 0-9 years old was lower than observed in other settings, at 76.23% (CI 95% 68.02-81.96%), with sensitivity analyses demonstrating this to be mainly driven by a high local force of infection.

Conclusions: There are both vaccine-related and host-related determinants of post-PCV13 pneumococcal VT transmission in Blantyre with vaccine impact determined by an age-specific, local force of infection. These findings are likely to be generalisable to other Sub-Saharan African countries in which PCV impact on carriage (and therefore herd protection) has been lower than desired, and have implications for the interpretation of post-PCV carriage studies and future vaccination programs.

Keywords: Intervention; Malawi; Modelling; Pneumococcus; pcv13.


Conflict of interest statement

Dr. Bar-Zeev reports investigator-initiated research grants from GlaxoSmithKline Biologicals and from Takeda Pharmaceuticals outside the submitted work. The authors declare that they have no competing interests.

Figures

Fig. 1
Fig. 1
Survey data and model framework, priors and transmission matrix. a Seven age groups were modelled: 0, 1, 2, 3–5, 6–7, 8–9, 10+ years of age (circles), each divided into unvaccinated (top) and vaccinated (bottom). Labels aage group mark ageing rates per age class; μage group mark age-specific death rates; b marks births, at which point a proportion (ρ) are vaccinated (purple); ζ marks vaccine-induced protection, expressed as reduction in susceptibility to infection of vaccinated individuals (magenta); λage group mark age-specific forces of infection; γage group mark age-specific rates of clearance from infection; k marks catch-up vaccination (green). b The transmission matrix used, with coefficients β and θ, where θ is the specific coefficient for transmission within and between particular age groups. β and θ are estimated when fitting the survey data. c The informative priors used in the fitting exercise for mean (standard deviation) infectious periods (days) of 47 (1.8) for 0–2 years old; 34 (1.3) for 3–5 years old; 26 (1.4) for 6–8 years old; 26 (2.0) for 8+ years old. The posterior values of these periods (1/γ0–2, 1/γ3–5, 1/γ6–8, 1/γ8+) are estimated when fitting the survey data. d Mean and standard error for carriage as reported in the observational study data (surveys) per age group (Additional file 1: Table S7). S1 to S7 highlight the surveys 1 to 7. The * mark data that was not collected
Fig. 2
Fig. 2
Model fit and estimated posteriors. a Model fit to carriage data from the observational study for different age groups: vaccinated 2 years old (red), vaccinated 3–5 years old (purple), unvaccinated 6–7 years old (green) and unvaccinated 8–9 years old (orange). The survey data is represented by full circles, the model output by full squares (data in Fig. 1d, Additional file 1: Table S7). b Priors (lines) and estimated posterior distributions (shaded) of duration of carriage per age group. c Visual comparison of the estimated mean and 95% CI of posterior of vaccine efficacy against vaccine-type carriage (red) in the context of estimates from other studies (in legend, Additional file 1: Table S2). d The estimated posterior distributions of the transmission coefficients β and θ are shown in two dimensions (coloured area). The estimated actual distribution for β is in the x-axis and θ in the y-axis (visualised in grey). Note that, for visualisation purposes, the axes are log10-transformed and the grey distributions’ height has no scale (height is not quantified). ad Solutions presented are obtained from sampling 100,000 parameter values from posteriors and simulating the dynamic model
Fig. 3
Fig. 3
Projections of post-vaccination vaccine-type carriage reduction. a Projected reduction in carriage relative to the pre-vaccination era for age groups 0 years (magenta), 1 year (blue), 2 years (yellow) and 3–5 years (purple) old. b Projected reduction in carriage relative to the pre-vaccination era for aggregated age groups 0–5 years (green) and 6–9 years (red) old (with corresponding 95% CIs). a, b Solutions presented are obtained from sampling 100,000 parameter values from posteriors and simulating the dynamic model. The shaded areas are yellow for the post-vaccination period with no carriage data, white for the post-vaccination period with data, and grey for the post-vaccination projected period up to 10 years. Dotted vertical lines mark survey dates. The x-axis origin marks PCV13 introduction
Fig. 4
Fig. 4
Projections of post-vaccination changes in the force of infection. a The post-vaccination force of infection (FOI) of different age groups (0–5 years in green, 6–7 in blue and 8–9 in red) as calculated for each of 100,000 simulations using parameter samples from posteriors. b For each FOI of each age group and each 100,000 simulations using parameter samples from posteriors, the time point of minimum derivative was calculated, resulting in one distribution per age group (coloured curves, 0–5 years in green, 6–7 in blue, 8–9 in red). This time point is as a proxy for the period of fastest FOI reduction. The shaded areas are yellow for the post-vaccination period with no carriage data, white for the post-vaccination period with data, and grey for the post-vaccination projected period up to 10 years. Dotted vertical lines mark survey dates. The x-axis origin marks PCV13 introduction
Fig. 5
Fig. 5
Estimated vaccine-type carriage and sensitivity of projections to baseline transmission in the context of other studies. a Estimated pre-vaccination vaccine-type carriage (and 95% CI) for the age group 0–5 years of age (red) in the context of carriage levels reported in other studies (in legend, Additional file 1: Table S6). b The baseline transmission coefficient (β) is varied by considering the 70%, 60%, 50%, 40%, 30%, 20% and 10% lower and 10% and 20% higher transmission than the estimated for Blantyre (Malawi, βMalawi) when fitting the observational study (e.g. 10% lower is 0.9*βMalawi). The impact projections for the age group 0–5 years old using the β estimated for Blantyre (Malawi) are presented by the dashed line (as in Fig. 3b). For visual purposes only, the means are shown, obtained from simulations sampling 100,000 parameter values from posteriors. The symbols and whiskers are measures of reported impact (carriage reduction) and 95% CIs for several published studies (in legend, Additional file 1: Table S5). The grey arrows mark the year of PCV13 introduction and the years of the four surveys

References

    1. Brown J, Hammerschmidt S, Orihuela C, editors. Streptococcus Pneumoniae: molecular mechanisms of host-pathogen interactions. 1st ed: Elsevier; 2015. 10.1016/C2012-0-00722-3.
    1. Levine OS, O’Brien KL, Knoll M, et al. Pneumococcal vaccination in developing countries. Lancet. 2006;367:1880–1882. doi: 10.1016/S0140-6736(06)68703-5. - DOI - PubMed
    1. Simell B, Auranen K, Käyhty H, Goldblatt D, Dagan R, O’Brien KL. The fundamental link between pneumococcal carriage and disease. Expert Rev Vaccines. 2012;11:841–855. doi: 10.1586/erv.12.53. - DOI - PubMed
    1. Weinberger DM, Malley R, Lipsitch M. Serotype replacement in disease after pneumococcal vaccination. Lancet. 2011;378:1962–1973. doi: 10.1016/S0140-6736(10)62225-8. - DOI - PMC - PubMed
    1. Watkins ER, Penman BS, Lourenço J, et al. Vaccination drives changes in metabolic and virulence profiles of Streptococcus pneumoniae. PLoS Pathog. 2015;11:e1005034. doi: 10.1371/journal.ppat.1005034. - DOI - PMC - PubMed

Publication types

Substances