. 2019 Dec;576(7786):274-280.
doi: 10.1038/s41586-019-1815-x. Epub 2019 Dec 4.

The molecular landscape of ETMR at diagnosis and relapse

Sander Lambo  1   2   3 Susanne N Gröbner  1   2   3 Tobias Rausch  4 Sebastian M Waszak  4 Christin Schmidt  1   2   3 Aparna Gorthi  5   6 July Carolina Romero  5   6 Monika Mauermann  1   2   3 Sebastian Brabetz  1   2   3 Sonja Krausert  1   2   3 Ivo Buchhalter  7 Jan Koster  8 Danny A Zwijnenburg  8 Martin Sill  1   2   3 Jens-Martin Hübner  1   2   3 Norman Mack  1   2   3 Benjamin Schwalm  1   2   3 Marina Ryzhova  9 Volker Hovestadt  10 Simon Papillon-Cavanagh  11 Jennifer A Chan  12 Pablo Landgraf  13 Ben Ho  14 Till Milde  1   3   15   16 Olaf Witt  1   3   15   16 Jonas Ecker  1   15   16 Felix Sahm  1   3   17   18 David Sumerauer  19 David W Ellison  20 Brent A Orr  20 Anna Darabi  21 Christine Haberler  22 Dominique Figarella-Branger  23   24 Pieter Wesseling  25   26 Jens Schittenhelm  27   28 Marc Remke  3   29   30 Michael D Taylor  30 Maria J Gil-da-Costa  31 Maria Łastowska  32 Wiesława Grajkowska  32 Martin Hasselblatt  33 Peter Hauser  34 Torsten Pietsch  35 Emmanuelle Uro-Coste  36   37 Franck Bourdeaut  38 Julien Masliah-Planchon  39   40 Valérie Rigau  41   42 Sanda Alexandrescu  43 Stephan Wolf  44 Xiao-Nan Li  45   46   47 Ulrich Schüller  48   49   50 Matija Snuderl  51 Matthias A Karajannis  52 Felice Giangaspero  53   54 Nada Jabado  11 Andreas von Deimling  1   17   18 David T W Jones  1   3   55 Jan O Korbel  4 Katja von Hoff  56   57 Peter Lichter  3   10 Annie Huang  14   58 Alexander J R Bishop  5   6   59 Stefan M Pfister  1   2   3   16 Andrey Korshunov  17   18 Marcel Kool  60   61   62
Affiliations

The molecular landscape of ETMR at diagnosis and relapse

Sander Lambo et al. Nature. 2019 Dec.

Abstract

Embryonal tumours with multilayered rosettes (ETMRs) are aggressive paediatric embryonal brain tumours with a universally poor prognosis1. Here we collected 193 primary ETMRs and 23 matched relapse samples to investigate the genomic landscape of this distinct tumour type. We found that patients with tumours in which the proposed driver C19MC2-4 was not amplified frequently had germline mutations in DICER1 or other microRNA-related aberrations such as somatic amplification of miR-17-92 (also known as MIR17HG). Whole-genome sequencing revealed that tumours had an overall low recurrence of single-nucleotide variants (SNVs), but showed prevalent genomic instability caused by widespread occurrence of R-loop structures. We show that R-loop-associated chromosomal instability can be induced by the loss of DICER1 function. Comparison of primary tumours and matched relapse samples showed a strong conservation of structural variants, but low conservation of SNVs. Moreover, many newly acquired SNVs are associated with a mutational signature related to cisplatin treatment. Finally, we show that targeting R-loops with topoisomerase and PARP inhibitors might be an effective treatment strategy for this deadly disease.


Conflict of interest statement

Declaration of Interests

The authors declare no competing interests

Figures
Extended Data Figure 1.
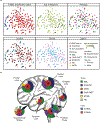
Extended Data Figure 1.. Clinicopathological differences are not associated with molecular subgrouping.
a, t-SNE clustering analysis of DNA methylation profiles of 193 ETMRs. Samples were colored according to their clinical, histological or molecular annotation. b, Schematic representation of location (position of the circle), histological diagnosis (outer ring) and C19MC status (inner ring) of ETMRs. Circle size denotes the relative number of primary tumors that have been diagnosed in each part of the brain, each wedge representing one tumor. Tumors could be assigned to multiple locations depending on the diagnosis. Tumors were excluded for which no information on the site of occurrence was available.
Extended Data Figure 2.
Extended Data Figure 2.. miRNA expression correlates strongly between ETMRs with or without C19MC amplification.
a, Supervised clustering of the 416 differentially expressed mature miRNAs (two-sided neg. binomial, BH adjusted p-value <0.05) between ETMRs (n=7) (excluding ETMRs without amplification) and other tissues (n=38). b, Unsupervised clustering of mature miRNAs with a minimum expression of 32 in at least one sample and a variance higher than 10 between all samples (n=294). Hierarchical clustering using average as distance measure was used to cluster the samples after values were z-score normalized. c-g, Regression of the median expression of mature miRNAs derived from ETMRs (n=7) against normal brain (n=8), other entities (n=10 for all entities) or ETMRs without C19MC amplification (n=3). miRNAs that had a median expression under 32 RPM in either of the compared entities were excluded. miRNAs that were differentially expressed between ETMRs (with and without C19MC amplification) against other entities (two-sided neg. binomial, BH adjusted p-value <0.05) were highlighted. For each comparison, the Pearson correlation was calculated (p-value <0.0005 for all comparisons).
Extended Data Figure 3.
Extended Data Figure 3.. KEGG pathway enrichment in ETMRs.
a-b, Summary of KEGG pathway enrichment of ETMRs (n=28) against normal brain (n=38) (a) or 580 different brain tumors (b). Pathways are colored by similarity based on NaviGO co-occurrence scores and manual assessment. Significantly upregulated genes were calculated using ANOVA (FDR adjusted p-value <0.01).
Extended Data Figure 4.
Extended Data Figure 4.. ETMRs consist of at least two distinct subtypes of cells
a, Heatmap showing z-score normalized expression of 450 DNA repair genes and the corresponding pathways for 190 tumors of different entities including 28 ETMRs. Supervised clustering was used and samples were sorted by entity or C19MC amplification status. Entities include three ATRT subgroups, four MB subgroups, CNS EFT-CIC, CNS-NB FOXR2, HGNET-MN1, HGNET-BCOR, ETMRs with amplification of C19MC (red) and ETMRs without amplification (blue). ETMR subsets were manually assessed based on DNA repair pathway expression. b, Debulking of mRNA expression using CIBERsort by using the median expression of scRNA-seq data of the forebrain as gene signature. The cumulative fraction of each cell type was calculated and samples were sorted according to the percentage of modeled neural stem cells. Samples were annotated based on the subsets derived from a. c, Boxplots showing expression of stem cell markers (HMGA2, LIN28A), astrocyte markers (AQP4, GFAP) and genes involved in the DNA damage response (WEE1, CHEK2) in ETMRs with high DNA repair expression (n=18) and low DNA repair expression (n=10). P-values were calculated using a two-sided Mann-Whitney U test (***= P<0.0005, **= P<0.005, *= P<0.05, NS= not significant). Boxes show the median, first and third quartile and whiskers extending to 1.5x the interquartile range. d, Distribution of histology annotation of 18 ETMRs for which these data were available divided into two subsets. The number of EBL phenotypes was significantly enriched in the high DNA repair expression group using a two-sided Fisher’s exact test (P-value = 3.7E-02). e, t-SNE clustering based on methylation profiles of a micro-dissected ETMR (ET174) (split in bulk, rosettes and neuropil) and 192 other ETMRs. f, Expression of LIN28A and AQP4 in rosette tissue and neuropil tissue of the same tumor. g, Copy number profiles of micro-dissected neuropil and rosettes from the same tumor. h, Fold change of expression of six markers in two matched recurrences normalized to the primary tumor.
Extended Data Figure 5.
Extended Data Figure 5.. Recurrent events in ETMRs without C19MC amplification.
a, Schematic representation of the translocation / amplification of a region on chromosome 11 with the host-gene of the miR-17–92 miRNA cluster (MIR17HG) shown in red on chromosome 13. Regions were reconstructed using mate-pair sequencing. The actual amplified region is circular denoted by arrows on each end. b, Copy number profile of a tumor harboring the miR-17–92 cluster translocation / amplification. Copy numbers were derived from methylation array data with each dot representing a probe. Inset shows validation of both the chromosome 11 (YAP1; green) and chromosome 13 (MIR17HG; red) amplifications using FISH. c, Quantification of mature miRNAs in the miR-17–92 miRNA cluster (n=20) confirms that the ETMR (blue) with the chromosome 11 and chromosome 13 amplification/translocation has higher expression of miR-17–92 cluster miRNAs. Each bar represents one tumor corresponding to the given entity. P-values were calculated using a one-sided Mann-Whitney U test (*= P<0.05). d, Example of a copy number profile of a case showing clustered rearrangements around C19MC. This case did not have a C19MC amplification or DICER1 mutations. e, Copy number profile of an ETMR without C19MC amplification or DICER1 mutation showing an overall instable genome with many regions containing clustered breakpoints.
Extended Data Figure 6.
Extended Data Figure 6.. ETMRs recurrently show genomic instability
a, Oncoplot showing the co-occurrence of all CNVs separated by C19MC amplification status. b, Overview of copy number profiles of all ETMRs (n=193). Bars (gain, balanced, loss) add up to 100% for each chromosome arm. c, Overview of copy number profiles of all ETMRs with (n=170) or without (n=23) C19MC amplification. P-values were calculated using a two-sided Fisher’s exact tests and adjusted for multiple testing (BH) (*** P<0.0005, ** P<0.005, * P<0.05, NS= not significant). d, Overview of CNVs in matched primary tumor and recurrence pairs for the most variable CNVs. Events (copy number changes, clustered breakpoints or increases in ploidy) that were gained upon recurrence have a thicker outline. Percentages denote the percentage of matched samples acquiring a CNA or genome duplication. e, Example of a case in which polyploidy was validated using FISH (n=28 tested samples), the chromosome 9 and 11 centromeres were used as probes. f, Examples of cases showing clustered breakpoints on chromosome 19. Chromosome 19 is shown as a circular representation, translocations to other chromosomes were annotated as single positions. All SVs were detected using mate pair sequencing.
Extended Data Figure 7.
Extended Data Figure 7.. Conservation of events for individual cases.
Summary of events occurring in seven matched primary tumors compared to recurrences (first second or third relapse) and two matched relapses. For every sample conservation of SNVs is given as a graph with the allele frequencies (AF) of the primary tumor on the x-axis and the recurrence on the y-axis. In the last panel two matched recurrences are shown with a recurrence on each axis. Boxes show events that are lost, conserved or gained. Each comparison has a table showing the total number of events in each quadrant (lost: AF primary >10% and AF recurrence < 2%, stable: AF primary >20% and AF recurrence >20% and gained: AF primary < 2% and AF recurrence >10%). Conservation of SVs is given as a circular representation of the genome having the CNVs from the primary tumor in the outer rim and the recurrence in the inner rim. SVs were colored by detection in either only the primary tumor (red), only in the relapse (grey) or in both (blue). Each combination also has a Venn diagram showing the total number of SVs that were detected in the primary tumor, the recurrence or both.
Extended Data Figure 8.
Extended Data Figure 8.. Mutations in primary tumors and relapses
a, Boxplots showing the total number of SNVs or indels in primary tumors (n=20) compared to relapses (n=12). Boxes show the median, first and third quartile and whiskers extending to 1.5x the interquartile range. We detected, on average, 1180 SNVs (range: 339–2544) and 468 indels (range: 299 – 1026) in primary tumors and 5162 SNVs (range: 2992–7773) and 847 indels (range: 554–1187) in relapsed tumors throughout the genome. In coding regions, there were on average 14 non-synonymous SNVs (range: 3 – 45) and two indels (range: 0 – 7) in primary tumors and 59 non-synonymous SNVs (range: 37 – 92) and six indels (range: 2 – 11) in relapsed tumors. b, Barchart showing the percentage of substitutions of either the combined primary tumors (n=20) or combined relapses (n=12) divided by substitution type and affected strand for SNVs residing in transcribed regions. Transcriptional asymmetry is defined as the difference between the amount of SNVs on the transcribed strand versus the untranscribed strand for each substitution type. Error bars denote mean ± s.e.m, P-values were calculated using two-sided Poisson tests (*** P<0.0005, ** P<0.005, * P<0.05, NS= not significant). c, Substitution type probability based on the 96 different trinucleotide contexts for a matched primary relapsed pair shown in d. compared to a cisplatin signature and new pediatric cancer signature (P1). d, Cosine similarity between the cisplatin signature and other signatures (n=36). P-values were calculated using an M-test after comparing all signatures pairwise (*** P<0.0005, ** P<0.005, * P<0.05, NS= not significant).
Extended Data Figure 9.
Extended Data Figure 9.. ETMRs have dense and strongly conserved C>T and C>G mutations around breakpoints.
a, Rainfall plot showing an example of kataegis around C19MC. Every point represents a somatic SNV colored by substitution type, the x-axis represents the position in the genome and the position on the y-axis represents the density of SNVs. b, Lollipop plot showing SNVs per 1kb in a region of 10000 bp surrounding breakpoints for all ETMRs. Pins represent the percentage of substitution types of all SNVs within 1kb, while the height of the lollipops represents the substitutions per kb. c, Barchart showing the percentages of substitution types in regions 10kb around breakpoints (left, n= 543 SNVs) and the rest of the genome (right, n= 84991 SNVs). P-values were calculated using a one-sided Fisher’s exact test and annotated as *** P<0.0005, ** P<0.005, * P<0.05 or NS= not significant. d, Combined mutation density of four primary tumors colored by conservation in the matched recurrence (blue is conserved, grey is not conserved) as shown by a rainfall plot in the upper panel, density distribution is shown in the middle panel and breakpoint density is shown in the lower panel. e, Graph of allele frequencies (AF) of all primary (x-axis) versus relapse (y-axis). Boxes show conservation (lost: AF primary >10% and AF recurrence < 2%, conserved: AF primary >20% and AF recurrence >20% and gained: AF primary < 2% and AF recurrence >10%) (n=2100 SNVs over 20% allele frequency in the primary tumor). P-value was calculated using a two-sided Chi-square test f, Barchart showing the percentage of substitution types for SNVs in each quadrant (lost: AF primary >10% and AF recurrence < 2%, conserved: AF primary >20% and AF recurrence >20% and gained: AF primary < 2% and AF recurrence >10%). g, Graph showing the ratio of conserved SNVs against not conserved SNVs in regions around breakpoints with increasing sizes. Conservation is defined as SNVs with an allele frequency over 20% in the primary tumor and an allele frequency over 20% in the recurrence, SNVs with an allele frequency lower than 20% in the recurrence but higher than 20% in the primary tumor were defined as not conserved. P-value between 10kb around breakpoints and the rest of the genome using a two-sided Chi-square test (n=2100, p-value 5.4e-11).
Extended Data Figure 10.
Extended Data Figure 10.. Context of R-loops and DNA damage in ETMRs and after Dicer1 KO
a, Genome-wide density of R-loops in ETMRs, R-loops in Ewing sarcoma (EWS), RLFS and gene density. b, Representation of SVs genome-wide and their breakpoint context. Outer layers show the density of DRIP peaks (blue) or RLFS (red). The inner part shows all SVs from ETMRs sequenced using WGS, depicting SVs that fall in DRIP-seq peaks (blue) or RLFS (red). c, R-loop signal detected in genomic regions sorted by R-loop signal (including elements from non-B-DB and repeatmasker). R-loop signal was determined for 10000 randomly selected elements for every type of genomic feature (n=21). Violin plots depict kernel density estimates and represent the density distribution d, Genome-wide association of breakpoints with genomic regions sorted by R-loop signal shown in c. Genome-wide associations were calculated as distance to nearest element compared to a set of 10000 randomly generated breakpoints. Enrichments were calculated for EWS breakpoints and breakpoints from other entities (reference set). P-values were calculated using a two-sided Mann-Whitney U test and adjusted for multiple testing (BH). e, Density of distances between genomic regions and breakpoints detected in ETMR, EWS, random breakpoints and reference breakpoints. f, Total percentage of breakpoints within 1kb of genomic regions. g, Enrichment of SNVs (n=85534) in ETMR R-loops (n=16002 regions) and RLFS (n=85534 regions) compared to random regions of the same size. P-values were calculated using a two-sided Chi-square test (*** P<0.0005, ** P<0.005, * P<0.05, NS= not significant). h, Genome-wide distribution of mouse RLFS and breakpoints occurring in DICER1 KO cells compared to WT. The outer rim shows the genome wide density of mouse RLFS, the inner rim the CNAs that were found between WT and KO and the inner part shows the SVs that were detected between WT and KO. Breakpoints falling within RLFS are highlighted in red. i, Copy number profiles of an example of a translocation coupled to duplication in RLFS which were found in DICER1 KO compared to DICER1 WT cells. Red arrows depict the location of translocation/duplication.
Figure 1.
Figure 1.. ETMRs regardless of C19MC amplification show high molecular similarity
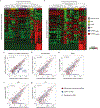
a-b, t-SNE clustering using either DNA methylation (a) or mRNA expression data (b). Colors represent different tumor entities classified as described previously. c, Violin plot showing log2 transformed expression of C19MC miRNAs (n=56) in ETMRs and other tissues. P-values were calculated using two-sided Mann-Whitney U tests (***= P<0.0005). Boxplots show the median ± interquartile range, whiskers extend to 1.5x the interquartile range, violin plots depict kernel density estimates and represent the density distribution.
Figure 2.
Figure 2.. ETMRs without C19MC amplification recurrently harbor miRNA related aberrations
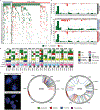
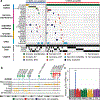
a, Oncoplot showing somatic events occurring in ETMRs. b, Overview of identified DICER1 mutations. Alternating blue colors represent exons, yellow bars represent domains and pins represent the different aberrations found. c, Quantification of miRNA processing using the median ratio between 3p and 5p miRNAs (n=375), each bar representing one tumor. P-values were calculated using a one-sided Mann-Whitney U test (*** P<0.0005).
Figure 3.
Figure 3.. Primary/relapse comparison reveals poor conservation of SNVs but high conservation of SVs
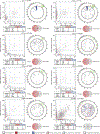
a, Graph depicting allele frequencies of combined SNVs found between four primary tumors and matched initial relapses. Boxes represent SNVs that are gained, conserved and lost upon relapse. b, Analysis of mutational signatures of primary and relapsed tumors based on previously defined mutational signatures,. c, Radial plot depicting log2 fold changes of the somatic SNV burden between primary tumor (PRIM) and subsequent relapses (REC1 and REC2) colored by exposures shown in b. Number of mutations in primary tumor was set to 1 for visualization purposes. d, Venn diagram showing the overlap of breakpoints between a primary tumor and matched relapses. e, Circular representation of the genome of SVs and CNAs in a primary tumor with two matched recurrences shown in d. The outer rim represents, from outer to inner, the CNAs found in the primary tumor, the first recurrence and second recurrence. The middle part represents the different SVs found between primary tumors and recurrences. Chromosome 19 and X have been enlarged.
Figure 4.
Figure 4.. Breakpoint context reveals a possible role for R-loops in initiating ETMRs
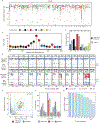
a,Schematic representation of GO-term enrichment. Circles represent GO-terms, sizes enrichment and colors groups based on similarity scores (Co-occurrence Association Score >0.05) (Supplementary Table 3). b, Enrichment in DRIP signal around C19MC (fold enrichment over input). c, Density of ETMR breakpoints (n=2301) overlapping DRIP-peaks (left; n=16002) and RLFS (right; n=85534) compared to random regions of the same size. P-values were calculated using a two-sided Chi-square test (***= P<0.0005). d, Enrichment of breakpoints overlapping RLFS compared to 10000 randomly generated sets of regions of the same size for ETMRs and other entities. Boxes show the range (median, first and third quartile) of BH adjusted P-values calculated using one-sided Fisher’s exact tests, whiskers extend to upper and lower limits of the data (90% and 10% respectively). e, Immunohistochemistry pictures of full slides (left) and magnifications (right) for ETMRs (n=5) and a representative case of WNT (n=5) and Group4 MB (n=5). f, Immunohistochemistry of WT and DCR-KO cell lines stained for DAPI (blue), S9.6 (red) and y-H2AX (green). g, Quantification of signals shown in f, in mean signal per cell (n=255 WT cells, n=227 DCR-KO cells), normalized to DAPI signal. P-values were calculated using a two-sided Mann-Whitney U test (***= P<0.0005). Boxes show median, first and third quartile and whiskers extending to 1.5x the interquartile range. h, Dot blot of DNA-RNA hybrids extracted from WT and DCR-KO cells, ssDNA was used as loading control.
Figure 5.
Figure 5.. ETMR cells are sensitive to combination therapy with PARP and TOP1 inhibitors
a, Dose response curves of ETMR cells treated with either Pamiparib or Veliparib, Topotecan and a combination of both drugs, P-values were calculated using two-way ANOVA. Error bars denote mean ± s.e.m. b, Calculation of synergy using the Chou-Talay method of drug treatments shown in a. c, Immunohistochemistry of ETMR cells stained for y-H2AX and S9.6. Cells were treated using IC50 concentrations of every drug or combination. d, Quantification of signal shown in c, in mean signal per cell (n=59 DMSO treated, n=158 Pamiparib treated, n=88 Topotecan treated, n=20 Combination treated cells), normalized by the total DAPI signal in the cell. P-values were calculated using two-sided Mann Whitney U tests (***= P<0.0005).
Figure 6.
Figure 6.. Hallmarks of ETMR
Schematic summary of ETMR characteristics

References

    1. Korshunov A et al. Embryonal tumor with abundant neuropil and true rosettes (ETANTR), ependymoblastoma, and medulloepithelioma share molecular similarity and comprise a single clinicopathological entity. Acta Neuropathol 128, 279–289, doi:10.1007/s00401-013-1228-0 (2014). - DOI - PMC - PubMed
    1. Eberhart CG, Brat DJ, Cohen KJ & Burger PC Pediatric neuroblastic brain tumors containing abundant neuropil and true rosettes. Pediatr Dev Pathol 3, 346–352 (2000). - PubMed
    1. Pfister S et al. Novel genomic amplification targeting the microRNA cluster at 19q13.42 in a pediatric embryonal tumor with abundant neuropil and true rosettes. Acta Neuropathol 117, 457–464, doi:10.1007/s00401-008-0467-y (2009). - DOI - PubMed
    1. Li M et al. Frequent amplification of a chr19q13.41 microRNA polycistron in aggressive primitive neuroectodermal brain tumors. Cancer Cell 16, 533–546, doi:10.1016/j.ccr.2009.10.025 (2009). - DOI - PMC - PubMed
    1. Kleinman CL et al. Fusion of TTYH1 with the C19MC microRNA cluster drives expression of a brain-specific DNMT3B isoform in the embryonal brain tumor ETMR. Nat Genet 46, 39–44, doi:10.1038/ng.2849 (2014). - DOI - PubMed

Publication types

MeSH terms