. 2020 Jan;577(7788):127-132.
doi: 10.1038/s41586-019-1808-9. Epub 2019 Dec 4.

Regulation of α-synuclein by chaperones in mammalian cells

Affiliations

Regulation of α-synuclein by chaperones in mammalian cells

Björn M Burmann et al. Nature. 2020 Jan.

Abstract

Neurodegeneration in patients with Parkinson's disease is correlated with the occurrence of Lewy bodies-intracellular inclusions that contain aggregates of the intrinsically disordered protein α-synuclein1. The aggregation propensity of α-synuclein in cells is modulated by specific factors that include post-translational modifications2,3, Abelson-kinase-mediated phosphorylation4,5 and interactions with intracellular machineries such as molecular chaperones, although the underlying mechanisms are unclear6-8. Here we systematically characterize the interaction of molecular chaperones with α-synuclein in vitro as well as in cells at the atomic level. We find that six highly divergent molecular chaperones commonly recognize a canonical motif in α-synuclein, consisting of the N terminus and a segment around Tyr39, and hinder the aggregation of α-synuclein. NMR experiments9 in cells show that the same transient interaction pattern is preserved inside living mammalian cells. Specific inhibition of the interactions between α-synuclein and the chaperone HSC70 and members of the HSP90 family, including HSP90β, results in transient membrane binding and triggers a remarkable re-localization of α-synuclein to the mitochondria and concomitant formation of aggregates. Phosphorylation of α-synuclein at Tyr39 directly impairs the interaction of α-synuclein with chaperones, thus providing a functional explanation for the role of Abelson kinase in Parkinson's disease. Our results establish a master regulatory mechanism of α-synuclein function and aggregation in mammalian cells, extending the functional repertoire of molecular chaperones and highlighting new perspectives for therapeutic interventions for Parkinson's disease.


Conflict of interest statement

The authors declare no competing financial interests.

Figures
Extended Data Figure 1
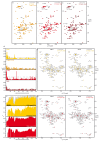
Extended Data Figure 1. Interaction between α-Synuclein and bacterial chaperones.
a–c, Overlay of 2D [15N,1H]-NMR spectra of 250 μM [U-15N]–α-Synuclein in the absence (grey) and presence of 500 μM chaperones, as indicated. The sequence-specific assignments for significantly affected resonances are indicated. d, Residue-resolved chemical shift perturbations of α-Synuclein caused by the addition of two equivalents of either SecB-tetramer (yellow), Trigger Factor dimer (orange), Skp trimer (red), and SurA dimer (dark red). Broken lines indicate a significance level of two standard deviations of the mean. e, Temperature-dependence of the α-Synuclein interaction with either SecB (yellow) or Skp (red) monitored by residue-resolved intensity ratios (Irel = I/I0) of 13C-direct detected 2D [15N,13C]–NMR spectra. The intensity ratios of 2D [15N, 1H]–NMR spectra at 281 K (Fig. 1c) are shown as an outline (grey). f, g, Overlay of 2D [13C,15N]-NMR spectra of 500 μM [U-13C, 15N]–α-Synuclein in the absence (grey) and presence of 1mM of SecB-tetramer ((f), yellow) or 1mM of Skp-trimer ((g), red). Experiments were performed at 281 K and 310 K as indicated. The sequence-specific resonance assignment is shown. Experiments in panels a–c and f–g were done in duplicates yielding similar results.
Extended Data Figure 2
Extended Data Figure 2. Chaperones Skp and Trigger Factor bind α-Synuclein at their native client sites.
a, Overlay of 2D [15N,1H]-NMR spectra of 250 μM [U-2H,15N]–Skp in the absence (grey) and presence of 750 μM α-Synuclein (red). b, Residue-resolved NMR signal intensity ratios (Irel = I/I0) of Skp (250 μM) in the presence of three equivalents of α-Synuclein measured at 310K. The thin broken lines indicate a significance level of one standard deviation to the mean. The thick broken line represents an intensity ratio of 1. c, α-Synuclein induced intensity changes plotted on the Skp crystal structure (PDB 1SG2) and earlier reported effects upon binding of its native client OmpX . Signal decrease of more than one standard deviation is highlighted in blue, whereas signal increase is highlighted in red. d, Overlay of 2D [15N,1H]-NMR spectra of 250 μM [U-2H,15N]–Skp in the absence (grey) and presence of 500 μM BSA (blue). e, Residue-resolved NMR signal intensity ratios (Irel = I/I0) of Skp (250 μM) in the presence of two equivalents of BSA measured at 310K. The thick broken line represents an intensity ratio of 1. f, Overlay of 2D [15N,1H]-NMR spectra of 250 μM [U-2H,15N]–TF(ΔRBD), a monomeric Trigger Factor variant lacking its ribosome binding and main dimerization domain, in the absence (grey) and presence of 750 μM α-Synuclein (orange). g, Residue-resolved NMR signal intensity ratios (Irel = I/I0) of 250 μM TF(ΔRBD) in the presence of three equivalents of α-Synuclein measured at 298K. The thin broken lines indicate a significance level of one standard deviation of the mean. The thick broken line represents an intensity quotient of 1. h, Residue-resolved combined chemical-shift differences of the amide moieties. The broken line indicates a significance level of two standard deviations of the mean. i, Significant chemical shift changes (green) and intensity decrease (blue) plotted on the Trigger Factor structure (PDB 1W26) . Comparison to the published Trigger Factor interaction-sites of PhoA (orange) . j, Overlay of 2D [15N,1H]-NMR spectra of 250 μM [U-2H,15N]–TF(ΔRBD) in the absence (grey) and presence of 500 μM BSA (blue). k, Residue-resolved NMR signal intensity ratios (Irel = I/I0) of TF(ΔRBD) (250 μM) in the presence of two equivalents of BSA measured at 298 K. The thick broken line represents an intensity ratio of 1. Experiments with α-Synuclein (panels a and f) were done as duplicates yielding similar results, whereas control experiments with BSA (panels d and j) were performed once.
Extended Data Figure 3
Extended Data Figure 3. Interaction between α-Synuclein and mammalian proteins.
a, Overlay of 2D [15N,1H]-NMR spectra of 25 μM [U-15N]–α-Synuclein in the absence (grey) and presence of 50 μM inhibited Hsp90β-dimer (light blue). Measured in NMR-buffer plus 5 mM MgCl2, 5 mM ATP, 1 μM Radicicol, and 1 μM Geldanamycin. b, Overlay of 2D [15N,1H]-NMR spectra of 100 μM [U-15N]–α-Synuclein in the absence (grey) and presence of 200 μM Hsc70 (light blue). c, Overlay of 2D [15N,1H]-NMR spectra of 100 μM [U-15N]–α-Synuclein in the absence (grey) and presence of 200 μM Hsc70ADP (light blue). Measured in NMR-buffer plus 5 mM MgCl2 and 5 mM ADP. d, Overlay of 2D [15N,1H]-NMR spectra of 100 μM [U-15N]–α-Synuclein in the absence (grey) and presence of 200 μM Hsc70ATP (light blue). Measured in NMR-buffer plus 5 mM MgCl2 and 5 mM ATP. e, Overlay of 2D [15N,1H]-NMR spectra of 250 μM [U-15N]–α-Synuclein in the absence (grey) and presence of 500 μM (33 mg/ml) BSA (blue). f, Overlay of 2D [15N,1H]-NMR spectra of 250 μM [U-15N]–α-Synuclein in the absence (grey) and presence of 500 μM of Ubiquitin (dark-blue). g, Residue-resolved combined chemical-shift perturbations of amide moieties upon addition of Hsp90β (cyan), inhibited Hsp90β (light cyan), Hsc70 (light-blue), Hsc70ADP (light-blue), Hsc70ATP (light-blue), BSA (blue), and Ubiquitin (dark blue). Broken lines indicate a significance level of two standard deviations of the mean. h, Residue-resolved backbone amide NMR signal attenuation (Irel = I/I0) of α-Synuclein caused by the addition of two equivalents of inhibited Hsp90β (light cyan), Hsc70 (light blue), Hsc70ATP (light blue), and BSA (blue). i, Residue-resolved NMR signal attenuation (Irel = I/I0) of 100 μM [U-15N]–α-Synuclein upon addition of increasing BSA concentrations (50–250 mg/ml). j, Residue-resolved NMR signal attenuation (Irel = I/I0) of 50 μM [U-15N]–α-Synuclein upon addition of increasing Ubiquitin concentrations (25–125 mg/ml). k, Local hydrophobicity of α-Synuclein plotted against the amino acid sequence. ΔF are the free energies of transfer of the individual amino acids from an aqueous solution to its surface . Hydrophobicity corresponds to negative ΔF values. An exponentially weighted 7-window average was applied to the raw data, with the edges contributing 50%. The red line indicates the average value of 1.5 standard deviations of the mean, the chosen threshold for the identification of the most hydrophilic segments. l, Sequence-dependent DnaK score for α-Synuclein derived from a computational DnaK prediction algorithm . Regions of the primary sequence with scores less than -5 (red line) are predicted to bind DnaK, a bacterial homolog of Hsc70. Experiments in panels a–f were done in duplicates with similar results.
Extended Data Figure 4
Extended Data Figure 4. Kinetic analysis of the interaction of the chaperones with α-Synuclein variants.
a–c, Kinetic analysis by BLI of biotinylated Skp (a), SecB (b), and Hsc70ADP (c) to different α-Synuclein-variants (α-Synuclein (top), acetyl–α-Synuclein (middle), and ΔN–α-Synuclein (bottom). Black lines represent least-square fits to the data. Below each set of BLI-curves the residuals of the fits are shown. Each individual kinetic experiment was run twice in triplicates with similar results.
Extended Data Figure 5
Extended Data Figure 5. Interaction between α-Synuclein and cellular extracts.
a, Overlay of 2D [15N,1H]-NMR spectra of 50 μM [U-15N]–α-Synuclein in the absence (black) and presence of 25 mg/ml μM of E. coli cell extract (green). b, Overlay of 2D [15N,1H]-NMR spectra of 50 μM [U-15N]–α-Synuclein in the absence (black) and presence of 50 mg/ml mammalian MDCK-II cell extract (blue-green). c, Overlay of 2D [15N,1H]-NMR spectra of 50 μM [U-15N]–α-Synuclein in the absence (black) and presence of 50 mg/ml mammalian HEK-293 cell extract (green). d, Residue-resolved combined chemical-shift perturbations of the α-Synuclein amide moieties in E. coli cell extract (green), mammalian MDCK-II cell extract (blue), and mammalian HEK-293 cell extract (green), all relative to aqueous buffer. Broken lines indicate a significance level of two standard deviations of the mean. Experiments in panels a–c were done in duplicates with similar results.
Extended Data Figure 6
Extended Data Figure 6. LUVs and the chaperone SecB compete for α-Synuclein binding.
a, Residue-resolved backbone amide NMR signal attenuation (Irel = I/I0) of α-Synuclein caused by the addition of 5 mg/ml LUVs (125:1 molar ratio lipid:protein; dark yellow) and after further addition of two equivalents of SecB (yellow). b, Residue-resolved backbone amide NMR signal attenuation (Irel = I/I0) of α-Synuclein caused by the addition of 15 mg/ml LUVs (375:1 molar ratio lipid:protein; dark yellow) and after further addition of two and six equivalents of SecB, respectively (yellow), measured at 298 K. c, Residue-resolved backbone amide NMR signal attenuation (Irel = I/I0) of α-Synuclein caused by the addition of 2 equivalents of SecB (yellow) and increasing amounts of LUVs with the following ratios: 2.5 mg/ml = 62.5:1, 4.0 mg/ml = 100:1, 6.25 mg/ml = 156:1, and 8.5 mg/ml = 212.5:1. d, Scheme showing the conformational equilibrium of free α-Synuclein, its chaperone-bound state, and one possible conformation of its LUV-bound state (PDB ID: 1XQ8) . Notably, these observations are also in full agreement with related studies for Hsp90 and Hsp27 . e, Dynamic light scattering (DLS) measurements of LUVs prepared from pig brain polar lipids. Two independent preparations are shown in blue and orange, respectively, with an average diameter of 110 nm.
Extended Data Figure 7
Extended Data Figure 7. In-cell interaction of α-Synuclein and chaperones.
a, Western blot analysis of expression of α-Synuclein fused to a carboxy-terminal HA-tag in HEK-293 cells. The molecular weight marker and the band corresponding to α-Synuclein-HA are indicated. With these samples immunoprecipitation and subsequent mass-spectrometric analysis was performed (Fig. 2a; Extended Data Fig. S7b). b, Intensity ratios of carboxy-terminally HA-tagged ΔN–α-Synuclein and α-Synuclein immune-precipitation determined by relative quantitative mass-spectrometry analysis. Experiments were performed as duplicates in HEK-293 cells. Identification of at least five peptides per protein was required for quantification. Values: Mean. The dotted line represents an intensity ratio of 1. Proteins belonging to specific groups are highlighted in colors. Further, the values for α-Synuclein (green) as well as Tubulin β4 and Tubulin α1B (orange arrows from left to right) are indicated by colored arrows. c, Efficiency of Hsc70 knockdown in HEK-293 cells (constitutively expressing the T-Rex repressor) stably transfected with an inducible shRNA targeting Hsc70 mRNA (shHsc70). The image shows a representative semi-quantitative RT-PCR of Hsc70 mRNA in cells treated with doxycycline to induce shHsc70 and Geldanamycin (Gel) and Radicicol (Rad) for 24 hours (+). Cells transfected with a control shRNA targeting firefly luciferase (shLUC) as well as semi-quantification of an unrelated chaperone (Hsp40) were included as negative controls. d, Semi-quantification of Hsc70 and Hsp90 protein levels by Western blot. HEK-293 cells (constitutively expressing the T-Rex repressor) stably transfected with shHsc70 and shLUC were grown in normal (-) or doxycycline containing (+) medium for Hsc70 knockdown. The cells were subsequently treated with vehicle (-) or Geldanamycin and Radicicol (Gel & Rad) for Hsp90 inhibition. The constitutively expressed protein GAPDH was assayed as loading control. e, Efficiency of the combined treatment of Geldanamycin and Radicicol in disrupting the α-Synuclein/Hsp90 interaction. HEK-293 cells were treated with Geldanamycin and Radicicol for 4 or 24 hours and then electroporated with recombinant α-Synuclein using the protocol for in-cell NMR experiments. Whole cell lysates were collected and used in immunoprecipitation assays with anti-α-Synuclein antibodies. The obtained precipitates were then resolved in SDS-PAGE and analyzed by Western blot using the indicated antibodies. In addition to HEK-293 cells with normal levels of Hsp90 (control cells), cells with reduced levels of Hsp90 (shHsp90) were used to validate the Hsp90 band. f, Inhibition of both Hsp90 and Hsc70 promotes α-Synuclein aggregation. The image shows a representative semi-quantitative Western blot of Hsc70-depleted HEK-293 cells treated with Geldanamycin and Radicicol. After 24 hours of treatment the cells were subjected to electroporation with recombinant α-Synuclein and 4 hours post electroporation the cells were harvested and subjected to Western blot. HMW and 14 kDa refer to high-molecular weight and monomeric α-Synuclein-species, respectively. g, h, Quantification of intracellular levels of Hsp90 and electroporated α-Synuclein in HEK-293 cells by Parallel Reaction Monitoring mass spectrometry (PRM). A standard curve (contained in the yellow boxes) using increasing amounts of recombinant Hsp90 (g) or α-Synuclein (h) serves for relative quantification of the intracellular protein levels. As surrogates for intracellular protein levels, at least four tryptic peptides of Hsp90 (g) or human α-Synuclein (h) were quantified. Targeted peptides are shown in the top of each plot, and at least four transitions of the y-series of the product ions were monitored over the chromatographic separation of the peptides (different colors). The determined cellular concentrations of Hsp90 and α-Synuclein were 30 μM and 2.5 μM, respectively (see Supplementary Methods section for details of this calculation). cps; counts per second. The original and uncropped gels of panels a as well as c–f can be found in Supplementary Figure 1. Western Blot and PCR experiments (panels a, c–f) were done in duplicates resulting in similar results.
Extended Data Figure 8
Extended Data Figure 8. Sequence-specific NMR-resonance assignments of α-Synuclein variants.
a–c, 2D [15N,1H]-NMR spectra of 500 μM [U-13C,15N]–α-Synuclein (grey), 450 μM [U-13C,15N]–acetyl–α-Synuclein (dark-violet), and 100 μM [U-15N]–ΔN–α-Synuclein (dark blue). The sequence-specific resonance assignments for wild-type as well as acetylated–α-Synuclein obtained from 3D triple resonance experiments and from chemical shift mapping for ΔN–α-Synuclein are indicated. d, e, 2D [13C,15N]-NMR spectra of 500 μM [U-13C,15N]–α-Synuclein (grey) and 450 μM [U-13C,15N]–acetyl–α-Synuclein (dark-violet). The sequence-specific resonance assignments for wild-type and acetylated–α-Synuclein obtained from 3D triple resonance experiments are indicated. f, Residue-resolved combined chemical-shift perturbations of the amide moieties for acetyl–α-Synuclein (dark violet) and ΔN–α-Synuclein (dark blue) vs. wild-type α-Synuclein. g, Residue-resolved combined chemical-shift difference of the carbonyl-amide moieties for acetyl–α-Synuclein (dark violet) vs. wild-type α-Synuclein. [15N,1H]-NMR spectra in panels a–c were measured several times (n=5), and [13C,15N]-NMR spectra (panels d, e) were measured in duplicates, all yielding similar results.
Extended Data Figure 9
Extended Data Figure 9. Sequence-specific NMR-resonance assignments of methionine-oxidized and tyrosine-phosphorylated α-Synuclein variants.
a–c, 2D [15N,1H]-NMR spectra of 100 μM [U-15N]–oxidized–α-Synuclein (light grey), 100 μM [U-15N]–oxidized-acetyl–α-Synuclein (violet), and 100 μM [U-15N]–oxidized-ΔN–α-Synuclein (blue). The sequence-specific resonance assignments from chemical shift mapping and published assignments of the oxidized state are indicated. Oxidized methionines are highlighted in red. d, Residue-resolved combined chemical-shift differences of the amide moieties for oxidized–α-Synuclein (light grey), oxidized-acetyl–α-Synuclein (violet), and oxidized-ΔN–α-Synuclein (blue) relative to their respective reduced states. Colors as in panels a–c. Arrows indicate the positions of the oxidized methionines. e–g, 2D [15N,1H]-NMR spectra of 50 μM [U-15N]–mono-phospho–α-Synuclein (red-brown), 50 μM [U-15N]–tri-phospho–α-Synuclein (brown), and 50 μM [U-15N]–tetra-phospho–α-Synuclein (dark brown). The sequence-specific resonance assignments based on published assignments for phosphorylated α-Synuclein are indicated . Phosphorylated residues are highlighted in cyan. h, Residue-resolved combined chemical-shift differences of the amide moieties for the phosphorylated–α-Synuclein variants relative to wild-type α-Synuclein. Colors as in panels e–g. Arrows indicate the positions of the phosphorylated tyrosines. [15N,1H]-NMR spectra of the different modified α-Synuclein variants were measured several times (n=4) yielding similar results.
Extended Data Figure 10
Extended Data Figure 10. Mechanism of chaperone-controlled regulation of α-Synuclein function, conformation, and localization, in mammalian cells.
Cellular chaperones (yellow) interact with the amino-terminal segment of α-Synuclein (red), thus actively regulating its functional species by shifting conformational equilibria. Impairing the natural α-Synuclein–chaperone ratio or deteriorations of the α-Synuclein–chaperone interaction by post-translational modifications can consequently favor the formation of pathological species, including the association of α-Synuclein to mitochondria.
Figure 1
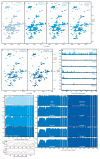
Figure 1. Molecular chaperones delay α-Synuclein aggregation by interaction with its amino-terminus.
a, b, ThT emission curves of 300 μM α-Synuclein in the presence of chaperones (15 μM in (a) and 30 μM in (b)). c, ThT emission curves of 100 μM α-Synuclein in the presence of 5 μM Hsp90β with and without addition of 1 μM of Drugs. In panels a-c, mean values are given with SD (n=3). d, Overlay of 2D [15N, 1H]-NMR spectra of 250 μM [U-15N]–α-Synuclein in the absence (grey) and presence of 500 μM of SecB-tetramer (yellow) (n=3, with similar results). e, Residue-resolved backbone amide NMR signal attenuation (Irel = I/I0) of α-Synuclein upon addition of two equivalents of either SecB tetramer (yellow), Trigger Factor dimer (orange), Skp trimer (red), and SurA dimer (dark red). f, Overlay of 2D [15N,1H]-NMR spectra of [U-15N]–α-Synuclein in the absence (grey) and presence of two equivalents Hsp90β-dimer (cyan) (n=2, with similar results). g, h, Residue-resolved backbone amide NMR signal attenuation (Irel = I/I0) of α-Synuclein upon addition of two equivalents of Hsp90β-dimer (cyan), Hsc70ADP (light-blue), and Ubiquitin (dark blue) as well as E. coli cell-extract (green), mammalian MDCK-II cell-extract (blue), and mammalian HEK-293 cell-extract (green). In panels e, g, and h, values < 1.0 are indicative of intermolecular interactions.
Figure 2
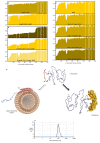
Figure 2. The interaction between α-Synuclein and chaperones is dominant in living cells.
a, Abundance ratios of proteins bound to ΔN–α-Synuclein vs. wild-type full-length α-Synuclein determined by relative quantitative mass-spectrometry (mean values, n=2). b, Overlay of 2D [15N,1H]-NMR spectra of [U-15N]–α-Synuclein in NMR-buffer (black) and inside living HEK-293 cells (blue-green). Representative spectrum from n>5. c, Residue-resolved backbone amide NMR signal attenuation (IHEK/IBuffer) of α-Synuclein in mammalian cells. d, In-cell NMR signal attenuation in differently treated cells, relative to untreated cells (I/IHEK). Different combinations of Hsc70-depletion and Hsp90β-inhibition were applied, as indicated. e, f, Overlay of 2D [15N,1H]-NMR spectra of [U-15N]–α-Synuclein in untreated HEK-293 cells (black) and in Hsc70-depleted HEK-293 cells (green)(e) or in Hsc70-depleted HEK-293 cells after 24 hours of Hsp90β-inhibition (green) (f). Representative data (d–f) for three technical replicates yielding similar results.
Figure 3
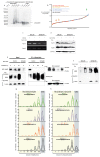
Figure 3. Co-localization of α-Synuclein and cellular organelles by immunofluorescence.
a–f, Immunofluorescence analysis of α-Synuclein electroporated into HEK-293 cells. Cells were either untreated (shLuc) or treated for a combined depletion of Hsc70 and Hsp90β (shHsc70 + Drugs). Cells were either stained with mitotracker (red; a) to stain mitochondria, or with WGA (red; b) to stain the plasma membrane and the endoplasmatic reticulum or lysotracker (red, c) to stain acidic vesicles such as lysosomes, DAPI (blue) to stain cell nuclei, and an α-Synuclein specific antibody (green). Dashed boxes indicate areas of intense signal for mitotracker and α-Synuclein. d, Cox IV (red, mitochondrial marker) and α-Synuclein (green) were visualized by specific antibodies, nuclei were stained by DAPI (blue). Dashed circles labeled a or a’ indicate cells with high α-Synuclein content, brackets labeled b or b’ indicate cells with low α-Synuclein content. e, f, Control HEK-293 cells (shLuc; e) or HEK-293 cells treated for the combined knock-down of Hsc70 and Hsp90β (shHsc70 + Drugs; f) were stably transfected with an expression plasmid containing the gene of mitochondria-targeted blue fluorescent protein (mtBFP). Cells were fixed and subjected to immunofluorescence analyses using an anti-α-Synuclein antibody. Propidium iodide (PI) was used to stain cells un-specifically allowing visualization of cell morphology. Note, the blue color originating from mtBFP was changed to green to better visualize mtBFP/α-Synuclein co-localization. Scale bar in all panels: 10 μm. Experiments were performed twice yielding similar results.
Figure 4
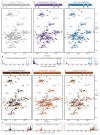
Figure 4. Effect of post-translational modifications on the chaperone–α-Synuclein interaction.
a, Cartoon representation of differently modified α-Synuclein variants as indicated. b, c, d, and e, Residue-resolved backbone amide NMR signal attenuation (ΔIrel = 1–I/I0) of the α-Synuclein variants upon interaction with two equivalents of Hsp90β dimer (b), Hsc70ADP (c), SecB tetramer (d) or Skp trimer (e). Elevated ΔIrel values are indicative of an interaction.

References

    1. Goedert M, Spillantini MG, Del Tredici K, Braak H. 100 years of Lewy pathology. Nat Rev Neurol. 2013;9:13–24. - PubMed
    1. Barnham KJ, Masters CL, Bush AI. Neurodegenerative diseases and oxidative stress. Nat Rev Drug Discov. 2004;3:205–214. - PubMed
    1. Lashuel HA, Overk CR, Oueslati A, Masliah E. The many faces of α-Synuclein: from structure and toxicity to therapeutic target. Nat Rev Neurosci. 2013;14:38–48. - PMC - PubMed
    1. Hantschel O, Superti-Furga G. Regulation of the c-Abl and Bcr-Abl tyrosine kinases. Nat Rev Mol Cell Biol. 2004;5:33–44. - PubMed
    1. Mahul-Mellier AL, et al. c-Abl phosphorylates α-Synuclein and regulates its degradation: implication for α-Synuclein clearance and contribution to the pathogenesis of Parkinson's disease. Hum Mol Genet. 2014;23:2858–2879. - PMC - PubMed

Publication types