. 2019 Dec;576(7786):293-300.
doi: 10.1038/s41586-019-1805-z. Epub 2019 Dec 4.

c-Jun overexpression in CAR T cells induces exhaustion resistance

Affiliations

c-Jun overexpression in CAR T cells induces exhaustion resistance

Rachel C Lynn et al. Nature. 2019 Dec.

Abstract

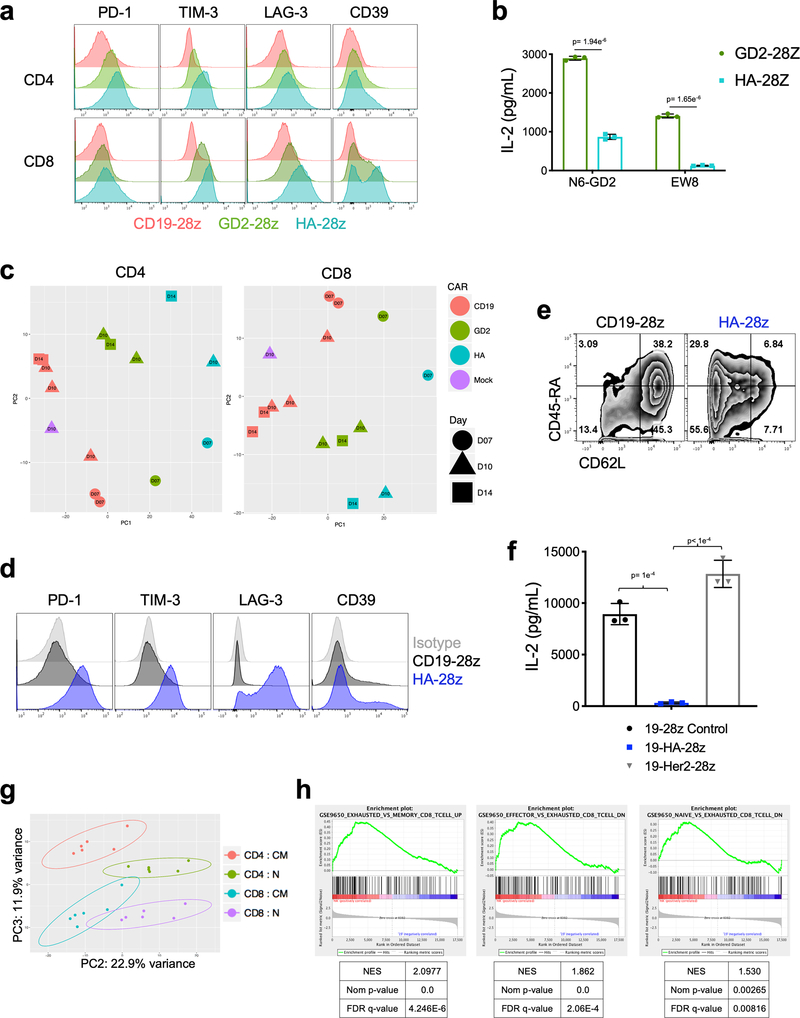
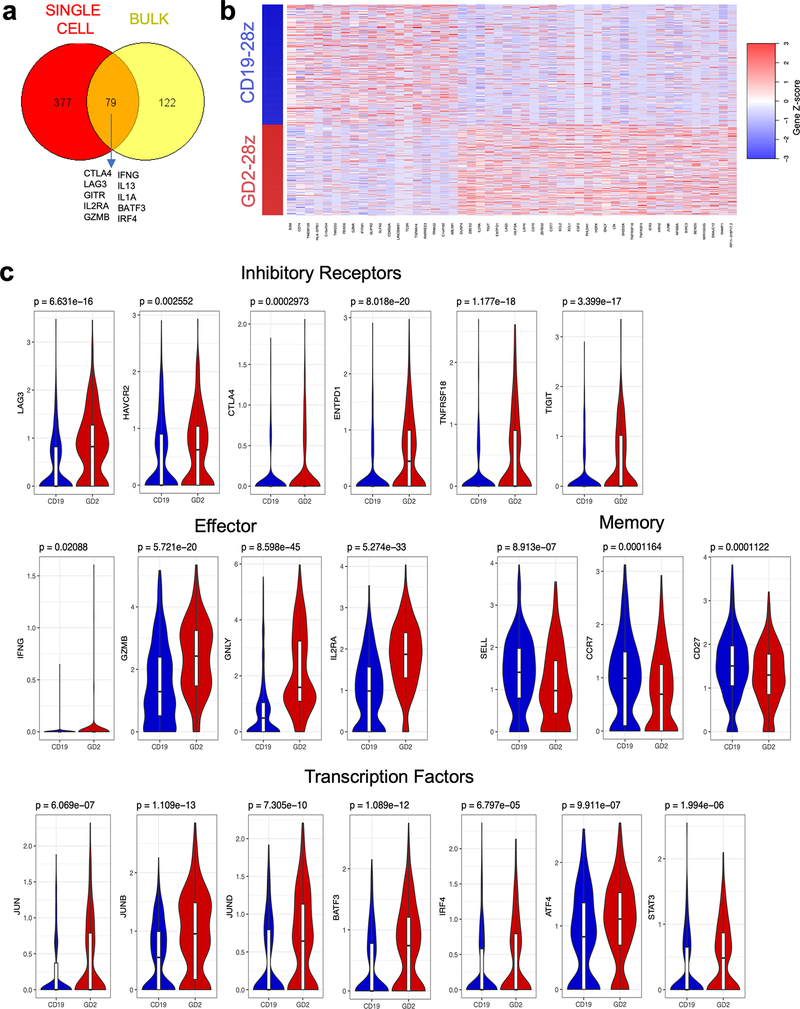
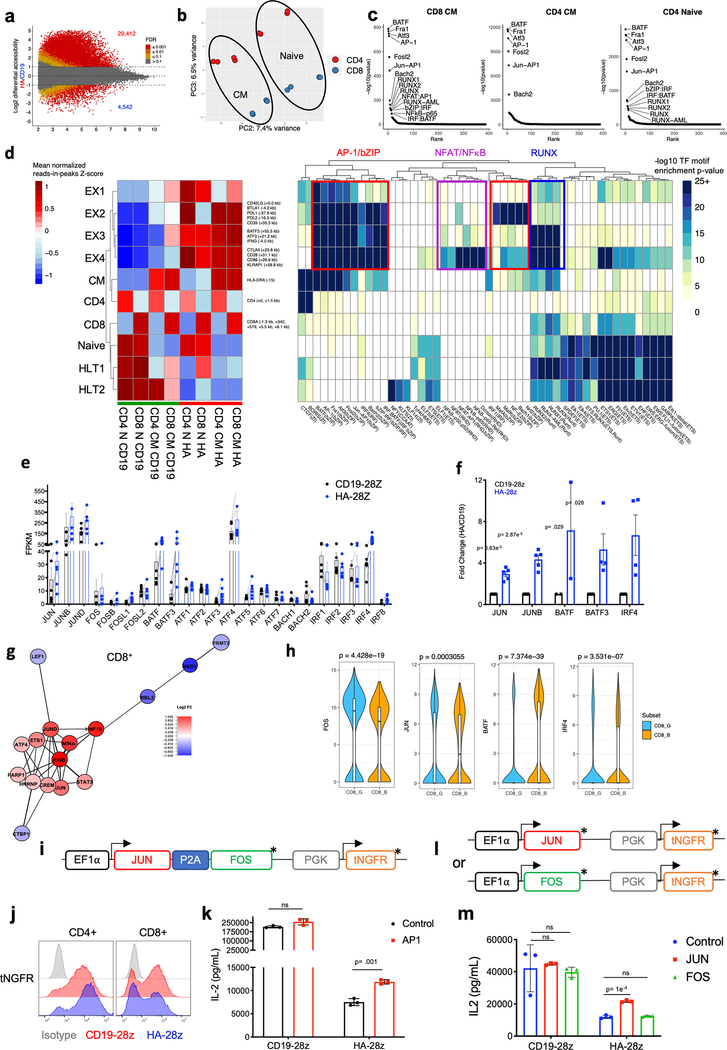
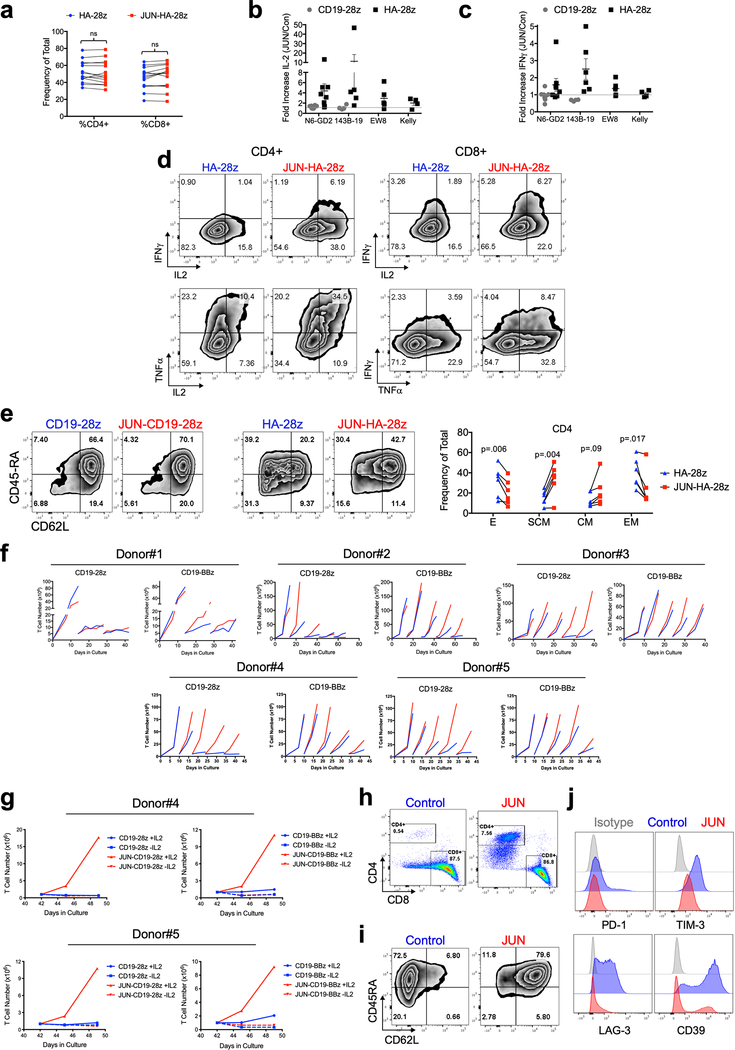
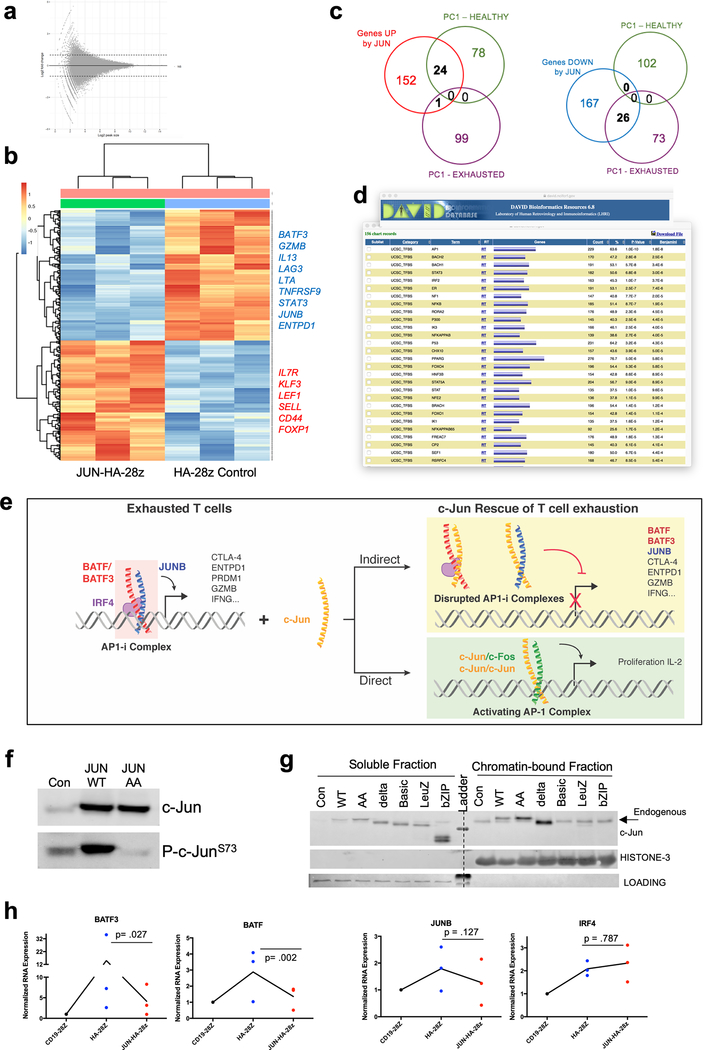
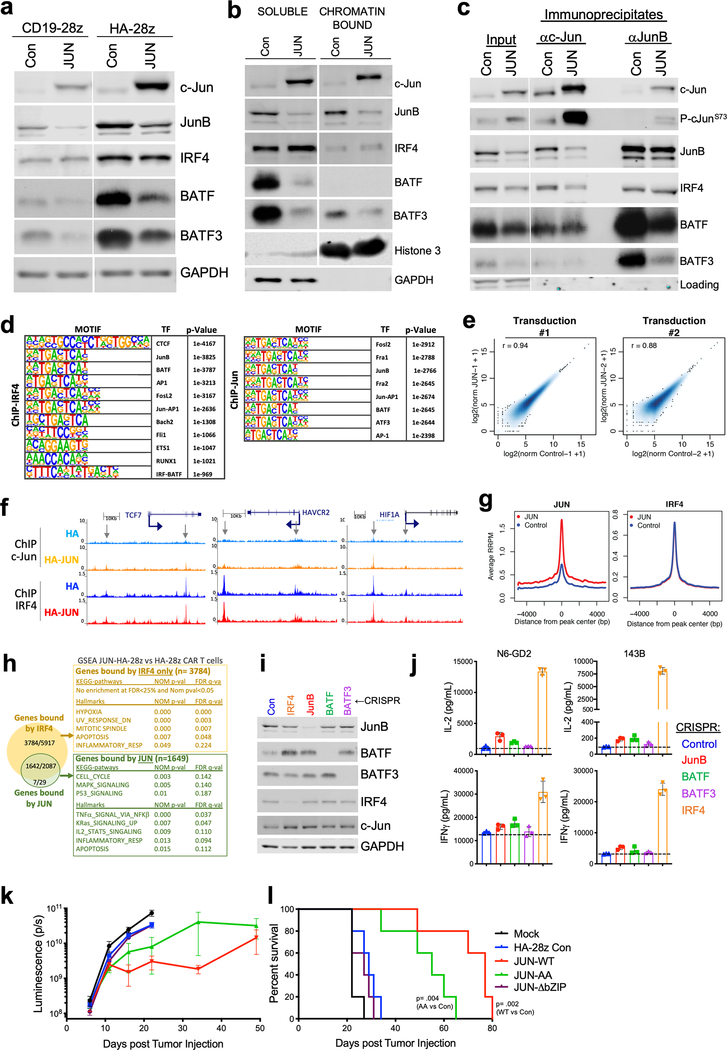
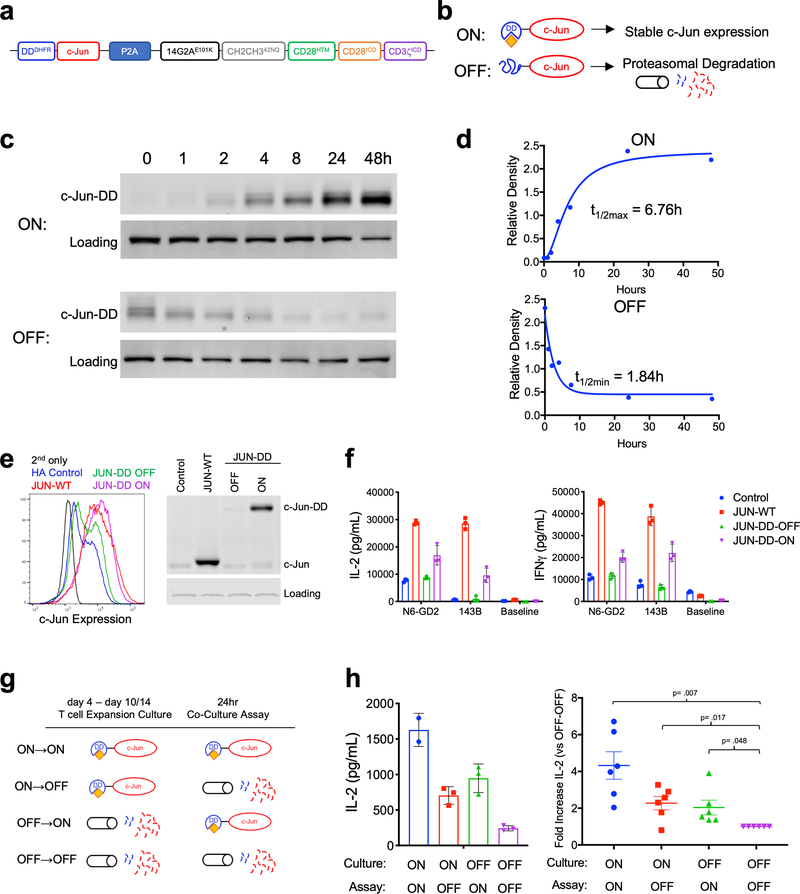
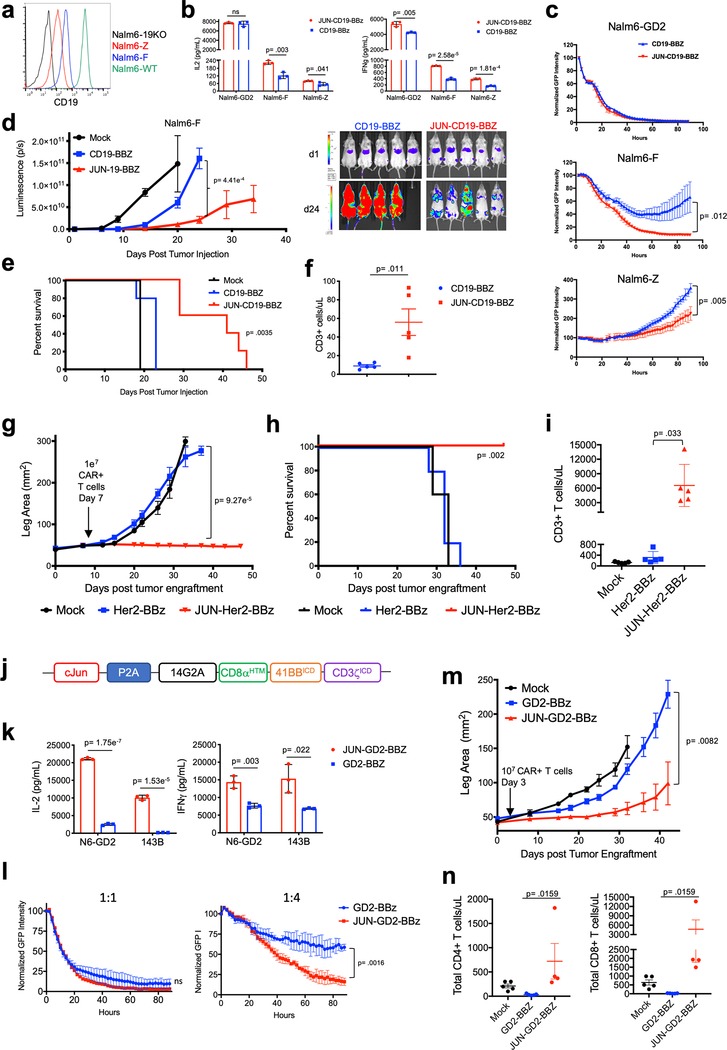
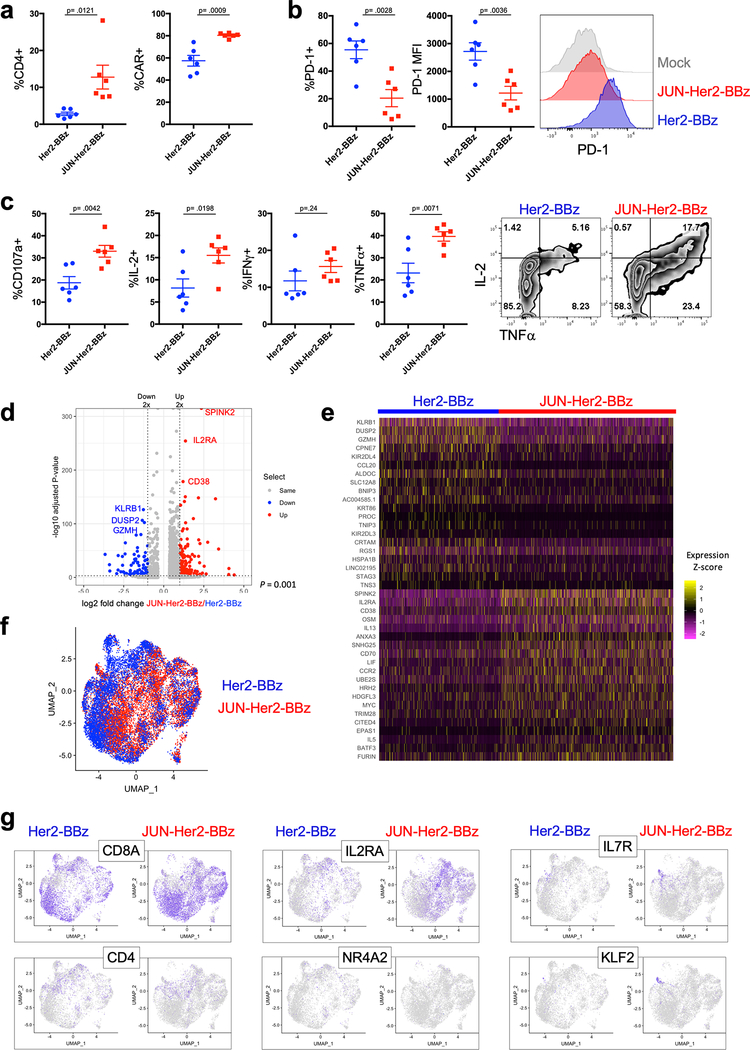
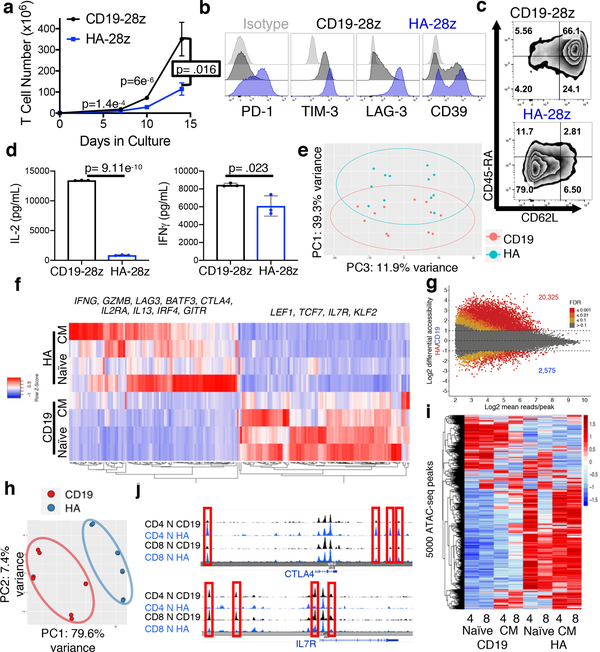
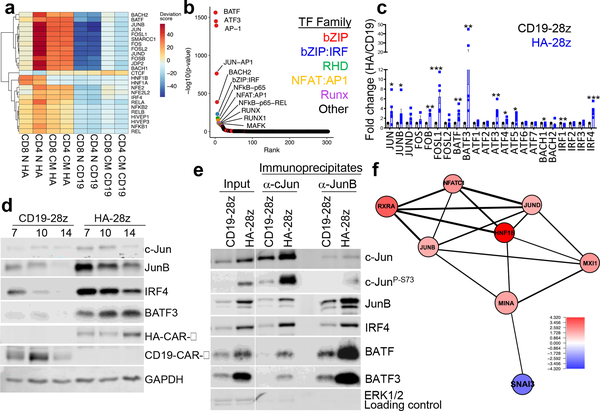
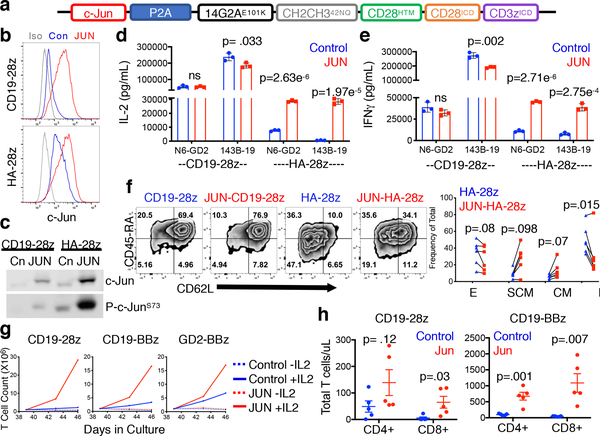
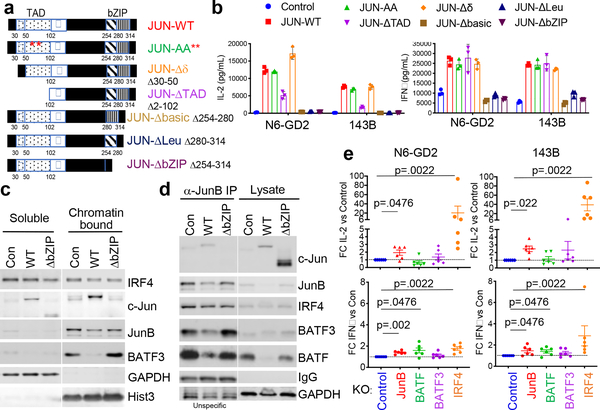
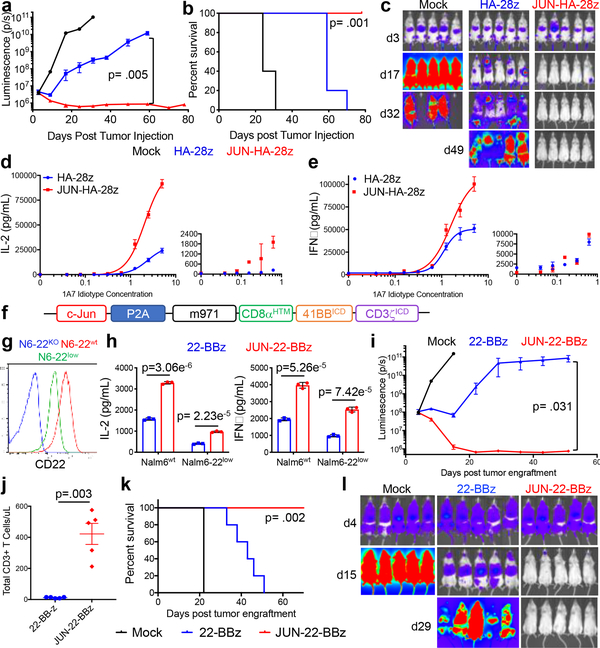
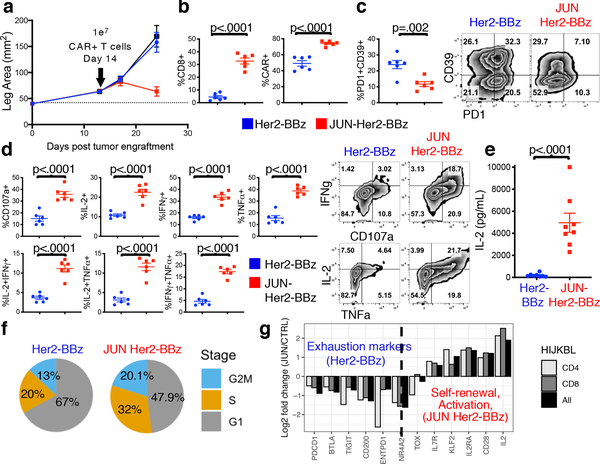
Chimeric antigen receptor (CAR) T cells mediate anti-tumour effects in a small subset of patients with cancer1-3, but dysfunction due to T cell exhaustion is an important barrier to progress4-6. To investigate the biology of exhaustion in human T cells expressing CAR receptors, we used a model system with a tonically signaling CAR, which induces hallmark features of exhaustion6. Exhaustion was associated with a profound defect in the production of IL-2, along with increased chromatin accessibility of AP-1 transcription factor motifs and overexpression of the bZIP and IRF transcription factors that have been implicated in mediating dysfunction in exhausted T cells7-10. Here we show that CAR T cells engineered to overexpress the canonical AP-1 factor c-Jun have enhanced expansion potential, increased functional capacity, diminished terminal differentiation and improved anti-tumour potency in five different mouse tumour models in vivo. We conclude that a functional deficiency in c-Jun mediates dysfunction in exhausted human T cells, and that engineering CAR T cells to overexpress c-Jun renders them resistant to exhaustion, thereby addressing a major barrier to progress for this emerging class of therapeutic agents.


Conflict of interest statement

COMPETING INTERESTS

C.L.M., R.C.L., E.W.W. and E.S. are inventors on a Stanford University Provisional patent pending on modulating AP-1 to enhance function of T cells; 62/599,299; C.L.M. is a founder of, holds equity in and receives consulting fees from Lyell Immunopharma, which has licensed the technology. R.C.L. is employed by and E.W.W. and E.S. are consultants for Lyell Immunopharma.

Figures

Extended Data Figure 1:
Extended Data Figure 1:. High Affinity (HA) 14g2a-GD2E101K CAR T cells manifest an exaggerated exhaustion signature compared to the original 14g2a-GD2 CAR.
a) Surface inhibitory receptor expression in CD19, GD2, and HA-GD2E101K CAR T cells at day 10 of culture. High affinity E101K mutation results in increased inhibitory receptor expression in CD4+ and CD8+ CAR T cells, compared to parental GD2 CAR. b) IL-2 secretion following 24h co-culture of HA-GD2E101K or original GD2–28z CAR T cells with GD2+ target cells. The increased exhaustion profile of HA-GD2E101K CAR T cells corresponds to decreased functional activity, as measured by the ability to produce IL-2 upon stimulation. Error bars represent mean ± SD of triplicate wells. Representative of 4 independent experiments with similar results. c) PCA of bulk RNA-seq demonstrates larger variance between HA-GD2E101K and CD19 CAR T cells, whereas GD2–28z(sh) CAR T cells are intermediary. Left – CD4+ T cells. Right – CD8+ CAR T cells, Naïve-derived. Number of replicates is indicated in plots. d-e) HA-GD2E101K CAR expression causes enhanced inhibitory receptor expression (d) and decreased memory formation (e) in CD4+ CAR T cells. (CD8+ data in Figure 1). f) IL-2 secretion from Control CD19–28z CAR T cells or CD19 CAR T cells with bi-cistronic expression of tonically signaling HA-GD2E101K (19-HA-28z, blue) or bi-cistronic expression of Her2–28z (19-Her2–28z, gray) following 24hr stimulation with Nalm6 (CD19+GD2Her2) target cells to demonstrate that co-expression of HA-GD2–28z CAR induces T cell dysfunction in CD19–28z CAR T cells. Error bars represent mean ± SD of triplicate wells. Representative of 3 independent experiments with similar results. g) RNA-seq PCA from Figure 1 showing PC2 separation is driven by CM vs N starting subset and PC3 separation driven by CD4 vs CD8. h) GSEA: gene sets upregulated in day 10 HA-28z CAR T cells vs CD19–28z CAR T cells showed significant overlap with genes upregulated in Exhausted vs Memory CD8+ (left), Exhausted vs Effector CD8+ (middle), and Exhausted vs Naïve CD8+ (right) in a mouse model of chronic viral infection (Wherry et al. Immunity, 2007). PCA – principle component analysis, NES – normalized enrichment score. In b and f, p-values were calculated using unpaired 2-tailed t-tests.
Extended Data Figure 2:
Extended Data Figure 2:. GD2–28z CAR T cells display an exhaustion signature at the single cell level.
a) Venn diagram showing overlapping genes in differential expression analysis of single cell data (red) and the top 200 genes driving the separation of CD19 and HA-28z CAR T cells in bulk RNA-seq (yellow, Figure 1f). 79 out of the top 200 genes from bulk RNA-seq are differentially expressed by DESeq2 analysis in GD2–28z vs CD19–28z single cells. Highlighted genes from the intersection include inhibitory receptors (CTLA4, LAG3, GITR, effector molecules CD25, IFNG, GZMB, and cytokines IL13 and IL1A and bZIP/IRF family transcription factors BATF3 and IRF4. b) Heatmap clustering the top 50 differentially expressed genes in GD2–28z vs CD19–28z single cell transcriptome analysis. Each row represents one cell. c) Violin plots depicting individual gene expression in CD8+ GD2–28z and CD19–28z single CAR T cells. Genes upregulated in GD2 CAR T cells include inhibitory receptors, effector molecules, and AP-1 family transcription factors, while CD19 CAR T cells have increased expression of memory-associated genes. P-values that are displayed for each gene above the individual plots were calculated using unpaired two-tailed Wilcoxon-Mann-Whitney U test.
Extended Data Figure 3:
Extended Data Figure 3:. ATAC-seq data quality control.
a) Insert length b) insert distance from transcriptional start site (TSS) for combined (top) and individual samples (below). c) Correlation between replicate samples. d) Location of mapped peaks in each sample by total number of peaks (upper) and frequency of total (lower).
Extended Data Figure 4:
Extended Data Figure 4:. AP-1 family transcription factors in HA-28z exhausted CAR T cells.
a) Differentially accessible chromatin regions in CD4+ CD19 and HA CAR T cells. Both Naive and CM-derived subsets are incorporated for each CAR. b) PCA from Figure 1h showing PC2 separation is driven by CM vs N and PC3 separation driven by CD4 vs CD8. c) Top transcription factor motifs enriched in chromatin regions differentially accessible in HA-28z CAR T cells comprise AP-1/bZIP family factors in all starting T cell subsets. CD8+ Naïve subset is shown in Figure 2. d) Peak clustering by shared regulatory motif (left) and enrichment heat map of transcription factor motifs (right) in each cluster. 10 different clusters including clusters associated with exhausted (EX1-EX4) or healthy (HLT1-HLT2) CAR T cells, CM (CM) or N (Naive) starting subset, and CD4 or CD8 T cell subset. Genes of interest in each cluster are highlighted to the right. (N – naïve, CM – central memory). e) Bulk RNA-seq expression (FPKM) of indicated AP-1(bZIP) and IRF family members in CD19 (black) and HA-28z (blue) CAR T cells. Error bars represent mean ± SEM from n=6 samples across 3 donors showing paired CD19 vs HA expression for each gene. p-values calculated using the Wilcoxon matched-pairs signed rank test. *p < .05, **p < .01, ***p < .001 (exact p values in Supplementary Statistical Tests). f) Increased protein expression of c-Jun, JunB, BATF3, and IRF4 in HA vs CD19 CAR T cells at day 10 of culture by immunoblotting. Fold-change densitometry HA/CD19. p-values were calculated using unpaired 2-tailed t-tests. n=2–5 experiments depending on the protein. g) Correlation network of exhaustion-related TFs in N-derived CD8+ GD2–28z CAR-T cells using single-cell RNA-seq analysis. h) Violin plots depicting single cell gene expression of FOS, JUN, BATF, and IRF4 in CD8+ clusters associated with response (CD8.G) and non-response (CD8.B) in metastatic melanoma patients post checkpoint therapy. (CD8T-Post-CD8G.B). P-values that are displayed for each gene above the individual plots were calculated using unpaired two-tailed Wilcoxon-Mann-Whitney U test. In h-l, AP1 modified HA-28z CAR T cells exhibit enhanced functional activity. i-k) CAR T cells were co-transduced with (AP1) or without (Control) a lentiviral vector encoding both AP-1 transcription factors Fos and c-Jun and a truncated NGFR (tNGFR) surface selection marker. i) Schematic of the lentiviral construct. j) Representative transduction efficiency of AP1 modified CAR T cells as measured by NGFR surface expression in indicated CD4+ and CD8+ CAR T cells. k) IL-2 production in control (black) or AP1-modified (red) CAR T cells following 24hr stimulation with 143B-CD19 target cells. AP1-modified HA-28z CAR T cells show increased IL-2 production compared to control CAR T cells. Error bars represent mean ± SD of triplicate wells. Representative of 2 independent experiments with similar results. l-m) CAR T cells were co-transduced with lentiviral vectors encoding either AP1 transcription factor c-Fos or c-Jun and a truncated NGFR (tNGFR) surface selection marker. l) Schematics of the c-Fos and c-Jun lentiviral constructs. m) IL-2 production in control (blue), Fos (green), or c-Jun (red) modified CAR T cells following 24hr stimulation with Nalm6-GD2 target cells. Error bars represent mean ± SD of triplicate wells. Representative experiment of 2 independent experiments with similar results. In i and l, * denotes a stop codon. ns, not significant p > .05. p-values were calculated using unpaired, two-tailed t-tests.
Extended Data Figure 5:
Extended Data Figure 5:. Enhanced activity of JUN-modified CAR T cells.
JUN-CAR T cells were produced as in Figure 3. a) c-Jun overexpression does not impact CD4:CD8 ratio in HA-28z CAR T cells at day 10 of culture. n=14 independent experiments. Lines indicate paired samples from the same donor. Paired, two-tailed t-tests were performed. b-c) Fold increase in IL-2 (b) and IFNγ (c) release following 24hr co-culture with the indicated target cells in JUN vs Control CD19 and HA-28z CAR T cells. Each dot represents one independent experiment from different donors of n=8 total experiments. d) Representative contour plots demonstrating increased intracellular cytokine production in both CD4+ and CD8+ JUN-HA-28z vs control HA-28z CAR T cells stimulated for 5hr with Nalm6-GD2 target cells. Representative of 3 independent experiments. e) Left: Flow cytometry showing representative CD45RA/CD62L expression in Control vs JUN-CAR CD4+ T cells (D10). Right: Relative frequency of Effector (CD45RA+CD62L), SCM (CD45RA+CD62L+), CM (CD45RACD62L+), and EM (CD45RA62L) in CD4+ Control or JUN-HA-28z CAR T cells. n=6 donors from independent experiments. Lines indicate paired samples from the same donor. Paired, two-tailed t-tests were performed. f) Extended in vitro expansion of control (blue) or JUN-modified (red) CD19 CAR T cells in 5 independent experiments with 5 different healthy donors. At the indicated time points, T cells were re-plated in fresh T cell media + 100 IU/mL IL-2. T cells were counted and fed to keep cells at 0.5×10⁶/mL every 2–3 days. For DONOR-1, 5×10⁶ viable T cells were re-plated on days 14 and 28. For DONOR-2, 5×10⁶ viable T cells were re-plated on days 14, 28, 42, and 56. For DONOR-3, 5×10⁶ viable T cells were re-plated on days 10, 17, 24, and 31. For DONOR-4&5, 5×10⁶ viable T cells were re-plated on days 10, 17, 24, and 34. g) On day 42 of culture, 1×10⁶ viable T cells from DONOR-4 (upper) and DONOR-5 (lower) were re-plated and cultured for 7 days with (solid lines) or without (dashed lines) IL-2. h-j) Cell surface phenotype of Control or JUN-CD19–28z CAR T cells from Fig. 3g, (Donor-3) on day 46 of culture. h) CD4 vs CD8 expression. i) Surface expression CD45RA vs CD62L. j) Day 46 surface exhaustion marker expression in CD8+ T cells.
Extended Data Figure 6:
Extended Data Figure 6:. c-Jun overexpression mediates transcriptional but not epigenetic reprogramming of exhausted HA-28z CAR T cells
a) Log2FC of HA vs JUN-HA ATAC-seq demonstrating no significantly different peaks between conditions. b) Gene expression of 319 genes differentially expressed in JUN vs HA-28z CAR T cells (log2FC > 2, padj < .05). Genes downregulated in JUN-CAR T cells (blue) include exhaustion associated genes like BATF3, GZMB, LAG3, JUNB, and ENTPD1 (encoding CD39). Genes upregulated in JUN-CAR T cells (red) include genes associated with naïve and memory differentiation like IL7R, LEF1, SELL (CD62L), CD44, and KLF3. c) Venn diagrams showing overlap of the 319 genes differentially expressed in JUN vs HA-28z and the top 200 genes distinguishing exhausted (HA) vs healthy (CD19) CAR T cells from PC1 in Figure 1e–f. Again, demonstrating genes downregulated in JUN-CAR T cells significantly overlap with exhaustion- associated (HA, PC1-EXHAUSTED) genes and genes upregulated in JUN-CAR T cells significantly overlap with genes associated with healthy memory differentiation (CD19, PC1-HEALTHY). d) DAVID bioinformatics analysis of transcription factor binding sites within the 319 genes differentially expressed in JUN-CAR T cells reveals the top TF binding motif belongs to AP-1 family (269/319 genes). e) Proposed mechanisms of c-Jun-mediated rescue of T cell exhaustion. AP1-i indicates an exhaustion-associated AP-1 complex. f) Immunoblot of total c-Jun and c-Jun-PSer73 in Control, JUN-WT, and JUN-AA HA-28z CAR T cells. g) Immunoblot analysis of c-Jun protein expression in Control and indicated JUN-variant-expressing HA-28z CAR T cells in either soluble or chromatin-bound cellular lysate fractions. c-Jun variants with deletions in the C-terminal DNA binding and leucine zipper dimerization domains (Basic, LeuZ, and bZIP) cannot bind chromatin and do not rescue functional activity. h) Decrease in mRNA expression of BATF, BATF3, and JUNB in JUN-HA-28z CAR T cells compared to HA-28z. n=3 donors, normalized to CD19 mRNA. P values were calculated using ratio paired two-tailed t test. See Supplementary Fig. 1 for gel source data.
Extended Data Figure 7:
Extended Data Figure 7:. c-Jun overexpression decreases chromatin binding and complexing of JunB/BATF/BATF3 AP-1 complexes.
a) Immunoblot analysis for the indicated AP-1/bZIP and IRF family member proteins in control and JUN CD19–28z and HA-28z CAR T cells (d10). b) Immunoblot analysis for the indicated AP-1/bZIP and IRF family member proteins in control and JUN-HA-28z CAR T cells (d10) in either soluble or chromatin-bound cellular lysate fractions. c) c-Jun overexpression decreases JunB/BATF and JunB/BATF3 complexes by IP-immunoblot analysis. Input (left columns), immunoprecipitation for c-Jun (middle columns), or JunB (right columns) in Control or JUN-HA-28z CAR T cells. IRF4 protein and complexing with c-Jun is unchanged. d-h) ChIP-Seq for c-Jun and IRF4. d) Motif enrichment in IRF4 (left) or c-Jun-bound (right) loci. e) IRF4 signal genome-wide. Data shown for each transduction at all IRF4-bound sites. X-axis shows log-transformed normalized count signal in Control cells and y-axis shows in JUN overexpression cells. f) IRF4 and c-Jun ChIP-seq genome tracks in JUN or Control HA-28z CAR-T cells. c-Jun ChIP-Rx (top) with x-axis representing genomic position and y-axis representing reference-adjusted reads per million (RRPM). IRF4 ChIP (bottom) with x-axis representing genomic position and y-axis representing reads per million (RPM). Arrows indicate peaks with increased c-Jun binding in HA-JUN cells at IRF4-bound sites within genes previously described to be regulated by IRF4/BATF (TCF7, HAVCR2, and HIF1A). g) Overexpressed c-Jun is bound to IRF4-occupied sites in the genome. Enrichment plot of c-Jun ChIP-Rx signal (left) or IRF4 ChIP-seq signal (right) in either JUN overexpression (red) or Control (blue) HA-28z CAR T cells at all JUN-bound sites. X-axis shows distance from center of JUN-bound site and y-axis shows average RRPM across replicates for c-Jun ChIP or average RPM across replicates for IRF4 ChIP. h) Venn diagram showing number of genes bound by IRF4 and/or c-Jun (N genes expressed/N genes bound). GSEA analysis with genes bound only by IRF4 (upper) and genes bound by c-Jun and IRF4 (lower) comparing levels of expression in JUN vs Control HA-28z CAR T cells (Nom p-value <0.05, FDR<25%) i) Immunoblot of indicated AP-1/IRF protein in Control or CRISPR-KO HA-28z CAR T cells demonstrating productive knockout of target protein. j) IL-2 (upper) and IFNγ (lower) release in HA-28z CAR T cells with Control or CRISPR-KO of the indicated AP-1/IRF4 gene following 24hr stimulation with Nalm6-GD2 or 143B target cells. Error bars represent mean ± SD of triplicate wells. Representative of n=6 independent experiments. Fold change across all experiments in Fig 4e. In k-l) NSG mice were inoculated with 1×10⁶ Nalm6-GD2 leukemia cells via IV injection. A stress test dose of 1×10⁶ Mock, HA-28z Con, JUN-WT, JUN-AA, or JUN-ΔbZIP HA-28z CAR+ T cells were given IV on d7. k) Tumor progression was monitored using bioluminescent imaging. l) JUN-WT and JUN-AA HA-28z CAR T cells enhanced long term survival, while Control and JUN-ΔbZIP HA-28z CAR T cells were almost non-functional compared to Mock untransduced T cells at this dose. Error bars represent mean ± SEM of n=5 mice/group. ns, not significant p > .05. For gel source data see Supplementary Fig. 1.
Extended Data Figure 8:
Extended Data Figure 8:. Functional rescue of exhausted HA-28z CAR T cells requires the presence of c-Jun during both chronic and acute T cell stimulation.
a) Schematic of the DD regulated JUN expression vector. b) Schematic of drug-induced stabilization of JUN-DD expression. Yellow diamond – TMP stabilizing molecule. c) Kinetics of drug-induced c-Jun stability in JUN-DD CAR T cells as assessed by immunoblot. At time 0, 10uM TMP was either added to untreated cells (ON) or washed out of previously treated cells (OFF). Cells were removed from each condition at 1, 2, 4, 8, 24, and 48hr and prepared for immunoblot analysis of c-Jun expression. The observed band corresponds to the size of JUN-DD. d) Densitometry analysis was performed on the blots from (c) and normalized to a loading control. Expression was plotted vs time and first order kinetics curves fit to the data to determine t1/2 for OFF and ON kinetics. e) Total c-Jun expression in control, JUN-WT, and JUN-DD HA-28z CAR T cells (d10) by intracellular flow cytometry (left) and immunoblot (right). f) IL-2 (left) and IFNγ (right) production in Control (blue), JUN-WT (red), or JUN-DD (OFF-green, ON-purple) modified HA-28z CAR T cells 24hr following stimulation with Nalm6-GD2 or 143B target cells, or media alone (baseline) (d10). In e-f) OFF indicates without TMP, ON indicates T cells cultured in the presence of 10uM TMP from d4 and during co-culture. In g-h) TMP was added either during T cell expansion (starting at d4) or only during co-culture with tumor cells as indicated in g. For ON→OFF and OFF→ON conditions, TMP was removed/added 18hr prior to co-culture to ensure complete c-Jun degradation/stabilization, respectively, prior to antigen exposure. h) IL-2 expression in one representative donor (left, SD across triplicate wells) and fold increase in IL-2 (SEM of n=6 independent experiments representing 3 different donors, relative to OFF-OFF condition). p-values were calculated using unpaired 2-tailed t-tests. DD – destabilization domain. TMP – trimethoprim. For gel source data see Supplementary Fig. 1.
Extended Data Figure 9:
Extended Data Figure 9:. c-Jun Overexpression enhances CD19-BBz CAR T cells activity under suboptimal antigen stimulation and Her2 or GD2-BBz CAR T cell function in solid tumors.
a) CD19 surface expression on parental Nalm6 (WT-green), Nalm6–19KO (black), Nalm6–19KO+CD19low-F (blue), and Nalm6–19KO+CD19 low-Z (red). b) IL-2 (left) and IFNγ (right) release following co-culture of control (blue) or JUN (red) CD19-BBz CAR T cells exposed to Nalm6-WT and Nalm6–19low clones F and Z. c) JUN vs Control CD19-BBz CAR T cell lysis of GFP+ Nalm6-WT (upper), Nalm6-F (middle) or Nalm6-Z (bottom) target cells at 1:2 E:T ratio demonstrating enhanced activity of JUN-CAR T cells at low antigen density. In b-c, error bars represent mean ± SD of triplicate wells. Representative of 4 independent experiments with similar results. In d-f), NSG mice were inoculated with 1×10⁶ Nalm6–19low Clone F leukemia cells. On day 1, 3×10⁶ Control or JUN-CD19-BBz CAR+ T cells or 3×10⁶ Mock transduced T cells were transferred IV. d) Tumor growth was monitored by bioluminescent imaging. e) JUN expression significantly improved long term survival of CAR treated mice. f) Mice receiving JUN-CD19-BBz CAR T cells display increased peripheral blood T cells on day 20. In d-f, error bars represent mean ± SEM of n=5 mice per group. Representative of 3 independent experiments with similar results. Long-term, tumor-free survival is impeded in this model due to outgrowth of CD19-negative disease. In g-i, NSG mice were inoculated with 1×10⁶ 143B osteosarcoma cells via intramuscular injection. 1×10⁷ Mock, Her2-BBz, or JUN-Her2-BBz CAR T cells were given IV on d7. g) Tumor growth was monitored by caliper measurements. h) Long-term survival. i) On d20 following tumor implantation, peripheral blood T cells were quantified in mice treated as in (g). Error bars represent mean ± SEM of n=5 mice/group. Representative of 2 independent experiments with similar results. j) Vector schematic of JUN-GD2-BBz retroviral vector construct. k) IL-2 (left) and IFNγ (right) production in JUN-modified (red) or control (blue) GD2-BBz CAR T cells following 24hr stimulation with Nalm6-GD2 or 143B target cells. l) GD2-BBz CAR T cell lysis of GFP+ Nalm6-GD2 target cells at 1:1 (left) or 1:4 (right) E:T ratio. In k-l, error bars represent mean ± SD of triplicate wells. Representative of 4 independent experiments with similar results. In m-n, NSG mice were inoculated with 0.5×10⁶ 143B-19 osteosarcoma cells via intramuscular injection. 1×10⁷ Mock, GD2-BBz, or JUN-GD2-BBz CAR T cells were given IV on day 3. m) Tumor growth was monitored by caliper measurements. n) Peripheral blood CD4+ (left) or CD8+ (right) T cell counts at day 14 post tumor engraftment. Error bars represent mean ± SEM of n=5 mice per group. In n, p-values were calculated with a Mann-Whitney test. Representative of 2 independent experiments although early deaths (unrelated to tumor size) precluded survival curves in both models. All other p-values were calculated using unpaired 2-tailed t-tests. Survival curves were compared using the log-rank Mantel-Cox test. HTM – hinge/transmembrane. ICD – intracellular domain.
Extended Data Figure 10.
Extended Data Figure 10.. c-Jun overexpressing CAR TILs demonstrate increased activity in osteosarcoma xenograft tumors.
Experimental design described in Figure 6. a-c) Frequency (a), phenotype (b), and ex vivo functional activity (c) of CD4+ TILs from Her2-BBz or JUN-Her2-BBz CAR T cell treated mice. a) CD4+ as a frequency of total live tumor cells (left). CAR+ as a frequency of total live CD4+ (right). b) %PD-1+ (left) and PD-1 MFI (middle) of total live CD4+ with representative flow histograms (right). Mock untransduced T cells were from spleens of tumor bearing mice at the same timepoint. c) Frequency of indicated cytokine or CD107a producing cells following 5hr restimulation with Nalm6-Her2+ target cells. Gated on total, live CD4+ T cells (left) with representative contour plots (right). Error bars represent mean± SEM of n=6 mice/group. Each data point represents an individual mouse. p-values were calculated using unpaired 2-tailed t-tests. In d-g, dissociated tumor cell suspensions were labeled and FACS-sorted to isolate live, human CD45+ TILs. Sorted cells from 6 mice per group were pooled and ~10,000 cells were processed for 3’ single-cell RNA-seq on the 10X Genomics platform. d) Volcano plot showing results of differential expression analysis comparing JUN-Her2-BBz CAR T cells vs. control Her2-BBz CAR T cells. Top 3 upregulated and downregulated genes are highlighted. e) Heatmap of top 20 most significantly upregulated and downregulated genes. f) UMAP embedding showing JUN-Her2-BBz and control Her2-BBz CAR T cells overlaid. g) Expression of indicated transcripts in JUN-Her2-BBz or control Her2-BBz CAR T cells showing localization of CD4+ and CD8A+ subsets, activation marker (IL2RA), exhaustion marker (NR4A2), and maintenance of a small memory-like population (IL7R+KLF2+) in JUN overexpressing Her2-BBz CAR T cells within solid osteosarcoma tumor microenvironment.
Figure 1:
Figure 1:. HA-28z CAR-T cells manifest phenotypic, functional, transcriptional and epigenetic hallmarks of T cell exhaustion.
a) Primary T cell expansion. Error bars represent mean ± SEM from n=10 independent experiments. b) Surface expression of exhaustion-associated markers. c) Surface expression of CD45RA and CD62L to distinguish T stem-cell-memory (CD45RA+CD62L+), central-memory (CD45RACD62L+), and effector-memory (CD45RACD62L). d) IL-2 (left) and IFNγ (right) release following 24hr co-culture with CD19+GD2+ Nalm6-GD2 leukemia cells. Error bars represent mean ± SD from triplicate wells. In b-d, one representative donor (of n=10 experiments) is shown for each assay. p-values were calculated using unpaired 2-tailed t-tests. e) Principal component analysis (PCA) of global transcriptional profiles of Naïve- and CM-derived CD19- or HA-28z CAR-T cells at days 7, 10, and 14 in culture. PC1 (39.3% variance) separates CD19- from HA-28z CAR-T cells. f) Gene expression of the top 200 genes driving PC1. Genes of interest in each cluster are listed above. g) Differentially accessible chromatin regions (peaks) in CD8+ CD19- and HA-28z CAR T cells. Both N and CM subsets are incorporated for each CAR. h) PCA of ATAC-seq chromatin accessibility in CD19- or HA-28z CAR-T cells. PC1 (76.9% variance) separates CD19- from HA-28z CAR samples. i) Global chromatin accessibility profile of subset-derived CD19- and HA-28z CAR-T cells. Top 5000 peaks. j) Differentially accessible enhancer regions in CD19- and HA-28z CAR-T cells in the CTLA4 (top) or IL7R (bottom) loci. Unless noted otherwise, all analyses were done on day 10 of culture. N – naïve, CM – central memory.
Figure 2:
Figure 2:. AP-1 family signature in exhausted CAR-T cells.
a) Top 25 TF motif deviation scores in day 10 HA vs CD19 CAR-T cells by chromVAR analysis. b) Top TF motifs enriched in Naïve CD8+ HA-28z CAR-T cells. c) Bulk RNA-seq expression (fold change HA/CD19) of indicated AP-1(bZIP) and IRF family members in CD19- (black) and HA-28z (blue) CAR-T cells. Error bars represent mean ± SEM from n=6 samples across 3 donors. p-values calculated using two-tailed ratio t tests. *p < .05, **p < .01, ***p < .001 (exact p values in Supplementary Statistical Tests). d) Increased protein expression of c-Jun, JunB, BATF3, and IRF4 in HA- vs CD19–28z CAR-T cells at d7, d10, and d14 of culture by immunoblotting. e) Immunoprecipitation of c-Jun and JunB complexes demonstrate that HA-28z CAR-T cells contain more c-Jun heterodimers, as well as JunB-IRF4, JunB-BATF and JunB-BATF3 heterodimers than CD19–28z CAR-T cells. f) Correlation network of exhaustion-related TFs in N-derived CD4+ GD2–28z CAR-T cells using single-cell RNA-seq analysis. For gel source data, see Supplementary Fig. 1.
Figure 3:
Figure 3:. c-Jun overexpression enhances the function of exhausted CAR-T cells.
a) JUN-P2A-CAR expression vector. b) Intracellular c-Jun expression in control and JUN-CAR-T cells by flow cytometry (D10). c) Immunoblot for total c-Jun and phospho-c-JunSer73 in control and JUN-CAR-T cells (D10). d) IL-2 and e) IFNγ production following 24hr co-culture of control or JUN-CD19- and HA-CAR-T cells in response to antigen+ tumor cells. Error bars represent mean ± SD of triplicate wells. p-values were calculated using unpaired 2-tailed t-tests. One representative donor. Fold change across n=8 donors in Extended Data Fig. 5. f) Left: Flow cytometry showing representative CD45RA/CD62L expression in Control vs JUN-CAR-T cells (D10). Right: Relative frequency of Effector (CD45RA+CD62L), SCM (CD45RA+CD62L+), CM (CD45RACD62L+), and EM (CD45RA62L) in CD8+ Control or JUN-HA-28z CAR-T cells. n=6 donors from independent experiments. Lines indicate paired samples from the same donor. Paired, two-tailed t-tests were performed. g) On D39 1×10⁶ viable T cells from Ext Data Fig 5 were re-plated and cultured for 7 days ± IL-2. h) Control or JUN-CD19–28z or CD19-BBz CAR-T cells from (g) were cryopreserved on D10 and later thawed, rested overnight in IL-2 and 5×10⁶ cells were IV injected into healthy NSG mice. On D25 post infusion, peripheral blood T cells were quantified by flow cytometry. Error bars represent mean ± SEM of n=5 mice per group. p-values were calculated using unpaired 2-tailed t-tests. HTM – hinge/transmembrane. ICD – intracellular domain.
Figure 4:
Figure 4:. c-Jun functional rescue of exhaustion requires bZIP dimerization but is independent of transactivation.
a) Schematic of c-Jun protein showing N-terminal transactivation domain (TAD) and C-terminal bZIP domain deletion mutants. Red asterisks = JNP sites at Ser63 and Ser73 mutated to alanine in JUN-AA. b) IL-2 (left) and IFNγ (right) release by Control or JUN-HA-28z CAR-T cells expressing the indicated c-Jun variant following 24hr stimulation with Nalm6-GD2 or 143B target cells. Error bars represent mean ± SD of triplicate wells. Representative of 3 independent experiments. c) Immunoblot of indicated AP-1/IRF proteins in Control, JUN-WT, or JUN-ΔbZIP HA-28z CAR-T cells in soluble or chromatin-bound lysis fractions. d) Immunoblot of indicated AP-1/IRF proteins in Control, JUN-WT, or JUN-ΔbZIP HA-28z CAR-T cells in total lysate (right columns) or following JunB IP (left columns). e) Fold change (FC) in IL-2 (upper) and IFNγ (lower) release in AP-1/IRF4 CRISPR KO HA-28z CAR-T cells following 24hr stimulation with Nalm6-GD2 or 143B target cells. FC in cytokine production is normalized to Control HA-28z CAR-T cells. Error bars represent mean± SEM of n=6 independent experiments. WT – wildtype, IP – immunoprecipitation, KO – knockout.
Figure 5:
Figure 5:. JUN-modified CAR-T cells increase in vivo activity against leukemia and enhance T cell function under suboptimal stimulation.
In a-c, NSG mice were injected IV with 1×10⁶ Nalm6-GD2 leukemia cells. 3×10⁶ Mock, HA-28z, or JUN-HA-28z CAR+ T cells were given IV on d3. Tumor progression was monitored using bioluminescent imaging (BLI) (a, c). Scales are normalized for all time points. b) JUN-HA-28z CAR-T cells induced long-term tumor-free survival. Error bars represent mean ± SEM of n=5 mice/group. Reproducible in 3 independent experiments, however, in some experiments long-term survival was diminished due to outgrowth of GD2(−) Nalm6 clones. d) IL-2 and e) IFNγ production following 24hr stimulation of Control or JUN- HA-28z CAR-T cells with immobilized 1A7 anti-CAR idiotype antibody. Each curve was fit with non-linear dose response kinetics to determine EC50. Smaller graphs (right) highlight antibody concentrations <1 ug/mL. Error bars represent mean ± SD of triplicate wells. Representative of 2 independent experiments. f) JUN-CD22-BBz retroviral vector. g) CD22 surface expression on Nalm6, Nalm6–22KO, and Nalm6–22KO+CD22low. h) IL-2 (left) and IFNγ (right) release following co-culture of Nalm6 and Nalm6–22low with Control or JUN-CD22-BBz CAR-T cells. Error bars represent mean ± SD of triplicate wells. Representative of 3 independent experiments. In i-l), NSG mice were inoculated with 1×10⁶ Nalm6–22low leukemia cells IV. On d4, 3×10⁶ Mock, Control or JUN-CD22-BBz CAR+ T cells were transferred IV. Tumor growth was monitored by BLI (i, l). j) Mice receiving JUN-22-BBz CAR-T cells display increased peripheral blood T cells on d23. k) Long term survival of CAR treated mice. In i-j, error bars represent mean ± SEM of n=5 mice per group. Representative of 2 independent experiments with similar results. Unless otherwise noted, p-values were calculated using unpaired 2-tailed t-tests. Survival curves were compared using the log-rank Mantel-Cox test.
Figure 6:
Figure 6:. c-Jun overexpression enhances CAR-T cell efficacy and decreases hypofunction within solid tumors
NSG mice were inoculated with 1×10⁶ 143B osteosarcoma cells via intramuscular injection. 1×10⁷ Mock, Her2-BBz, or JUN-Her2-BBz CAR-T cells were given IV on d14. a) Tumor growth (monitored by caliper measurements). b-g) On d28 mice were euthanized and tumor tissue was collected and mechanically dissociated. Single cell suspensions were labeled for analysis by flow cytometry (b-c), restimulated with Nalm6-Her2+ target cells and analyzed for intracellular cytokine production (d), or FACS-sorted to isolate live, human CD45+ TILs (e-g). b) CD8+ as a frequency of total live tumor cells (left). CAR+ as a frequency of total live CD8+ (right). c) PD-1+/CD39+ as a frequency of total live CD8+ (left) with representative contour plots (right). d) Frequency of indicated cytokine or CD107a producing cells following 5hr restimulation with Nalm6-Her2+ target cells. Gated on total, live CD8+ T cells (left) with representative contour plots (right). e) IL-2 secretion following 24hr restimulation of sorted CD45+ TILs with Nalm6-Her2+ target cells. In a-e, error bars represent mean± SEM of n=6–8 mice/group. Unless otherwise noted, p-values were calculated using unpaired 2-tailed t-tests. f) Relative frequency of sorted CD45+ TILs in each phase of the cell cycle as determined by single-cell RNA-seq. g) Log2 fold change in JUN/Control Her2-BBz CAR-T cells for the indicated transcripts.

Comment in

  • Overcoming CAR T cell exhaustion.
    Minton K. Minton K. Nat Rev Immunol. 2020 Feb;20(2):72-73. doi: 10.1038/s41577-019-0265-x. Nat Rev Immunol. 2020. PMID: 31844329 No abstract available.
  • Prevention of CAR-T-cell dysfunction.
    LaFleur MW, Miller BC, Sharpe AH. LaFleur MW, et al. Nat Biomed Eng. 2020 Jan;4(1):16-17. doi: 10.1038/s41551-019-0512-2. Nat Biomed Eng. 2020. PMID: 31911621 No abstract available.
  • Next-Generation CAR T Cells Counter Exhaustion.
    [No authors listed] [No authors listed] Cancer Discov. 2020 Feb;10(2):166-167. doi: 10.1158/2159-8290.CD-NB2019-146. Epub 2020 Jan 8. Cancer Discov. 2020. PMID: 31915194

Similar articles

Cited by

References

    1. Maude SL et al. Tisagenlecleucel in Children and Young Adults with B-Cell Lymphoblastic Leukemia. N Engl J Med 378, 439–448, doi:10.1056/NEJMoa1709866 (2018). - DOI - PMC - PubMed
    1. Neelapu SS et al. Axicabtagene Ciloleucel CAR T-Cell Therapy in Refractory Large B-Cell Lymphoma. N Engl J Med 377, 2531–2544, doi:10.1056/NEJMoa1707447 (2017). - DOI - PMC - PubMed
    1. June CH, O’Connor RS, Kawalekar OU, Ghassemi S & Milone MC CAR T cell immunotherapy for human cancer. Science 359, 1361–1365, doi:10.1126/science.aar6711 (2018). - DOI - PubMed
    1. Wherry EJ et al. Molecular signature of CD8+ T cell exhaustion during chronic viral infection. Immunity 27, 670–684, doi:10.1016/j.immuni.2007.09.006 (2007). - DOI - PubMed
    1. Wherry EJ & Kurachi M Molecular and cellular insights into T cell exhaustion. Nat Rev Immunol 15, 486–499, doi:10.1038/nri3862 (2015). - DOI - PMC - PubMed

REFERENCES FOR METHODS

    1. Hudecek M et al. The nonsignaling extracellular spacer domain of chimeric antigen receptors is decisive for in vivo antitumor activity. Cancer Immunol Res 3, 125–135, doi:10.1158/2326-6066.CIR-14-0127 (2015). - DOI - PMC - PubMed
    1. Jena B et al. Chimeric antigen receptor (CAR)-specific monoclonal antibody to detect CD19-specific T cells in clinical trials. PLoS One 8, e57838, doi:10.1371/journal.pone.0057838 (2013). - DOI - PMC - PubMed
    1. Sotillo E et al. Coordinated activation of the origin licensing factor CDC6 and CDK2 in resting human fibroblasts expressing SV40 small T antigen and cyclin E. J Biol Chem 284, 14126–14135, doi:10.1074/jbc.M900687200 (2009). - DOI - PMC - PubMed
    1. Nagaraja S et al. Transcriptional Dependencies in Diffuse Intrinsic Pontine Glioma. Cancer Cell 31, 635–652 e636, doi:10.1016/j.ccell.2017.03.011 (2017). - DOI - PMC - PubMed
    1. Corces MR et al. An improved ATAC-seq protocol reduces background and enables interrogation of frozen tissues. Nat Methods 14, 959–962, doi:10.1038/nmeth.4396 (2017). - DOI - PMC - PubMed

Publication types

Substances