. 2019 Dec;576(7785):106-111.
doi: 10.1038/s41586-019-1793-z. Epub 2019 Dec 4.

The GenomeAsia 100K Project enables genetic discoveries across Asia

Collaborators

The GenomeAsia 100K Project enables genetic discoveries across Asia

GenomeAsia100K Consortium. Nature. 2019 Dec.

Abstract

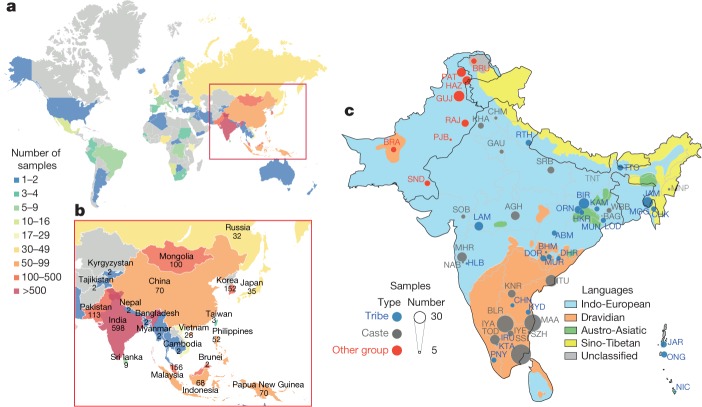
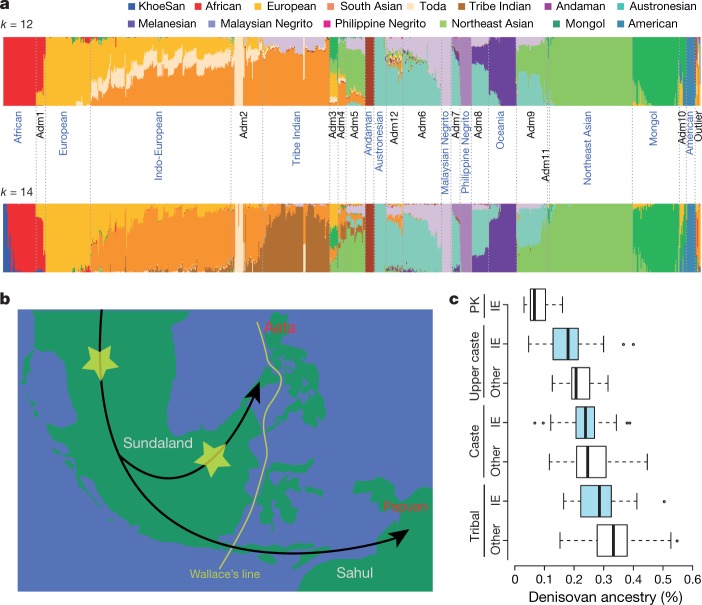
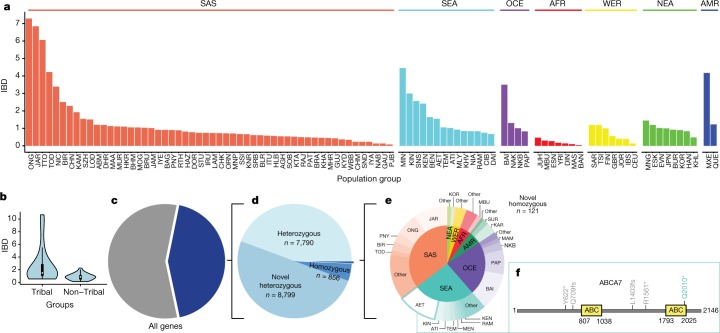
The underrepresentation of non-Europeans in human genetic studies so far has limited the diversity of individuals in genomic datasets and led to reduced medical relevance for a large proportion of the world's population. Population-specific reference genome datasets as well as genome-wide association studies in diverse populations are needed to address this issue. Here we describe the pilot phase of the GenomeAsia 100K Project. This includes a whole-genome sequencing reference dataset from 1,739 individuals of 219 population groups and 64 countries across Asia. We catalogue genetic variation, population structure, disease associations and founder effects. We also explore the use of this dataset in imputation, to facilitate genetic studies in populations across Asia and worldwide.


Conflict of interest statement

A.S.P., E.W.S., S. Seshagiri, T.B., J.T.G., J.T., J. Stinson, Q.B., M.S.S., S.D. and K.S. were employees of Genentech at the time this work was carried out. S. Santhosh, A.V., M. Pratapneni, V. Ramprasad, S.P., R.M., R.G., S.N., S.M., T.S., V.G., J.T.G., M.D. and S.P. are employees of and/or have equity in MedGenome. C.K., J.-S.S. and J.-Y.S. are employees of Macrogen.

Figures

Fig. 1
Fig. 1. Sampling distribution of GAsP.
a, b, Sample sizes. c, Location, language and social hierarchy associated with samples from south Asia. Groups with fewer than three samples are not plotted. See Supplementary Table 1a for definitions and descriptions of samples and population groups included in each geographically defined set.
Fig. 2
Fig. 2. Population structure and admixture.
a, ADMIXTURE plots for k = 12 and k = 14 illustrating the identification of 12 reference groups. b, Proposed modern human migration route into southeast Asia during the Last Glacial Maximum with potential locations of Denisovan admixture (yellow asterisks). Green indicates the above water landmass at the glacial maximum and white outlines indicate present-day shorelines. c, Estimates of Denisovan ancestry in south Asians, stratified by social/cultural group and language. IE, Indo-European. Adivasi Indo-European, n = 30; Adivasi non-Indo-European, n = 196; caste Indo-European, n = 68; caste non-Indo-European, n = 155; upper caste Indo-European, n = 49; upper caste non-Indo-European, n = 19; Pakistani Indo-European, n = 79. The centre line indicates the median; box limits show the middle 50%; whiskers extend two standard deviations from the mean; points are outliers.
Fig. 3
Fig. 3. Disease-relevant variant discovery.
a, Filtering using the GAsP dataset improves candidate variant discovery by removing population specific variants (n = 152). The centre line indicates the median; box limits show the upper and lower quartiles; whiskers extend 1.5× the interquartile range. b, Allele count (AC) and frequency distribution of variants in the GAsP dataset that are designated disease-causing in the Human Gene Mutation Database (HGMD) or pathogenic in ClinVar. Autosomal-dominant (AD) or autosomal-recessive (AR) or other (unknown) classification as per OMIM. A number of variants (n = 37) that had previously been reported to be pathogenic are found in the GAsP study dataset at high frequency and were reclassified (Supplementary Table 4d). c, Frequency of β-thalassaemia variant (chromosome 11:5248155 c.92+5G>C) across Asia shows a geographical enrichment. MAF in South Asia is 1.4%. NA, not available. d, Novel cancer-predisposing variants identified in the GenomeAsia dataset. e, Population-specific probabilities of adverse drug reactions predicted from the aggregate allele frequencies of known variants associated with response to the indicated drugs.
Fig. 4
Fig. 4. Founder effects and homozygous loss of function.
a, IBD scores across different population groups are shown for 96 ethnicities (1,417 samples) across global regions. The scores given in the figure are relative ratios compared to that of the Finnish group. b, Violin plot showing IBD scores in 29 tribal groups and 25 non-tribal groups consisting of 293 and 336 samples, respectively. The centre line indicates the median; box limits show 1.5× the interquartile range. c, Proportion of genes with at least one high-confidence PTV. d, Proportion of novel, known, heterozygous and homozygous PTVs in the GAsP dataset. e, Pie chart of novel homozygous PTVs plotted by region (inner circle) and population group (outer circle). Groups with less than two PTVs were grouped as other. f, Novel homozygous PTV Q2010* (green) found in ABCA7 localizes to the C-terminal ABC domain. Previously reported PVTs are shown in grey.
Extended Data Fig. 1
Extended Data Fig. 1. Diversity and divergence times of GAsP samples.
a, PCA plot of study samples. Africa (AFR), n = 102; West Eurasia (WER), n = 111; South Asia (SAS), n = 642; Southeast Asia (SEA), n = 162; Oceania (OCE), n = 68; Northeast Asia (NEA), n = 346; Americas (AMR), n = 26. The samples included in each of these geographically defined groups are described in Supplementary Table 1a. b, MSMC cross-coalescence rates showing divergence time estimates between different groups. The point estimate of the date was given at which 25%,50% and 75% of lineages in the pair of populations have coalesced into a commonancestral population.
Extended Data Fig. 2
Extended Data Fig. 2. Characteristics of GAsP SNPs and indels.
a, b, Comparison of all GAsP variants (a) or coding variants (b) with gnomAD, ExAC, 1000 Genomes, ESP and dbSNP data as a function of the MAF within the GAsP dataset. c, d, The number and lengths of small indels in the genome (c) or coding regions (d). eh, Proportion of non-coding (e, g) or coding (f, h) indels that were singletons (e, f) or rare (allele frequency of <0.1%; g, h).

References

    1. Popejoy AB, Fullerton SM. Genomics is failing on diversity. Nature. 2016;538:161–164. - PMC - PubMed
    1. Martin AR, et al. Clinical use of current polygenic risk scores may exacerbate health disparities. Nat. Genet. 2019;51:584–591. - PMC - PubMed
    1. The Genome of the Netherlands Consortium Whole-genome sequence variation, population structure and demographic history of the Dutch population. Nat. Genet. 2014;46:818–825. - PubMed
    1. The 1000 Genomes Project Consortium A global reference for human genetic variation. Nature. 2015;526:68–74. - PMC - PubMed
    1. Gurdasani D, et al. The African Genome Variation Project shapes medical genetics in Africa. Nature. 2015;517:327–332. - PMC - PubMed

Publication types