Comparative Study
. 2020 Sep;303(9):2415-2475.
doi: 10.1002/ar.24326. Epub 2020 Jan 1.

Comparative dental anatomy in newborn primates: Cusp mineralization

Affiliations
Comparative Study

Comparative dental anatomy in newborn primates: Cusp mineralization

Kelsey Paddock et al. Anat Rec (Hoboken). 2020 Sep.

Abstract

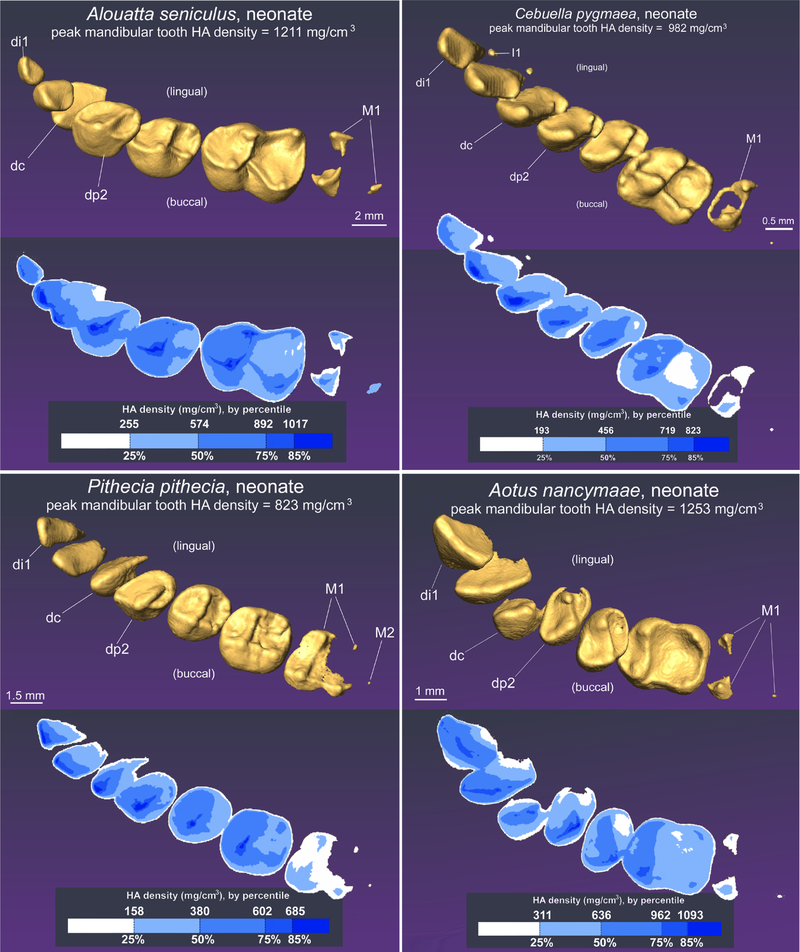
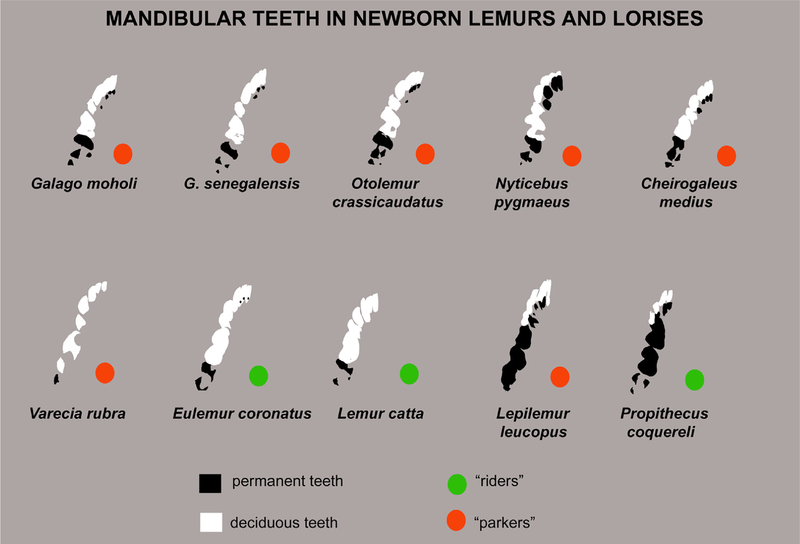
Previous descriptive work on deciduous dentition of primates has focused disproportionately on great apes and humans. To address this bias in the literature, we studied 131 subadult nonhominoid specimens (including 110 newborns) describing deciduous tooth morphology and assessing maximum hydroxyapatite density (MHD). All specimens were CT scanned at 70 kVp and reconstructed at 20.5-39 μm voxels. Grayscale intensity from scans was converted to hydroxyapatite (HA) density (mg HA/cm3 ) using a linear conversion of grayscale values to calibration standards of known HA density (R2 = .99). Using Amira software, mineralized dental tissues were captured by segmenting the tooth cusps first and then capturing the remainder of the teeth at descending thresholds of gray levels. We assessed the relationship of MHD of selected teeth to cranial length using Pearson correlation coefficients. In monkeys, anterior teeth are more mineralized than postcanine teeth. In tarsiers and most lemurs and lorises, postcanine teeth are the most highly mineralized. This suggests that monkeys have a more prolonged process of dental mineralization that begins with incisors and canines, while mineralization of postcanine teeth is delayed. This may in part be a result of relatively late weaning in most anthropoid primates. Results also reveal that in lemurs and lorises, MHD of the mandibular first permanent molar (M1 ) negatively correlates with cranial length. In contrast, the MHD of M1 positively correlates with cranial length in monkeys. This supports the hypothesis that natural selection acts independently on dental growth as opposed to mineralization and indicates clear phylogenetic differences among primates.

Keywords: catarrhine; deciduous; dentition; platyrrhine.


Figures

FIGURE 1
FIGURE 1
Matching histology and μ-CT slices, following alignment (a, b), showing M1 of Tarsius syrichta. Boxes indicate site of enlarged views (c, d). Enamel (E) and dentin (D) are distinct at the cusp tip (e.g., protocone shown in 1b). However, near the base of the cusps (e.g., paracone, 1c), or in the basins (1d) microCT cannot distinguish enamel and dentin. Scale bars: a,b, 0.5 mm; c,d 20 μm
FIGURE 2
FIGURE 2
(a,b) The M3 tooth germ of T. syrichta has a mineralized paracone only. Histology confirms that the tip of the cusp is mature dentin, but tapers to only predentin approaching the base of the cusp (c). The cusp tip is easily detected via μ-CT (d). The cusp itself is barely thicker than voxel size. Low ranges of thresholds may detect less mineralized dentin (e), but may exaggerate the thickness of the cusp tip, which is identified by a narrower threshold range (f). Scale bars: a, 0.5 mm; b, 150 μm; c, 20 μm; d, 0.5 mm
FIGURE 3
FIGURE 3
μ-CT slices showing similar cross-sectional levels of deciduous anterior teeth (a,b,) and dp4 (c,d) in a newborn Callithrix jacchus scanned using different energy levels. On the left side are slices with the head scanned at 70 kVp (a,c); on the right are slices with the head scanned at 45 kVp (b,d). The 70 kVp reveals a sharper boundary between adjacent teeth (see open arrow inset, a) compared to the 45 kVp scan (inset, b). Conversely, the 45 kVp was more effective at revealing the cervical region of the crown (c,d: *), where the cusp was least mineralized
FIGURE 4
FIGURE 4
(a) Histological section of dp4 in a newborn squirrel monkey (Saimiri), showing the maxillary dp4 in the region of the paracone. Note that enamel (E) is present, though fragmented near the cusp tip (D = dentin). (b) The same specimen shown as a μ-CT slice aligned to histology; enamel is distinctly more radio-opaque than the dentin, especially along the cusps. A low threshold range, such as that shown in Plate c (46–70 gray level range) is required to capture the least mineralized dentin found closest to the cervical region (red arrows). However, this range also captures a halo of noise surrounding the crown, including the occlusal surface. As a result, a slice segmented with a threshold that captures all gray levels above that which captures the least mineralized dentin results in a rough cusp surface, with artifactual complexity (red arrows). e) A more limited grayscale range of 99 to 174 captures a specific deeper part of the crown, but appears to exclude the densest enamel. Also, a comparison to the matching level of histology (right) suggests this threshold range isolates the full depth of dentin in the paracone
FIGURE 5
FIGURE 5
Histology versus μ-CT-derived measurements. Graphs show measurements “height” (maximum apical-basal thickness) of dentin in the paracone of dp4 or M1, as measured using histology and μ-CT. In these specimens (newborn Saimiri boliviensis and Tarsius syrichta), the μ-CT scan volumes were aligned so that serial slices matched the same plan as histological sections of the same heads. Matching levels of histology and μ-CT slices were used for these measurements. Correlation coefficient for a comparison between methods is shown in the bottom right of each graph
FIGURE 6
FIGURE 6
Stepwise method of crown segmentation. In initial phases of segmentation (a), the range of gray levels is carefully selected to establish a relatively smooth occlusal surface (see right side image), and to avoid capturing artefactual “stray” voxels (left side, arrows). Subsequent phases of segmentation are similarly conducted by establishing incrementally lower ranges of gray levels (b), being careful not to allow captured ranges of voxels to “bleed” out onto the occlusal surface (left side, arrows), while adding more of the crown in less-mineralized areas (right side)
FIGURE 7
FIGURE 7
Morphology and hydroxyapatite density in maxillary tooth crowns at birth in Allenopithecus nigroviridis, Cercocebus atys, Papio anubis, and Trachypithecus francoisi. In Allenopithecus and Trachypithecus, the right jaw is shown (inverted to facilitate comparison to other species) and the left jaw is shown in the other species. At the top of each image, the peak (or maximum) hydroxyapatite density for the pictured specimen is indicated
FIGURE 8
FIGURE 8
Morphology and hydroxyapatite density in mandibular tooth crowns at birth in Allenopithecus nigroviridis, Cercocebus atys, Papio anubis, and Trachypithecus francoisi. In Allenopithecus the right jaw is shown (inverted to facilitate comparison to other species) and the left jaw is shown in the other species
FIGURE 9
FIGURE 9
Morphology and hydroxyapatite density in left maxillary tooth crowns at birth in Alouatta seniculus, Cebuella pygmaea, Pithecia pithecia, and Aotus nancymaae
FIGURE 10
FIGURE 10
Morphology and hydroxyapatite density in left mandibular tooth crowns at birth in Alouatta seniculus, Cebuella pygmaea, Pithecia pithecia, and Aotus nancymaae
FIGURE 11
FIGURE 11
Morphology and hydroxyapatite density in maxillary tooth crowns at birth in Tarsius syrichta. A Day 0 newborn is shown using the right jaw
FIGURE 12
FIGURE 12
Morphology and hydroxyapatite density in left mandibular tooth crowns at birth in Tarsius syrichta. A Day 6 newborn is shown
FIGURE 13
FIGURE 13
Morphology and hydroxyapatite density in left maxillary tooth crowns at birth in Microcebus murinus, Eulemur collaris, Propithecus coquereli, and Lepilemur leucopus
FIGURE 14
FIGURE 14
Morphology and hydroxyapatite density in left mandibular tooth crowns at birth in Microcebus murinus, Eulemur collaris, Propithecus coquereli, and Lepilemur leucopus
FIGURE 15
FIGURE 15
Morphology and hydroxyapatite density in maxillary tooth crowns at birth in Otolemur crassicaudatus and Nycticebus pygmaeus. In Otolemur crassicaudatus, the right jaw is shown (inverted to facilitate comparison to other species) and the left jaw is shown in Nycticebus pygmaeus
FIGURE 16
FIGURE 16
Morphology and hydroxyapatite density in mandibular tooth crowns at birth in Otolemur crassicaudatus and Nycticebus pygmaeus. In Otolemur crassicaudatus, the right jaw is shown (inverted to facilitate comparison to other species) and the left jaw is shown in Nycticebus pygmaeus
FIGURE 17
FIGURE 17
Maximum hydroxyapatite density (MHD) of the last mandibular deciduous premolar (circles) and the first mandibular permanent molar (triangles) plotted against duration of fixation in formalin. All specimens are from the Duke Lemur Center
FIGURE 18
FIGURE 18
(Top) MHD of dp4 plotted against cranial length. The dashed line illustrates the negative slope for the significant correlation of dp4 in strepsirrhines. (Bottom) MHD of M1 plotted against cranial length. The dashed line illustrates the negative slope for the significant correlation of M1 in strepsirrhines; the solid line illustrates the positive slope for the significant correlation of M1 in Old and New World monkeys. Hg, Hapalemur griseus; Ll, Lepilemur leucopus; Pc, Propithecus coquereli
FIGURE 19
FIGURE 19
Survey of hydroxyapatite density in mandibular teeth in newborn strepsirrhines. As in earlier plates, blue coding reveals the 25th, 50th, 75th, and 85th percentiles of MHD (light blue = 25th; darkest blue = 85th). Arrow indicates dp4
FIGURE 20
FIGURE 20
Survey of MHD profiles of mandibular teeth in newborn haplorhines. As in earlier plates, blue coding reveals the 25th, 50th, 75th, and 85th percentiles of MHD (light blue = 25th; darkest blue = 85th). Arrow indicates dp4
FIGURE 21
FIGURE 21
Survey of cusp mineralization patterns in strepsirrhines at late fetal to subadult ages. As in earlier plates, blue coding reveals the 25th, 50th, 75th, and 85th percentiles of MHD (light blue = 25th; darkest blue = 85th). Note that hydroxyapatite density is initially highest anteriorly, and at older ages postcanine teeth contain the peaks in hydroxyapatite density. Solid arrow indicates dp4; open arrow indicates M1
FIGURE 22
FIGURE 22
Occlusal view showing extent of mineralization of mandibular dp4 and M1 in newborn primates
FIGURE 23
FIGURE 23
Mineralized portions of deciduous (white) and replacement (black) tooth crowns at birth in newborn strepsirrhines with different parenting strategies

References

    1. Ahrens H. (1913). Die Entwicklung der menschlichen Zähne. Anatomische Hefte, 48, 169–257.
    1. Anemone RL, Mooney MP, & Siegel MI (1996). Longitudinal study of dental development in chimpanzees of known chronological age: Implications for understanding age at death of Plio-Pleistocene hominids. American Journal of Physical Anthropology, 99, 119–133. - PubMed
    1. Anemone RL, Skinner MM, & Dirks W. (2012). Are there two distinct types of hypocone in Eocene primates? The ‘pseudohypocone’ of notharctines revisited. Paleontologia Electronica, 15, 26A.
    1. Avery JK (2002). Oral development and histology (3rd ed.). New York, NY: Thieme Medical Publishers.
    1. Benefit BR (1994). Phylogenetic, paleodemographic, and taphonomic implications of Victoriapithecus deciduous teeth from Maboko, Kenya. American Journal of Physical Anthropology, 95, 277–331. - PubMed

Publication types

LinkOut - more resources