. 2020 May;72(5):769-779.
doi: 10.1002/art.41187. Epub 2020 Apr 3.

B Cell Tetherin: A Flow Cytometric Cell-Specific Assay for Response to Type I Interferon Predicts Clinical Features and Flares in Systemic Lupus Erythematosus

Affiliations

B Cell Tetherin: A Flow Cytometric Cell-Specific Assay for Response to Type I Interferon Predicts Clinical Features and Flares in Systemic Lupus Erythematosus

Yasser M El-Sherbiny et al. Arthritis Rheumatol. 2020 May.

Abstract

Objective: Type I interferon (IFN) responses are broadly associated with autoimmune diseases, including systemic lupus erythematosus (SLE). Given the cardinal role of autoantibodies in SLE, this study was undertaken to investigate whether the findings of a B cell-specific IFN assay correlate with SLE activity.

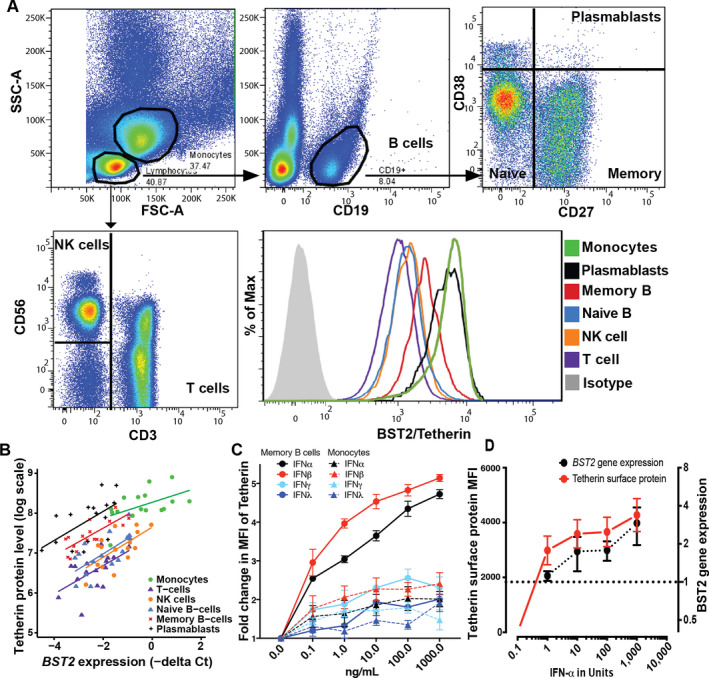
Methods: B cells and peripheral blood mononuclear cells (PBMCs) were stimulated with type I IFN and type II IFN. Gene expression was analyzed, and the expression of pathway-related membrane proteins was determined. A flow cytometry assay for tetherin (CD317), an IFN-induced protein ubiquitously expressed on leukocytes, was validated in vitro and then clinically against SLE diagnosis, plasmablast expansion, and the British Isles Lupus Assessment Group (BILAG) 2004 score in a discovery cohort (n = 156 SLE patients, 30 rheumatoid arthritis [RA] patients, and 25 healthy controls). A second, longitudinal validation cohort of 80 SLE patients was also evaluated for flare prediction.

Results: In vitro, a close cell-specific and dose-response relationship between type I IFN-responsive genes and cell surface tetherin was observed in all immune cell subsets. Tetherin expression on multiple cell subsets was selectively responsive to stimulation with type I IFN compared to types II and III IFNs. In patient samples from the discovery cohort, memory B cell tetherin showed the strongest associations with diagnosis (SLE:healthy control effect size 0.11 [P = 0.003]; SLE:RA effect size 0.17 [P < 0.001]), plasmablast numbers in rituximab-treated patients (R = 0.38, P = 0.047), and BILAG 2004. These associations were equivalent to or stronger than those for IFN score or monocyte tetherin. Memory B cell tetherin was found to be predictive of future clinical flares in the validation cohort (hazard ratio 2.29 [95% confidence interval 1.01-4.64]; P = 0.022).

Conclusion: Our findings indicate that memory B cell surface tetherin, a B cell-specific IFN assay, is associated with SLE diagnosis and disease activity, and predicts flares better than tetherin on other cell subsets or whole blood assays, as determined in an independent validation cohort.


Figures

Figure 1
Figure 1
Tetherin is a scalable cell‐specific measure of type I interferon (IFN) response. A, Gating strategy for flow cytometric assessment of tetherin on immune cell subsets. A representative flow cytometry plot of tetherin protein expression on individual immune cell subsets is shown. FSC‐A and SSC‐A were used to define lymphocytes and monocytes. B cells were defined as CD19+ lymphocytes and subdivided into naive, memory, and plasmablast subsets using CD27 and CD38. T cells were defined as CD3+, and natural killer (NK) cells were defined as CD3–CD56+ lymphocytes. The mean fluorescence intensity (MFI) of bone marrow stromal antigen 2/tetherin for each cell subset compared to isotype control is shown. B, Correlation of tetherin protein level with BST2 gene expression for the indicated immune cell subsets. In order to validate tetherin as a cell‐specific marker, tetherin protein expression was compared with expression of its gene BST2 in various immune cell subsets in systemic lupus erythematosus patients and healthy controls. Cell surface tetherin protein levels were determined in unsorted peripheral blood mononuclear cells (PBMCs) by flow cytometry, and BST2 gene expression data were determined by quantitative polymerase chain reaction of cells sorted by fluorescence‐activated cell sorting. There was a strong correlation between gene expression and protein level within each subset, allowing differences in IFN‐stimulated gene expression between cell subsets to be measured without cell sorting (for monocytes, R = 0.47, P = 0.064; for T cells, R = 0.61, P = 0.012; for NK cells, R = 0.63, P = 0.008; for naive B cells, R = 0.63, P = 0.009; for memory B cells, R = 0.78, P = 0.001; and for plasmablasts, R = 0.58, P = 0.018). C, Dose‐dependent response of memory B cell tetherin and monocyte tetherin to IFN. Healthy control PBMCs (n = 3 samples) were stimulated with increasing doses of IFNα, IFNβ, IFNγ, and IFNλ, and tetherin MFI was determined by flow cytometry. D, Tetherin protein levels and BST2 gene expression levels in sorted B cells stimulated in vitro with increasing doses of IFNα and evaluated by flow cytometry. There was a parallel increase in each marker. Dotted line indicates a 1‐fold increase in BST2 gene expression. In C and D, values are the mean ± SD.
Figure 2
Figure 2
Performance of the tetherin interferon (IFN) flow cytometry assay in discriminating patients based on diagnosis. Age‐adjusted differences in tetherin levels on the indicated cell subsets between patients with systemic lupus erythematosus (SLE), patients with active rheumatoid arthritis (RA) (with a Disease Activity Score in 28 joints of >3.2), and healthy controls (HCs) are shown. Cell surface bone marrow stromal antigen 2/tetherin protein levels were determined by flow cytometry of peripheral blood mononuclear cells. Effect sizes (partial η2) indicate the degree to which variables differed between groups. We considered an effect size of ≤0.01 to be small, ~0.06 to be medium, and ≥0.14 to be large . Bars show the mean and 90% confidence interval (90% CI). NK = natural killer. Color figure can be viewed in the online issue, which is available at http://onlinelibrary.wiley.com/doi/10.1002/art.41187/abstract.
Figure 3
Figure 3
Association between interferon (IFN) assays and disease activity in systemic lupus erythematosus (SLE). A, Association between different IFN assays (IFN score A, monocyte tetherin levels, and memory B cell tetherin levels) and the number of organ systems (domains) with active disease in the discovery cohort (164 observations in 124 SLE patients). IFN score A was increased in patients with ≥3 active domains, but not in patients with 1 or 2 active domains, compared to those with 0 active domains (remission). Tetherin mean fluorescence intensity (MFI) measured on memory B cells demonstrated a more consistent stepwise increase with increasing disease activity. Bars show the mean and 90% confidence interval (90% CI), calculated using the 2−ΔCt method (i.e., taller bars represent higher expression). Broken lines and shaded areas represent the mean and 90% CI in healthy controls (HCs; n = 23). B, Association between different IFN assays and musculoskeletal and mucocutaneous disease activity. Disease activity was defined as active (British Isles Lupus Assessment Group [BILAG] score of A or B) or inactive (BILAG score of D or E). Patients with activity in other organs were excluded. For IFN score A, there were inconsistent relationships with disease activity, with an increase with skin involvement, but not musculoskeletal involvement alone. For monocyte tetherin levels, increased protein expression was seen with musculoskeletal disease activity but not with skin activity alone. Tetherin levels measured on memory B cells demonstrated a consistent relationship with both common types of clinical disease. Bars show the median. C, Association between different IFN assays (monocyte tetherin levels and memory B cell tetherin levels) and the number of organ systems with active disease in the validation cohort. Results were similar to those for the discovery cohort, shown in A. Bars show the mean ± SD (n = 80 patients). D, Scatterplots showing association between overall disease activity (BILAG global score) and tetherin levels. There was a significant association between BILAG global score and memory B cell tetherin levels but not monocyte tetherin levels. E, Relationship between tetherin levels and SLE disease flare. Memory B cell tetherin levels were significantly predictive of subsequent clinical flare (hazard ratio [HR] 2.290 [95% CI 1.013–4.644]; P = 0.022), while monocyte tetherin levels were not (HR 0.814 [95% CI 0.580–1.141]; P = 0.231).

References

    1. Crow MK. Type I interferon in the pathogenesis of lupus. J Immunol 2014;192:5459–68. - PMC - PubMed
    1. Rönnblom L, Eloranta ML. The interferon signature in autoimmune diseases. Curr Opin Rheumatol 2013;25:248–53. - PubMed
    1. Niewold TB. Interferon α as a primary pathogenic factor in human lupus. J Interferon Cytokine Res 2011;31:887–92. - PMC - PubMed
    1. Vidal‐Laliena M, Romero X, March S, Requena V, Petriz J, Engel P. Characterization of antibodies submitted to the B cell section of the 8th Human Leukocyte Differentiation Antigens Workshop by flow cytometry and immunohistochemistry. Cell Immunol 2005;236:6–16. - PubMed
    1. Evans EJ, Hene L, Sparks LM, Dong T, Retiere C, Fennelly JA, et al. The T cell surface—how well do we know it? Immunity 2003;19:213–23. - PubMed

Publication types

MeSH terms

Substances