. 2019 Dec 5;9(1):329.
doi: 10.1038/s41398-019-0656-6.

Pten haploinsufficiency disrupts scaling across brain areas during development in mice

Affiliations

Pten haploinsufficiency disrupts scaling across brain areas during development in mice

Amy E Clipperton-Allen et al. Transl Psychiatry. .

Abstract

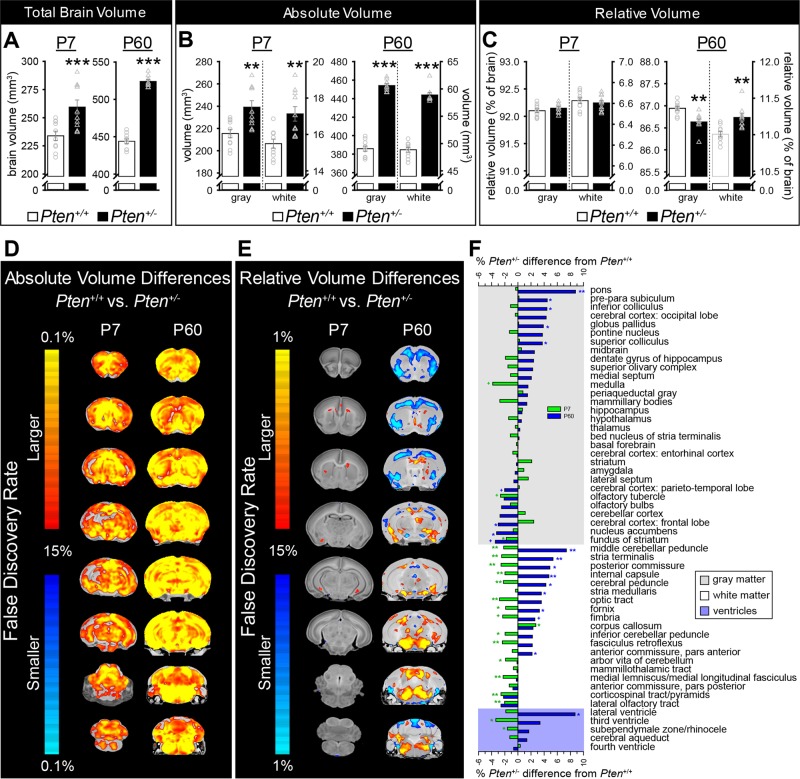
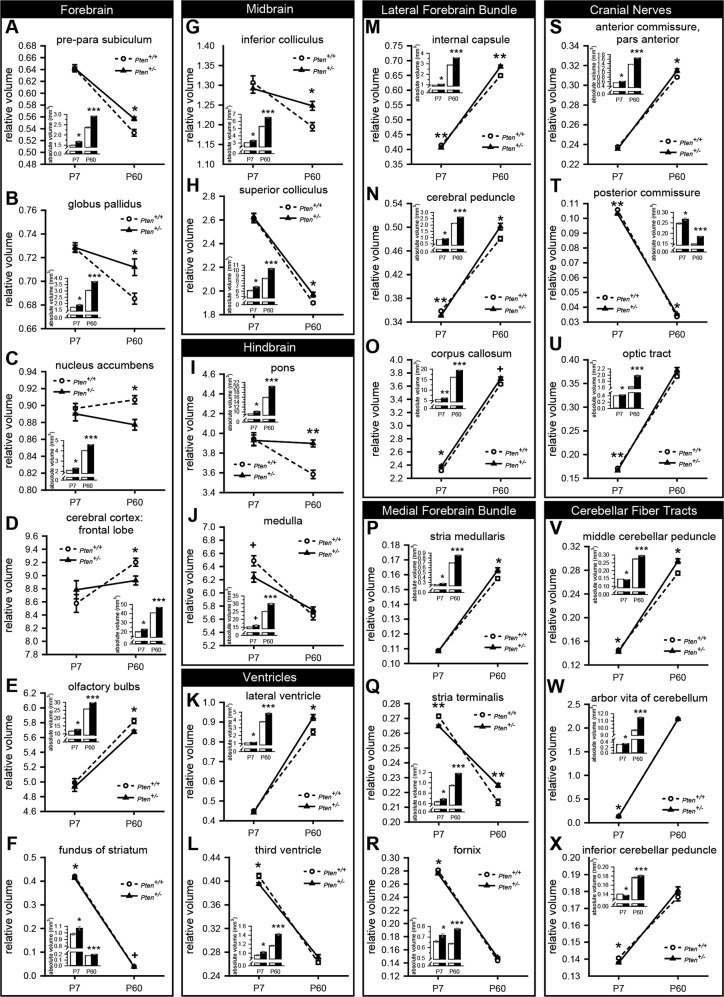
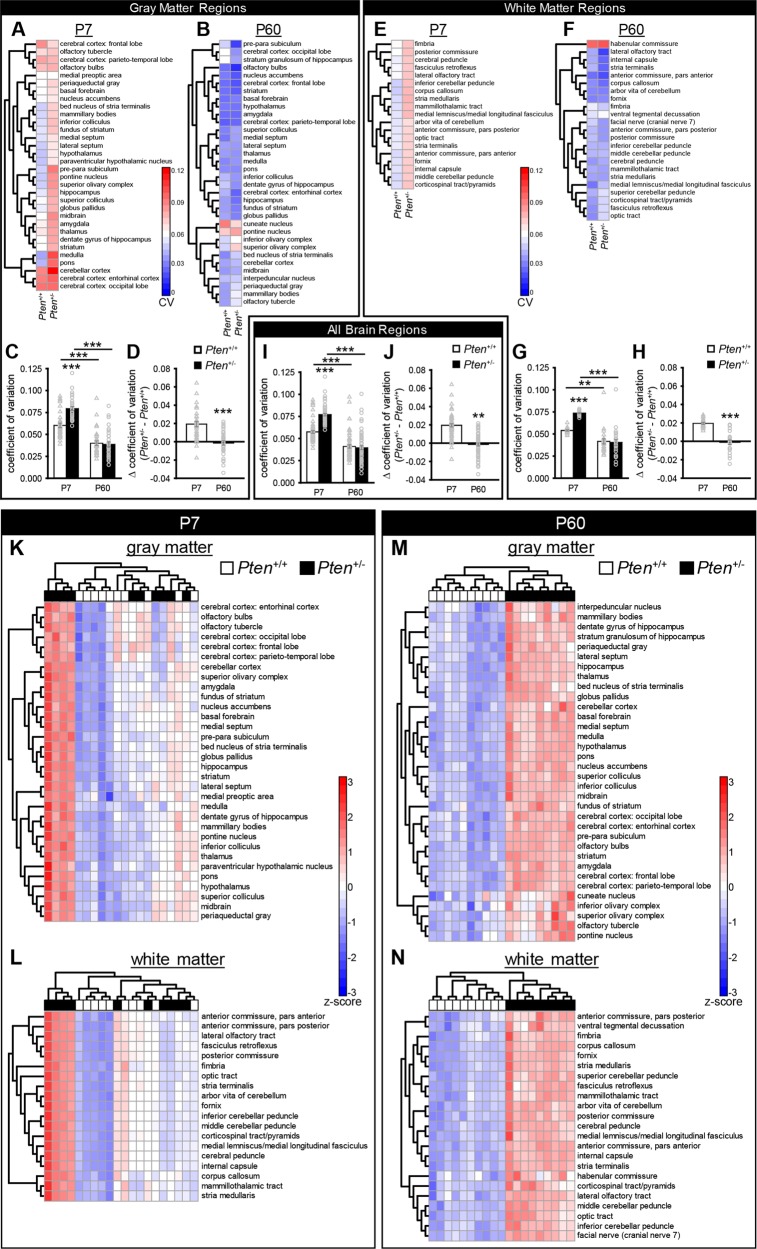
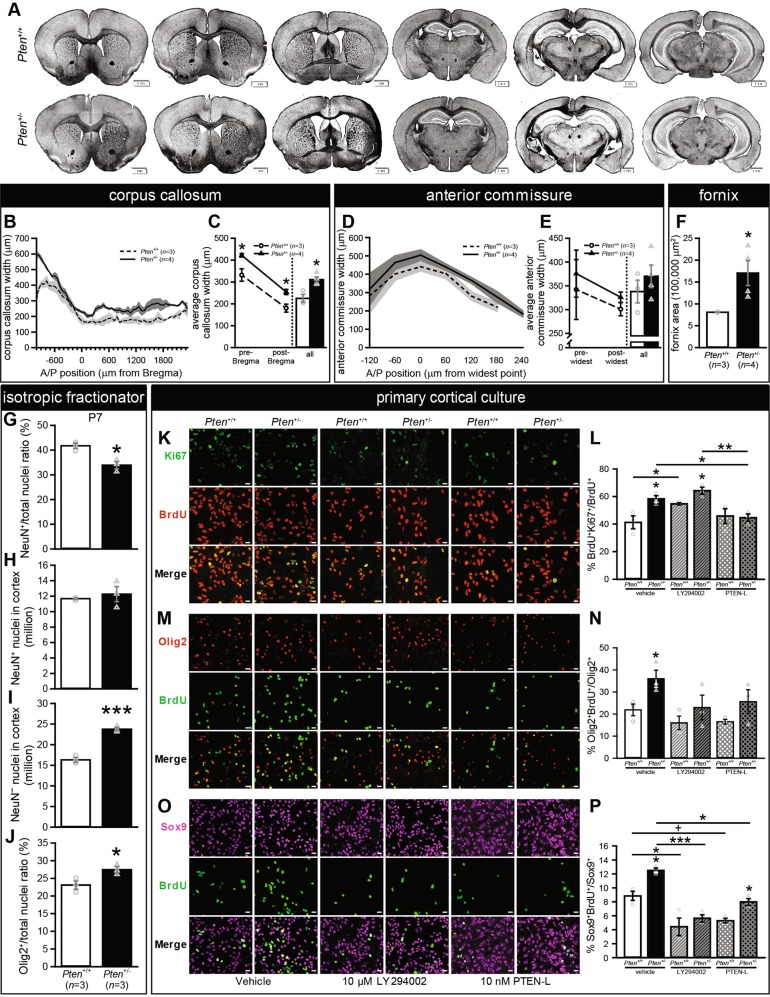
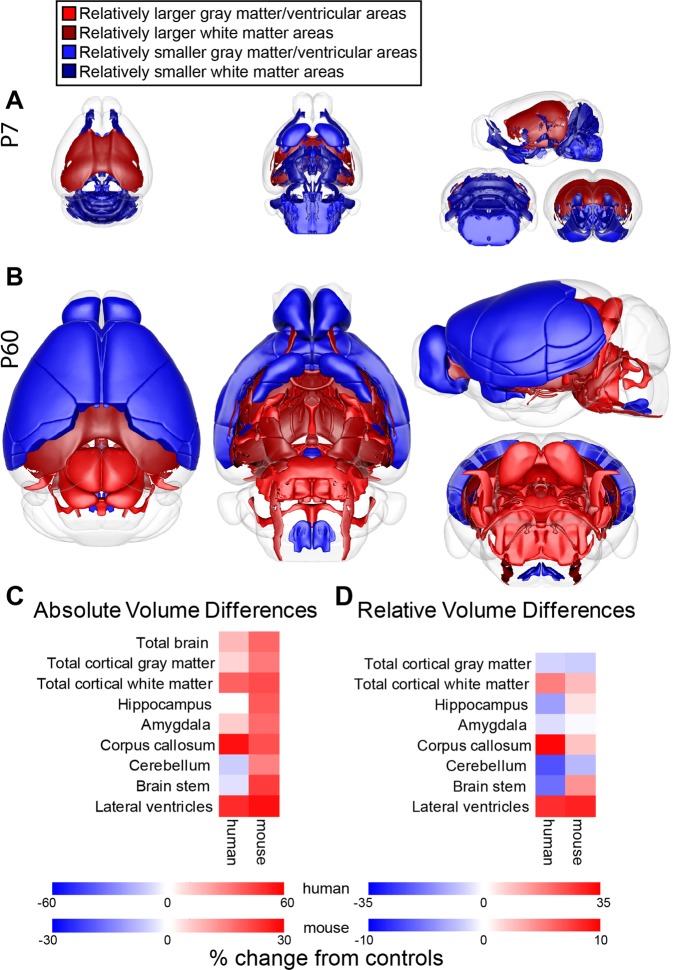
Haploinsufficiency for PTEN is a cause of autism spectrum disorder and brain overgrowth; however, it is not known if PTEN mutations disrupt scaling across brain areas during development. To address this question, we used magnetic resonance imaging to analyze brains of male Pten haploinsufficient (Pten+/-) mice and wild-type littermates during early postnatal development and adulthood. Adult Pten+/- mice display a consistent pattern of abnormal scaling across brain areas, with white matter (WM) areas being particularly affected. This regional and WM enlargement recapitulates structural abnormalities found in individuals with PTEN haploinsufficiency and autism. Early postnatal Pten+/- mice do not display the same pattern, instead exhibiting greater variability across mice and brain regions than controls. This suggests that Pten haploinsufficiency may desynchronize growth across brain regions during early development before stabilizing by maturity. Pten+/- cortical cultures display increased proliferation of glial cell populations, indicating a potential substrate of WM enlargement, and provide a platform for testing candidate therapeutics. Pten haploinsufficiency dysregulates coordinated growth across brain regions during development. This results in abnormally scaled brain areas and associated behavioral deficits, potentially explaining the relationship between PTEN mutations and neurodevelopmental disorders.


Conflict of interest statement

The authors declare that they have no conflict of interest.

Figures

Fig. 1
Fig. 1. Absolute brain volume is larger in Pten+/− mice (black bars; P7: n = 10; P60: n = 9) than Pten+/+ controls (white bars; both ages: n = 10) at postnatal day 7 (P7) and P60, but relative volume changes differ by brain region, including relative enlargement of white matter (WM) and relative reduction in volume of gray matter (GM) at P60.
a Total brain volume at P7 and P60. b Absolute volume of GM and WM at P7 and P60. c Relative volume of GM and WM at P7 and P60. d, e Magnetic resonance imaging fly-through of absolute (d) and relative (e) volume differences in Pten+/− mice at P7 and P60. f Relative volume difference between Pten+/+ and Pten+/− mice [(Pten+/− volume) – (Pten+/+ volume)/(Pten+/+ volume) × 100] at P7 (green) and P60 (blue) in individual GM (gray backfill), WM (white backfill), and ventricular (pale violet backfill) brain regions. Green symbols indicate differences at P7, blue symbols indicate differences at P60. ***p < 0.001, **p < 0.01, *p < 0.05, +p < 0.1. Mean ± SEM.
Fig. 2
Fig. 2. Absolute and relative volumetric changes at postnatal day 7 (P7; Pten+/+n = 10; Pten+/-n = 10) and P60 (Pten+/+n = 10; Pten+/-n = 9) in Pten+/+ (white bars/circles) and Pten+/− (black bars/triangles) mice for brain regions with the largest relative changes in volume.
a–j Gray matter regions in the forebrain (a–f), midbrain (g, h), and hindbrain (i, j). a–f Forebrain regions showed both increases (pre-para subiculum, a; globus pallidus, b and decreases (nucleus accumbens, c; cerebral cortex: frontal lobe, d; olfactory bulbs, e) in relative volume at P60, with the fundus of striatum (f) being the only brain region in which both P7 and P60 Pten+/− mice have relative decreases in volume (approaching but not reaching significance at P60). g, h Midbrain (inferior colliculus, g; superior colliculus, h) regions only showed relative increases in adulthood, and no changes at P7. i, j The largest structure in the hindbrain (pons, i) was relatively increased in adulthood, and the medulla (j) showed a trend to a relative volume decrease at P7. k, l The lateral ventricle was relatively increased at P60 (k), and the third ventricle was relatively decreased at P7 (l). m–o All relatively changed white matter regions in the lateral forebrain bundle (LFB) were relatively increased at P60. At P7, there were decreases in LFB regions (internal capsule, m; cerebral peduncle, n), as well as an increase in the corpus callosum (o; the only brain region with a relative increase in volume in both P7 and P60 Pten+/− mice, although it only reaches the level of a trend at P60). All P7 white matter regions showing differences in the medial forebrain bundle (stria medullaris, p; stria terminalis, q; fornix, r), cranial nerves (anterior commissure, pars anterior, s; posterior commissure, t; optic tract, u), and cerebellar fiber tracts (middle cerebellar peduncle, v; arbor vita of cerebellum, w; inferior cerebellar peduncle, x) were relatively decreased. ***p < 0.001, **p < 0.01, *p < 0.05, +p < 0.1. Mean ± SEM.
Fig. 3
Fig. 3. Pten+/- mice show higher variation than Pten+/+ mice at postnatal day 7 (P7; Pten+/+n = 10; Pten+/−n = 10) but not P60 (Pten+/+n = 10; Pten+/−n = 9), both genotypes show a decrease in variation from P7 to P60, and unbiased clustering of deviation from age group mean shows clear segregation of genotypes at postnatal day 60 but not at P7.
a, b Heatmaps of the coefficient of variation [CV = (standard deviationage+genotype group)/(meanage+genotype group)] for each gray matter brain region across each genotype at P7 (a) and P60 (b). c Average CV across gray matter regions at P7 and P60. d Difference between Pten+/− (black bars) and Pten+/+ (white bars) CVs for gray matter regions at P7 and P60. e, f Heatmaps of the CV for each white matter region across each genotype at P7 (e) and P60 (f). g Average CV across white matter regions at P7 and P60. h Difference between Pten+/− and Pten+/+ CVs for white matter regions at P7 and P60. i Average CV across all brain regions is higher in Pten+/− mice at P7 than Pten+/− mice at P60, and both Pten+/+ and Pten+/− mice show lower CVs at P60 than P7. j The difference between genotypes in average CV across all brain regions is lower at P60 than at P7. k–n Heatmaps of the deviation from age group mean, calculated as z-score [z-score = (volumemouse – mean volumeall P7 mice)/(standard deviationall P7 mice)]. k, l No clustering by genotype in P7 mice for gray matter (k) or white matter (l) brain regions. m, n P60 mice do cluster by genotype for for gray matter (m) and white matter (n) brain regions. Left dendrograms indicate unbiased clustering of brain regions. Top dendrogram indicates unbiased clustering of individual mice (white, Pten+/+; black, Pten+/−). ***p < 0.001, **p < 0.01. Mean ± SEM.
Fig. 4
Fig. 4. White matter tracts are larger in adult Pten+/− mice, and Pten+/− mice show excess glia in vivo at postnatal day 7 (P7) and increased glial proliferation in culture.
a Representative eriochrome cyanine R.-stained coronal sections from Pten+/+ (top) and Pten+/− (bottom) adults. b, c Pten+/− mice (black bars; n = 4) have wider corpus callosa than Pten+/+ mice (white bars; n = 3), measured at the midline. d, e The anterior commissure was not significantly wider in Pten+/− mice when measured at the midline. f Pten+/− mice have an enlarged fornix area. *p < 0.05. Mean ± SEM (gray shading and error bars). Scale bars, 1 mm. gj) Isotropic fractionator and flow cytometry results in P7 Pten+/+ (white bars) and Pten+/− (black bars) mice. g Percentage of nuclei positive for neuronal marker NeuN. h Number of NeuN+ nuclei. i Number of NeuN nuclei. j Percentage of nuclei positive for oligodendrocyte lineage marker Olig2. kp Results of 5-bromo-2′deoxyuridine (BrdU) pulse-chase in primary cortical culture at 8 days-in-vitro (DIV8; k, l) or DIV12 (mp). k, l Representative images (k) and quantification (l) of Ki67 and BrdU immunocytochemistry in cultures treated with vehicle, 10 μM PI3K inhibitor LY294002 (diagonal line pattern), or 10 nM PTEN-Long (crosshatched line pattern). m, n Representative images (m) and quantification (n) of Olig2 and BrdU immunocytochemistry in cultures treated with vehicle, 10 μM LY294002, or 10 nM PTEN-Long. o, p Representative images (o) and quantification (p) of immunocytochemistry for BrdU and astrocyte marker Sox9 in cultures treated with vehicle, 10 μM LY294002, or 10 nM PTEN-Long. All n = 3 biological replicates. ***p < 0.001, **p < 0.01, *p < 0.05, + p < 0.1. Mean ± SEM. Scale bars, 50 μm.
Fig. 5
Fig. 5. Pten+/− mice show similar patterns of overgrowth to humans with autism spectrum disorder and PTEN mutations (PTEN-ASD).
a, b Overview of relative volume differences in P7 (a) and P60 (b) mice. Red, relatively larger gray matter and ventricular areas; dark red, relatively larger white matter areas; blue, relatively smaller gray matter and ventricular areas; dark blue, relatively smaller white matter areas. c, d Comparison of absolute (c) and relative (d) volume differences from controls in Pten+/− mice and PTEN-ASD humans. Human data is from Frazier et al.. For mice, total cortical gray matter includes: entorhinal cortex and frontal, occipital, and parieto-temporal lobes; hippocampus includes: dentate gyrus of hippocampus, stratum granulosum of hippocampus, pre-para subiculum, and hippocampus; brain stem includes: medulla, pons, pontine nucleus, and inferior and superior olivary complexes; and cerebellum is cerebellar cortex. Color intensity indicates the magnitude of the percent increase (red) or decrease (blue) from controls.

References

    1. Baio J, et al. Prevalence of autism spectrum disorder among children aged 8 years — autism and developmental disabilities monitoring network, 11 sites, United States, 2014. MMWR Surveill. Summ. 2018;67:1–23. doi: 10.15585/mmwr.ss6706a1. - DOI - PMC - PubMed
    1. American Psychiatric Association. Diagnostic and Statistical Manual of Mental Disorders: DSM-5 5th edn (American Psychiatric Association, Arlington, VA, 2013).
    1. Albores-Gallo L, Fritsche-Garcia L, Miranda-Aguirre AP, Avila-Acosta M. Brief report: macrocephaly phenotype and psychiatric comorbidity in a clinical sample of mexican children and adolescents with autism spectrum disorders. J. Autism Dev. Disord. 2017;47:2911–2917. doi: 10.1007/s10803-017-3175-4. - DOI - PubMed
    1. Sacco R, Gabriele S, Persico AM. Head circumference and brain size in autism spectrum disorder: a systematic review and meta-analysis. Psychiatry Res. 2015;234:239–251. doi: 10.1016/j.pscychresns.2015.08.016. - DOI - PubMed
    1. Lainhart JE, et al. Head circumference and height in autism: a study by the Collaborative Program of Excellence in Autism. Am. J. Med. Genet. A. 2006;140:2257–2274. doi: 10.1002/ajmg.a.31465. - DOI - PMC - PubMed

Publication types