. 2019 Dec 5;10(1):5566.
doi: 10.1038/s41467-019-13485-8.

Aurora-A mediated phosphorylation of LDHB promotes glycolysis and tumor progression by relieving the substrate-inhibition effect

Affiliations

Aurora-A mediated phosphorylation of LDHB promotes glycolysis and tumor progression by relieving the substrate-inhibition effect

Aoxing Cheng et al. Nat Commun. .

Abstract

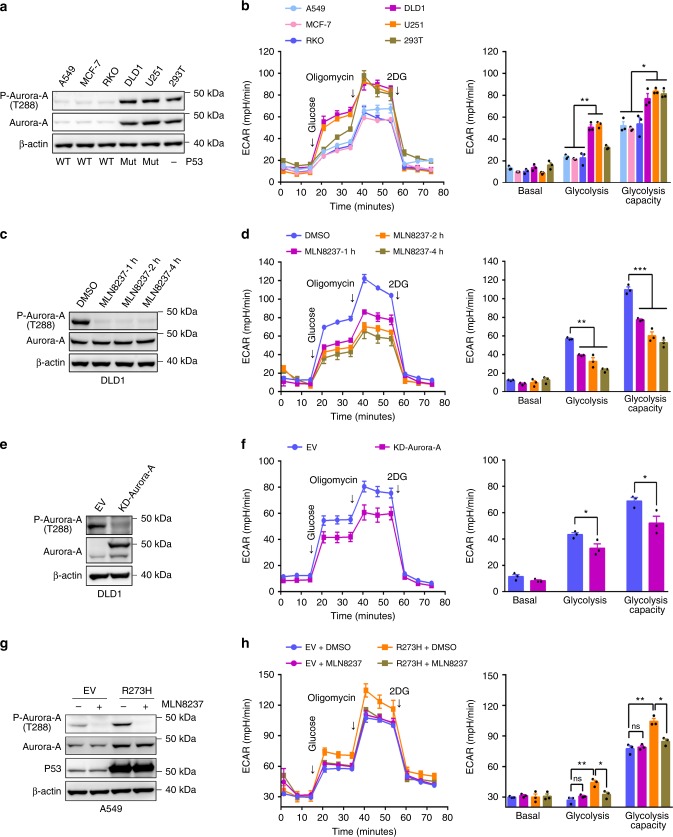
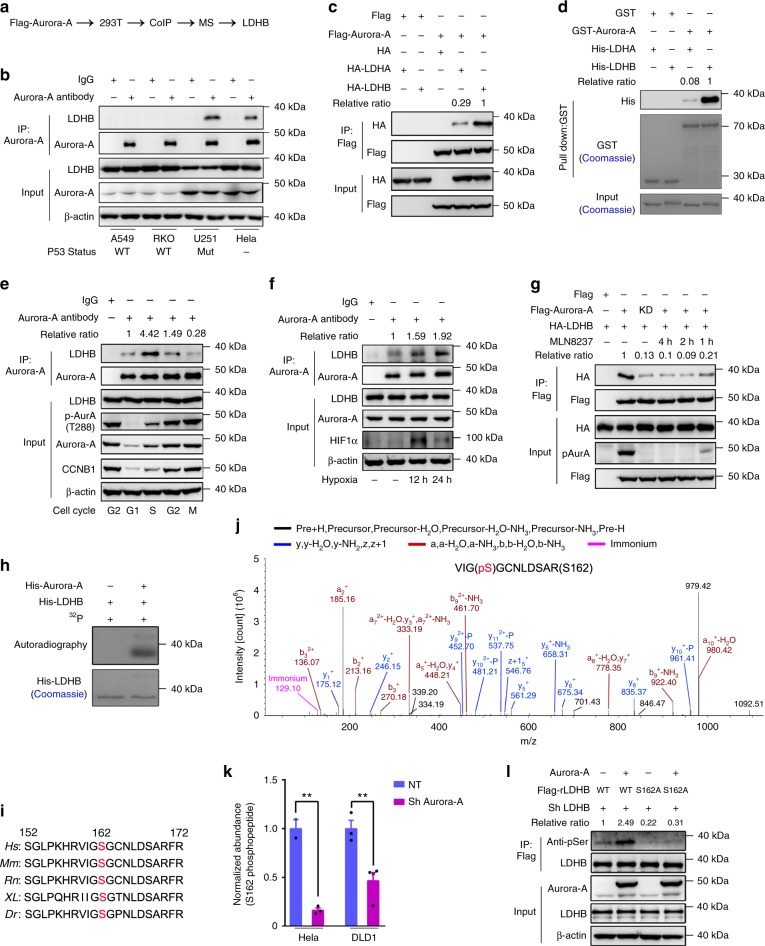
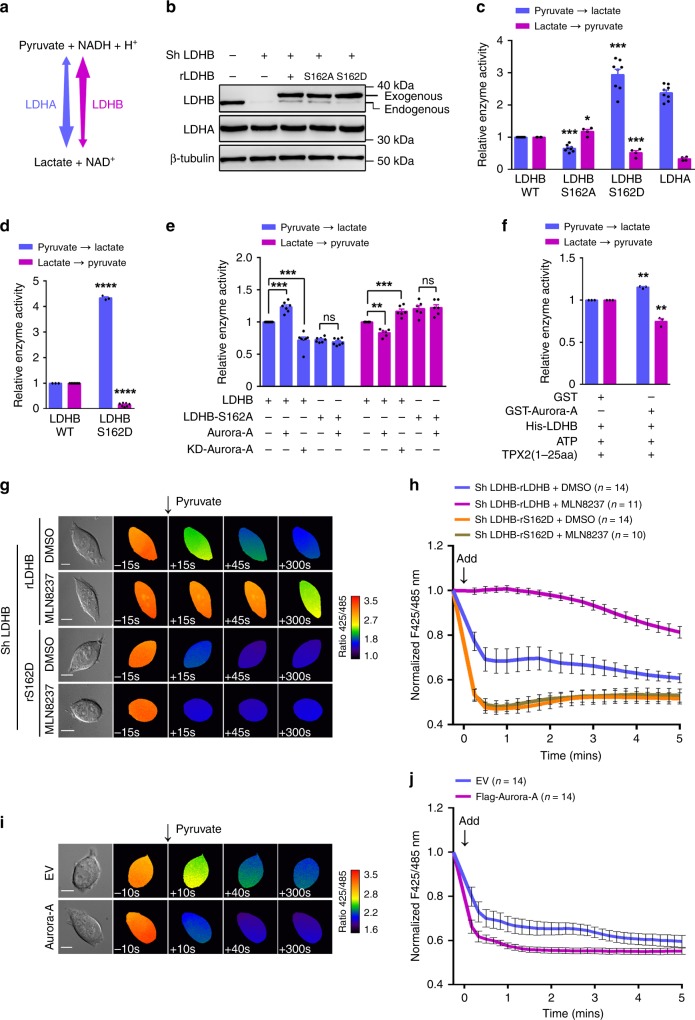
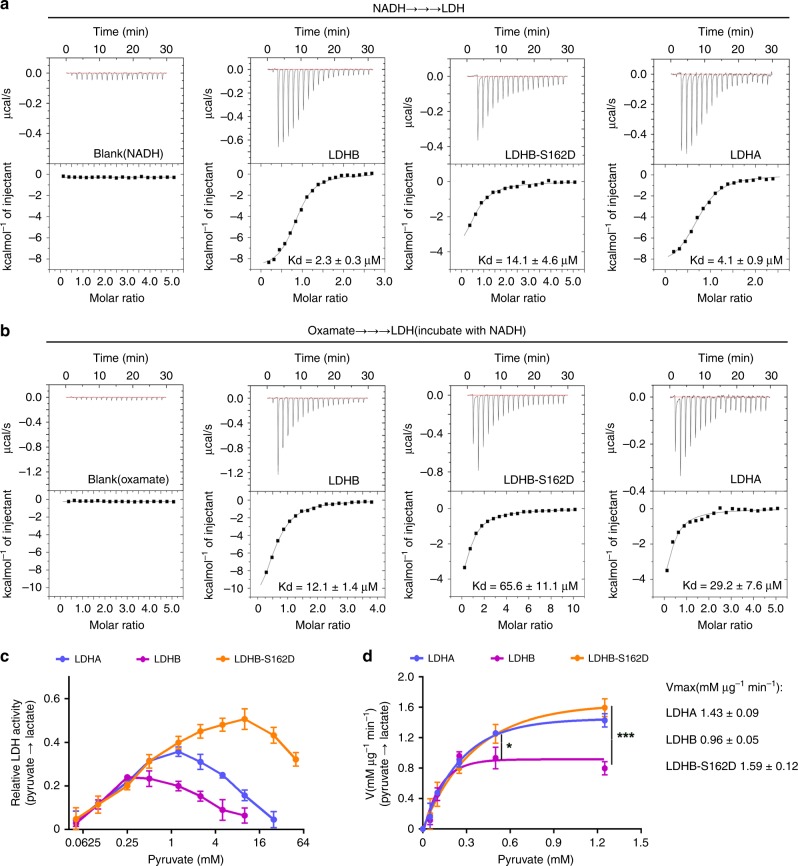
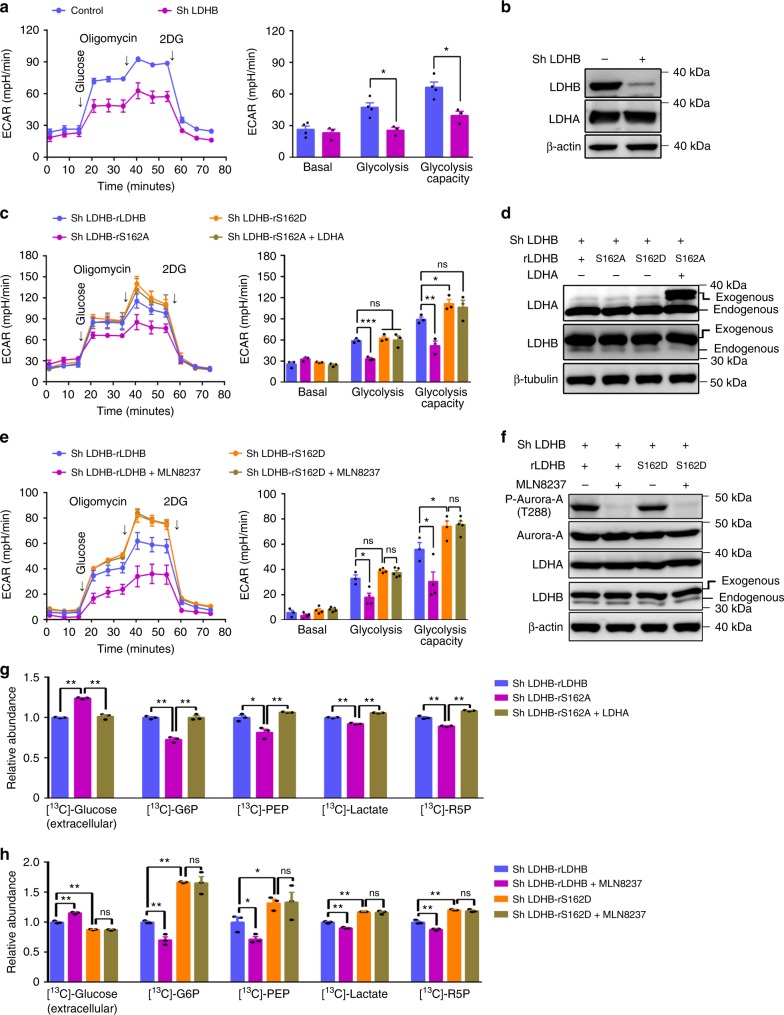
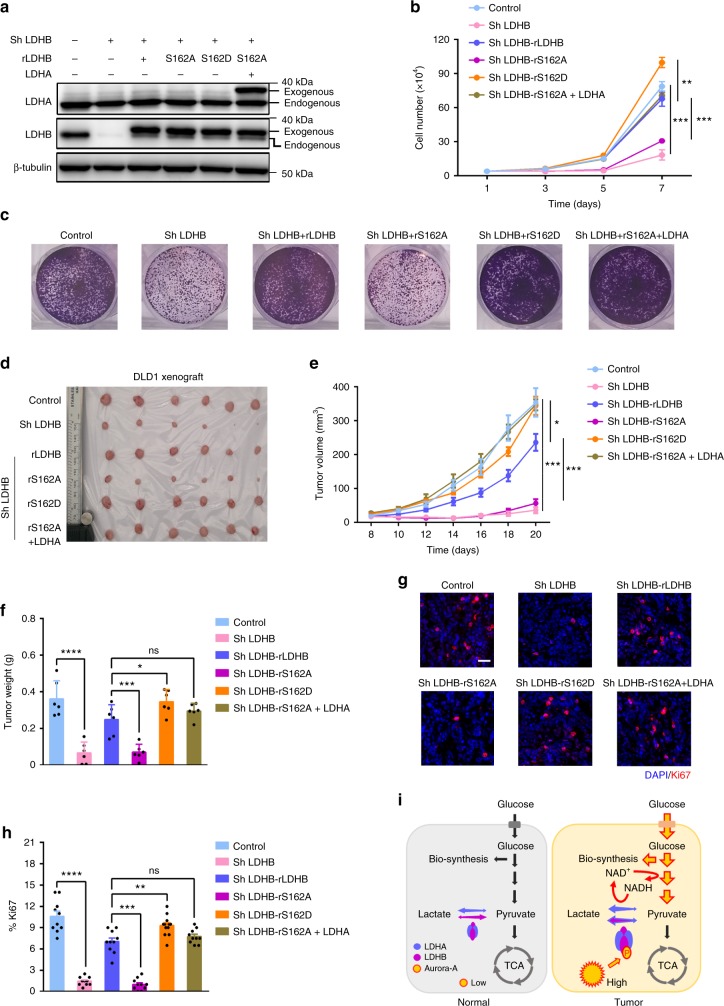
Overexpressed Aurora-A kinase promotes tumor growth through various pathways, but whether Aurora-A is also involved in metabolic reprogramming-mediated cancer progression remains unknown. Here, we report that Aurora-A directly interacts with and phosphorylates lactate dehydrogenase B (LDHB), a subunit of the tetrameric enzyme LDH that catalyzes the interconversion between pyruvate and lactate. Aurora-A-mediated phosphorylation of LDHB serine 162 significantly increases its activity in reducing pyruvate to lactate, which efficiently promotes NAD+ regeneration, glycolytic flux, lactate production and bio-synthesis with glycolytic intermediates. Mechanistically, LDHB serine 162 phosphorylation relieves its substrate inhibition effect by pyruvate, resulting in remarkable elevation in the conversions of pyruvate and NADH to lactate and NAD+. Blocking S162 phosphorylation by expression of a LDHB-S162A mutant inhibited glycolysis and tumor growth in cancer cells and xenograft models. This study uncovers a function of Aurora-A in glycolytic modulation and a mechanism through which LDHB directly contributes to the Warburg effect.


Conflict of interest statement

The authors declare no competing interests.

Figures

Fig. 1
Fig. 1
High level of Aurora-A promotes glycolysis in malignant cancer cells. a In human cancer cell lines A549, MCF-7, RKO, DLD1, U251, and 293 T, the expressions and activity of Aurora-A kinase were examined. The status of p53 (WT: wild-type, Mut: mutation, -: inactivation) was labelled at the bottom of each lane. b The glycolytic rates were analyzed by standard Seahorse assay. The extracellular acidification rate (ECAR) over time (left panel) and ECAR in different stages of the measurement (right panel) were shown. c Aurora-A kinase activity was inhibited by selective inhibitor MLN8237 (200 nM, for 1, 2, and 4 h) in DLD1 cells. The kinase activity of Aurora-A was tested. d The glycolytic flux was investigated by seahorse assay in control and Aurora-A inhibition cells in c. The ECAR over time (left panel) and ECAR in different stages of the measurement (right panel) were shown. e Empty Vector (EV) and kinase-dead (KD, D274A) Aurora-A were transfected in DLD1 cells, then the levels of Aurora-A and p-Aurora-A were examined. f The ECAR of cells in e were measured by seahorse assay. g Empty Vector (EV) and p53 R273H mutant were transfected in A549 cells, the levels of Aurora-A, p-Aurora-A and p53 were examined. h The ECAR of cells in g were measured by seahorse assay. Cells were treated with DMSO or MLN8237 for 4 h before assay. The error bar in panels b, d, f, h represents the standard error of mean (SEM), n = 3 independent experiments. Source data are provided as a Source Data files. (Student’s t-test *p < 0.05, **p < 0.01, ***p < 0.001, ns not significant).
Fig. 2
Fig. 2
Aurora-A directly binds and phosphorylates LDHB at serine 162. a Schematic diagram of the procedure to seek for Aurora-A associated proteins in glycolytic regulation. Identified proteins were listed in Supplementary Table 1. b Co-immune-precipitation (Co-IP) was conducted in A549, RKO, U251 and Hela cells. The status of p53 was indicated at the bottom of each lane. c FLAG-tagged Aurora-A was co-expressed with HA-tagged LDHA/B in 293 T cells. Co-IP was conducted with FLAG-beads followed by WB. d GST pull-down assay was performed with GST-Aurora-A and His-LDHA/B, followed by Coomassie blue staining and WB. e HeLa cells were synchronized at different cell cycle stages. Co-IP was conducted with Aurora-A antibody followed by WB. Relative ratio means the binding affinity between LDHB and Aurora-A. f DLD1 was cultured in hypoxic incubator for 12 and 24 h. Co-IP was conducted with Aurora-A antibody. g FLAG-tagged Aurora-A or KD-Aurora-A were co-expressed with HA-tagged LDHB in 293 T cells. Aurora-A was inhibited by MLN8237. Co-IP was conducted with FLAG-beads. h Recombinant His-Aurora-A and His-LDHB were incubated with 32p labeled ATP followed by SDS-PAGE. The gel was subjected to autoradiography and Coomassie blue staining. i Alignment of amino acid sequences containing serine 162 of LDHB from several model species. Dr (Danio rerio); XL (Xenopus laevis); Rn (Rattus norvegicus); Mm (Mus musculus); Hs (Homo Sapiens). j Mass spectrometry data showed serine 162 of LDHB was phosphorylated in cultured tumor cells. A tryptic fragment at m/z 636.26813 (z = +2), matched to the charged peptide VIGS(ph)GCNLDSAR. k Aurora-A was knocked down in DLD1 and Hela cells. The endogenous LDHB was isolated and subjected for MS analyses. The relative abundance of S162 phosphopeptide was quantified. l Endogenous LDHB was knocked down in DLD1 cells, and shRNA-resistant FLAG-LDHB WT, S162A mutant and Aurora-A were expressed as indicated. LDHB was purified with FLAG beads. The error bar in panels k represents the standard error of mean (SEM), n = 2 independent experiments for Hela NT (non-targeting), n = 3 for Hela Sh Aurora-A and DLD1 NT and n = 4 for DLD1 sh Aurora-A. Source data are provided as a Source Data files. (Student’s t-test **p < 0.01).
Fig. 3
Fig. 3
Phosphorylation of LDHB S162 alters its enzymatic activities. a Diagram of the bi-directional reactions catalyzed by tetrameric LDH, comprising LDHA and LDHB. b In DLD1 cells, the endogenous LDHB was replaced by shRNA-resistant and FLAG-tagged LDHB WT or S162A/D mutants. The expressions of LDHA/B were examined by WB. c FLAG-tagged WT, S162A, S162D of LDHB and LDHA were purified by IP and subjected to measure the bi-directional activities. d His-tagged LDHB WT and S162D were expressed in E. coli. The purified proteins were subjected to measure the bi-directional activities. e WT-Aurora-A or KD-Aurora-A was expressed in the DLD1 cells tested in b, FLAG-tagged proteins were purified by IP and subjected to measure the bi-directional activities. f His-tagged LDHB was incubated with ATP, TPX2(1–25aa) and GST or GST-Aurora-A. Bi-directional activities of LDHB were measured. g The plasmid of NADH/NAD+ sensor SoNar was transfected into DLD1 cells used in b. Cells were subjected to live cell imaging. Two channels of emission signals were collected near-simultaneously at 15 s intervals before and after addition of pyruvate (5 mM). The differential interference contrast (DIC) images of the cells (left) and the ratio images of F425/485 were shown. Aurora-A was inhibited by MLN8237 (200 nM, 6 h) before imaging. Scale bar, 10 μm. h Quantitation of NADH/NAD+ ratio (presented as F425/485) in g. Arrow indicates the addition of pyruvate at time 0. i NADH/NAD+ ratios were measured in empty vector (EV) and Aurora-A overexpressing cells at 10 s intervals. DIC and ratio images of F425/485 were shown. Scale bar, 10 μm. j Quantitation of NADH/NAD+ ratio in i. The error bar in panels c, d, e, f represents the standard error of mean(SEM), n = 4 independent experiments in panels c, 3 in panels d, f and 7 in panels e. Source data are provided as a Source Data files. (Student’s t-test *p < 0.05, **p < 0.01, ***p < 0.001, ns not significant).
Fig. 4
Fig. 4
The substrate-inhibition effect was relieved by LDHB-S162D. a The dissociation constant of NADH for LDH was assessed by isothermal titration calorimetry (ITC) assay. ITC results were shown for interactions of NADH with LDHB, LDHB-S162D, and LDHA. The Kd values were labeled at the bottom. b ITC results were shown for oxamate interactions with LDHB-NADH complex, LDHB-S162D-NADH complex and LDHA-NADH complex. The Kd values were labeled at the bottom. c The catalytic activity (Pyruvate to lactate) of LDHA, LDHB, and LDHB S162D were measured at different concentrations of pyruvate. The relative enzyme activity for LDHB, LDHB-S162D, and LDHA were plotted against the concentrations of pyruvate (logarithm of 2). d The catalytic rates of the forward reactions for LDHA, LDHB and LDHB S162D were plotted over physiological concentrations of pyruvate. Student t-test were performed between the rate of LDHB and LDHB S162D at 0.5 and 1.25 mM pyruvate. Curve fitting was conducted using Prism software. The error bar in panels a, b, c, d represents the standard error of mean(SEM), n = 6 independent experiments for LDHB, 7 for LDHB-S162D, 4 for LDHA in panels a, n = 4 independent experiments for LDHB, 6 for LDHB-S162D, 4 for LDHA in panels b, n = 4 independent experiments for LDHB, 3 for LDHB-S162D, 4 for LDHA in panels c and d. Source data are provided as a Source Data files. (Student’s t-test *p < 0.05, **p < 0.01, ***p < 0.001, ns not significant).
Fig. 5
Fig. 5
Phosphorylation of LDHB S162 promotes glycolysis. a In DLD1 cells, LDHB was knocked down by sh RNA. Seahorse assays were performed to evaluate the glycolytic conditions. ECAR over time (left panel) and ECAR in different stages of the measurement (right panel) were shown. b The expression of LDHA and LDHB in cells used in a were examined by WB. c In DLD1 cells, endogenous LDHB was knocked down, then shRNA-resistant WT LDHB, LDHB S162A/D, and LDHA were expressed. Seahorse assays were performed in these cells to evaluate the glycolytic flux. ECAR over time (left panel) and ECAR in different stages of the measurement (right panel) were shown. d The expression of LDHA/B in cells used in c were examined by WB. e In DLD1 cells used in c, Aurora-A was inhibited by MLN8237 (200 nM, 4 h). Seahorse assays were conducted. ECAR over time (left panel) and ECAR in different stages of the measurement (right panel) were shown. f The expression of LDHA/B and the activity of Aurora-A kinase in cells used in e were examined by WB. g The glycolytic tracing assay was performed with 13C-labeled glucose in cells used in c. The relative abundance of the 13C-labeled glycolytic metabolites: Glucose-6-phosphate (G6P), phosphoenolpyruvate (PEP), lactate and ribose-5-phosphate (R5P) were shown. h The glycolytic flux assay was performed with 13C-labeled glucose in cells used in e. MLN8237 (200 nM, 24 h) was used to inhibit Aurora-A activity. The relative abundance of the 13C-labeled glycolytic metabolites were shown. The error bar in panels a, c, e, g, h represents the standard deviation (SD), n = 3 biologically independent samples. Source data are provided as a Source Data files. (Student’s t-test *p < 0.05, **p < 0.01, ***p < 0.001, ns not significant).
Fig. 6
Fig. 6
Phosphorylation of LDHB S162 promotes tumor progression. a In DLD1 cells endogenous LDHB was knocked down, then shRNA-resistant wild-type LDHB, LDHB S162A/D, and LDHA were expressed. The expression levels of LDHA/B were examined by WB. b Cell proliferation assay was conducted with the DLD1 cells tested in a. The growth curves were plotted over seven days. c Colony formation assay was conducted in DLD1 cells used in a. Cells were fixed after cultured for 10 days. Crystal violet staining of the cells were shown. d DLD1 cells tested in a were inoculated in nude mice. Xenograft tumors at the endpoint were collected and shown. e The growth curve of the tumors in d. f The weight of tumors at the endpoint in d. g Immuno-fluorescence staining of Ki67, a proliferation marker, in the sections of xenograft tumors in d, Scale bar, 50 μm. h Statistics of the index of the Ki67-positive cells in g. i A working model summarizes the major function of Aurora-A-LDHB pathway in the regulation of Warburg effect in cancer cells. The error bar in panels b represents the standard error of mean (SEM), n = 3 independent experiments. The error bar in panels e, f, h represents the standard deviation (SD), n = 6 biologically independent samples in panels e, f and n = 10 in panel h. Source data are provided as a Source Data files. (Student’s t-test *p < 0.05, **p < 0.01, ***p < 0.001, ns not significant).

References

    1. Hanahan D, Weinberg RA. Hallmarks of cancer: the next generation. Cell. 2011;144:646–674. doi: 10.1016/j.cell.2011.02.013. - DOI - PubMed
    1. Pavlova NN, Thompson CB. The emerging hallmarks of cancer metabolism. Cell Metab. 2016;23:27–47. doi: 10.1016/j.cmet.2015.12.006. - DOI - PMC - PubMed
    1. Doherty JR, Cleveland JL. Targeting lactate metabolism for cancer therapeutics. J. Clin. Invest. 2013;123:3685–3692. doi: 10.1172/JCI69741. - DOI - PMC - PubMed
    1. Vander Heiden MG, Cantley LC, Thompson CB. Understanding the Warburg effect: the metabolic requirements of cell proliferation. Science. 2009;324:1029–1033. doi: 10.1126/science.1160809. - DOI - PMC - PubMed
    1. Warburg O. On the origin of cancer cells. Science. 1956;123:309–314. doi: 10.1126/science.123.3191.309. - DOI - PubMed

Publication types

MeSH terms