. 2019 Dec 5;10(1):5568.
doi: 10.1038/s41467-019-13599-z.

Emotionotopy in the human right temporo-parietal cortex

Affiliations

Emotionotopy in the human right temporo-parietal cortex

Giada Lettieri et al. Nat Commun. .

Abstract

Humans use emotions to decipher complex cascades of internal events. However, which mechanisms link descriptions of affective states to brain activity is unclear, with evidence supporting either local or distributed processing. A biologically favorable alternative is provided by the notion of gradient, which postulates the isomorphism between functional representations of stimulus features and cortical distance. Here, we use fMRI activity evoked by an emotionally charged movie and continuous ratings of the perceived emotion intensity to reveal the topographic organization of affective states. Results show that three orthogonal and spatially overlapping gradients encode the polarity, complexity and intensity of emotional experiences in right temporo-parietal territories. The spatial arrangement of these gradients allows the brain to map a variety of affective states within a single patch of cortex. As this organization resembles how sensory regions represent psychophysical properties (e.g., retinotopy), we propose emotionotopy as a principle of emotion coding.


Conflict of interest statement

The authors declare no competing interests.

Figures

Fig. 1
Fig. 1. Emotion ratings.
a Violin plots show the agreement between subjects (Spearman’s ρ coefficient) of the six basic emotions. White circular markers indicate mean correlation across subjects and black bars denote 25th and 75th percentile of the distribution (n = 66 subject pairings). Gray shaded area represents the null distribution of behavioral ratings and dashed lines the mean and 95th percentile of the null distribution. b Correlation matrix showing Spearman’s ρ values for pairings of basic emotions. c Principal component analysis: loadings of the six principal components. Explained variance was 45% for polarity, 24% for complexity and 16% for intensity. d Violin plots show the agreement between subjects (Spearman’s ρ coefficient) of the six principal components. White circular markers indicate mean correlation across subjects and black bars denote 25th and 75th percentile of the distribution (n = 66 subject pairings). Gray shaded area represents the null distribution of behavioral ratings and dashed lines the mean and 95th percentile of the null distribution. HA happiness, SU surprise, FE fear, SA sadness, AN anger, DI disgust, PC principal component, PO polarity, CO complexity, IN intensity.
Fig. 2
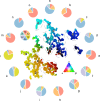
Fig. 2. Richness of the emotional experience.
Results of the dimensionality reduction (t-SNE) and clustering analyses (k-means) on the group-averaged behavioral ratings showing the existence of 15 distinct affective states throughout the movie. Each element represents a specific timepoint in the movie and the distance between elements depends on the statistical similarity of emotion ratings. Element color reflects the scores of the polarity and complexity dimensions: positive (+) and negative (−) events (i.e., polarity) are associated, respectively, to the red and blue channels, whereas complexity (Ψ) scores modulate the green channel. Pie charts show the relative contribution of the six basic emotions to each of the 15 identified clusters. Combinations of distinct emotions likely express secondary affective states, as ambivalence (i.e., cluster j depicting movie scenes in which happiness and sadness are simultaneously experienced) or resentment (i.e., cluster i representing movie segments in which a mixture of sadness, anger and disgust is perceived). Of note, this evidence is also supported by single-subject reports, in which the 38% (SE: ±2.3%) of timepoints were associated to a single emotion, the 29% (SE: ±3.5%) to two basic emotions and the 6% (SE: ±1.4%) to the concurrent experience of three distinct emotions. HA happiness, SU surprise, FE fear, SA sadness, AN anger, DI disgust.
Fig. 3
Fig. 3. Encoding of emotion ratings.
a Brain regions encoding emotion ratings corrected for multiple comparisons using the False Discovery Rate method (q < 0.01; voxelwise encoding permutation test; n = 3595 timepoints). b Peak of association between emotion ratings and brain activity (purple sphere) and reverse inference peak for the term TPJ as reported in the NeuroSynth database (yellow sphere). Coordinates represent the center of gravity in MNI152 space. c β coefficients associated to basic emotions in a spherical region of interest (27 mm radius) located at the reverse inference peak for the term TPJ. Maps for emotions not consistent across all the subjects (i.e., surprise and disgust) are faded. d β coefficients associated to emotion dimensions in a spherical region of interest (27 mm radius) located at the reverse inference peak for the term TPJ. Maps for components not consistent across all the subjects (i.e., PC4, PC5 and PC6) are faded. IFG inferior frontal gyrus, rMFG rostral middle frontal gyrus, mSFG medial superior frontal gyrus, preCS precentral sulcus, pSTS/TPJ posterior part of the superior temporal sulcus/temporo-parietal junction, MOG middle occipital gyrus, pMTG posterior middle temporal gyrus, SMG supramarginal gyrus, LatS lateral sulcus, STS superior temporal sulcus.
Fig. 4
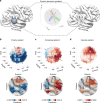
Fig. 4. Emotion gradients in right TPJ.
a We revealed three orthogonal and spatially overlapping emotion dimension gradients (polarity, complexity and intensity) within a region of interest located at the reverse inference peak for the term TPJ (15 mm radius sphere). Symmetry axis of the region of interest represents the main direction of the three gradients. b β coefficients of the polarity dimension are mapped in an inferior to superior direction. c β coefficients of the complexity dimension are mapped in a posterior to anterior direction. d β coefficients of the intensity dimension are mapped in an inferior to superior direction. For single-subjects results, please refer to Supplementary Fig. 3. Lowermost row depicts the arrangement of the emotion dimension gradients in surface space. CoG center of gravity, R STS right superior temporal sulcus.
Fig. 5
Fig. 5. Characterization of emotion dimension gradients in right TPJ.
a Right TPJ hemodynamic activity related to the scores below and above the 50th percentile for polarity. b Right TPJ hemodynamic activity related to the scores below and above the 50th percentile for complexity. c Since intensity is not bipolar as the other two components (i.e., scores ranged from ~0 to positive values only), for this dimension we mapped the average TPJ activity above the 75th percentile and within 50th and 75th percentile. PC principal component.
Fig. 6
Fig. 6. Population receptive field estimates in right TPJ.
Response selectivity maps of right TPJ voxels for a polarity, b complexity and c intensity. Preferred responses of distinct populations of voxels were obtained using non-negative matrix factorization (Supplementary Fig. 9). Components explaining at least 5% of the variance were plotted as a tuning curve (lowermost row) after averaging all the possible tuning width values for each emotion dimension score. The maps of voxel selectivity were consistent with the topography obtained from the original gradient estimation for the three emotion dimensions (polarity: ρ = 0.547, p-value = 0.001; complexity: ρ = 0.560, p-value < 0.001 and intensity: ρ = 0.596, p-value < 0.001; permutation test; n = 428 voxels).

Similar articles

Cited by

References

    1. Panksepp J. Toward a general psychobiological theory of emotions. Behav. Brain Sci. 1982;5:407–422. doi: 10.1017/S0140525X00012759. - DOI
    1. Kreibig SD. Autonomic nervous system activity in emotion: a review. Biol. Psychol. 2010;84:394–421. doi: 10.1016/j.biopsycho.2010.03.010. - DOI - PubMed
    1. Stephens CL, Christie IC, Friedman BH. Autonomic specificity of basic emotions: evidence from pattern classification and cluster analysis. Biol. Psychol. 2010;84:463–473. doi: 10.1016/j.biopsycho.2010.03.014. - DOI - PubMed
    1. Nummenmaa L, Glerean E, Hari R, Hietanen JK. Bodily maps of emotions. Proc. Natl Acad. Sci. USA. 2014;111:646–651. doi: 10.1073/pnas.1321664111. - DOI - PMC - PubMed
    1. Ekman P. An argument for basic emotions. Cogn. Emot. 1992;6:169–200. doi: 10.1080/02699939208411068. - DOI

Publication types