. 2019 Dec 5;9(1):18465.
doi: 10.1038/s41598-019-54570-8.

Unpacking the aggregation-oligomerization-fibrillization process of naturally-occurring hIAPP amyloid oligomers isolated directly from sera of children with obesity or diabetes mellitus

Affiliations

Unpacking the aggregation-oligomerization-fibrillization process of naturally-occurring hIAPP amyloid oligomers isolated directly from sera of children with obesity or diabetes mellitus

Myriam M Altamirano-Bustamante et al. Sci Rep. .

Abstract

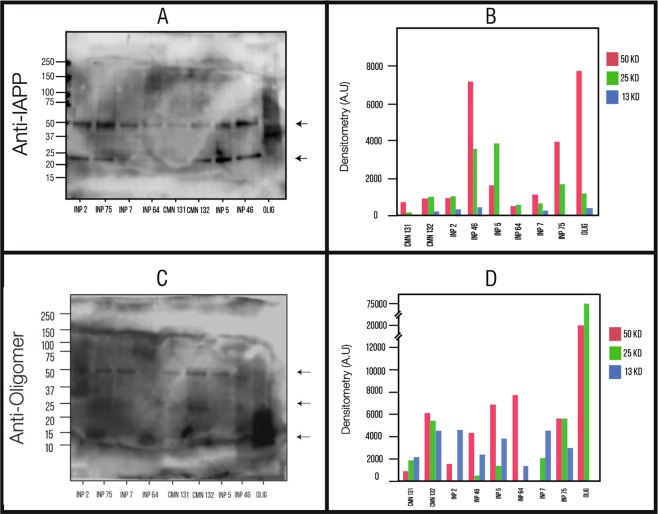
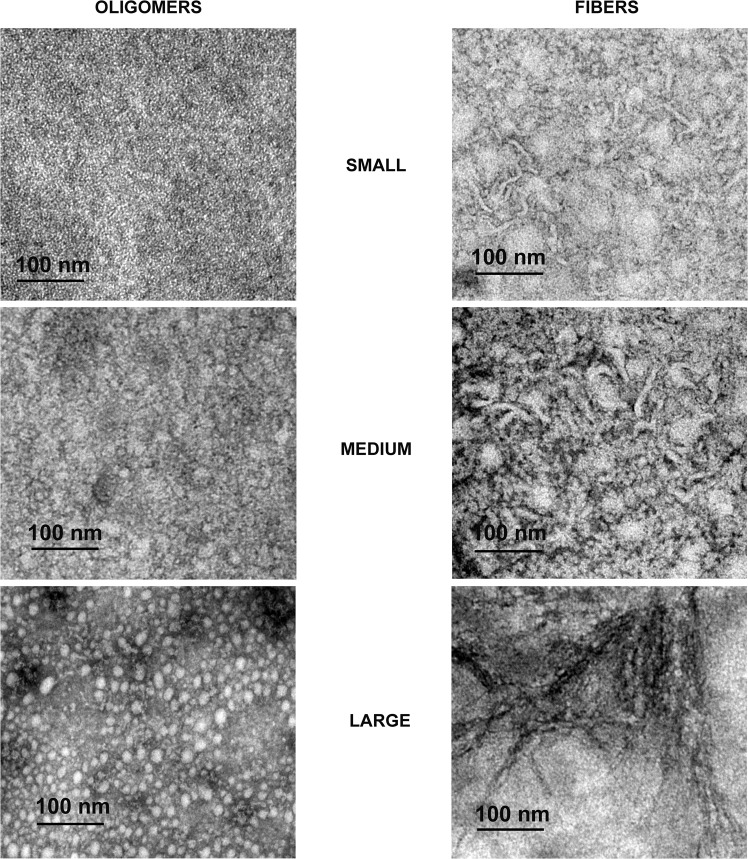
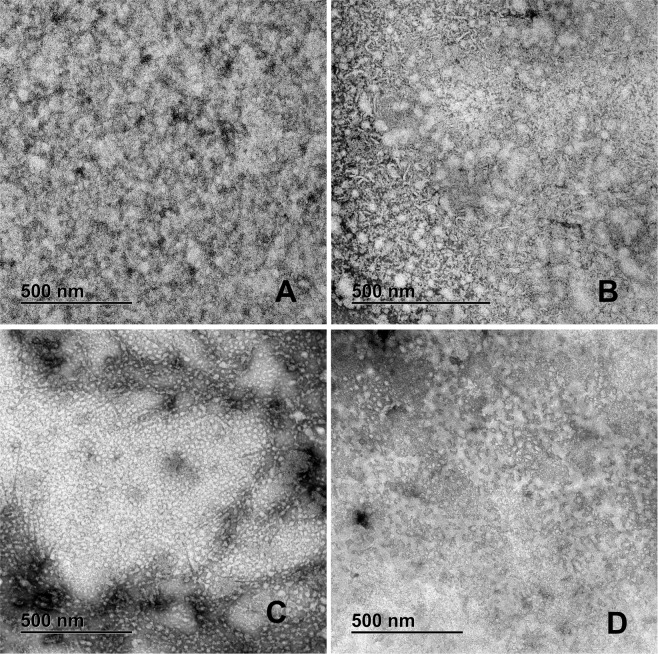
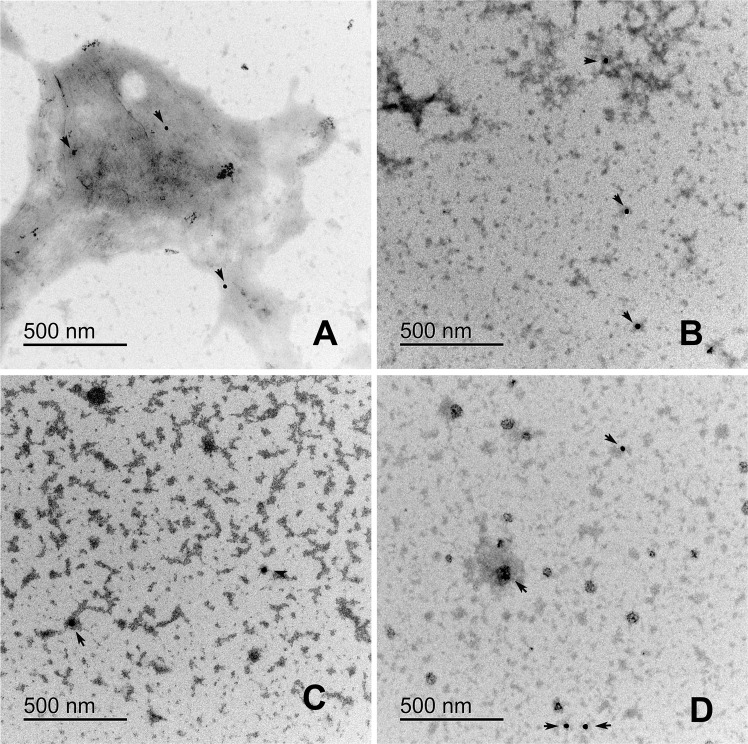
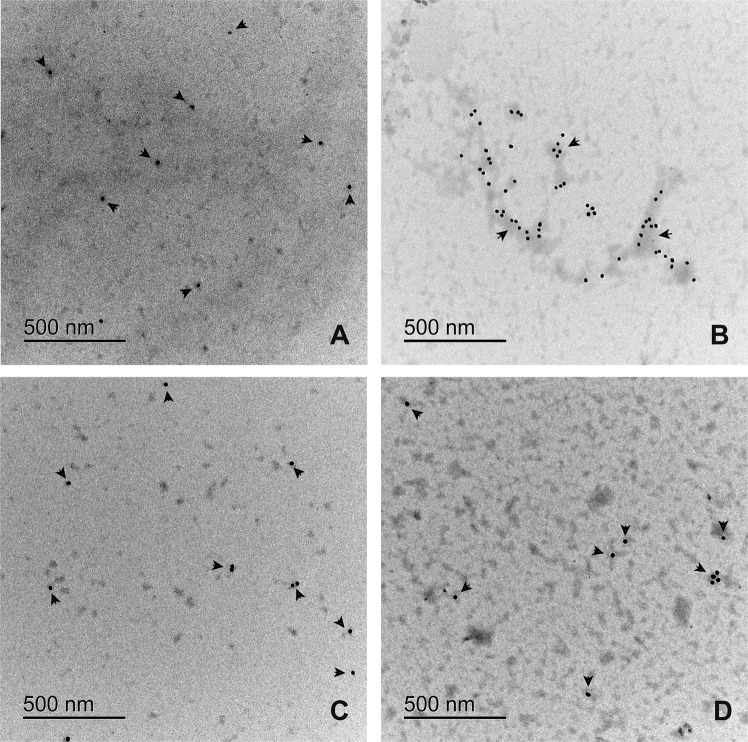
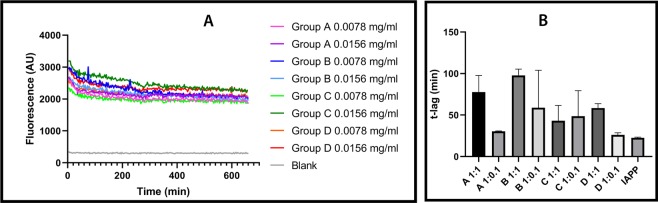
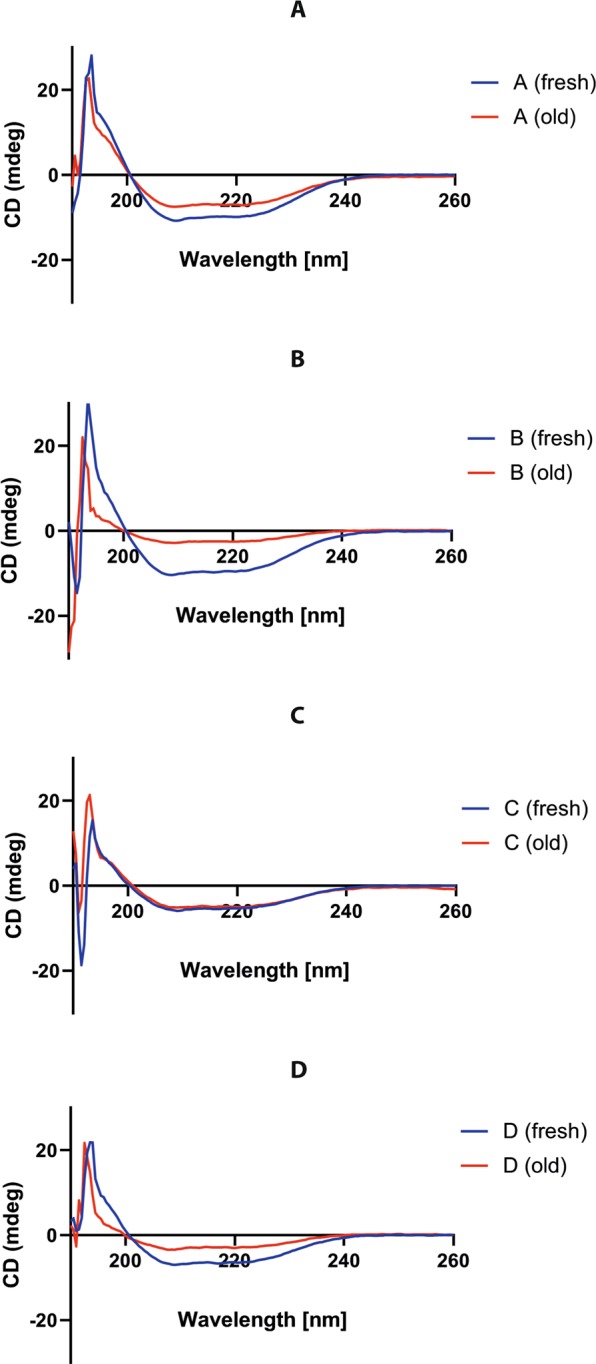
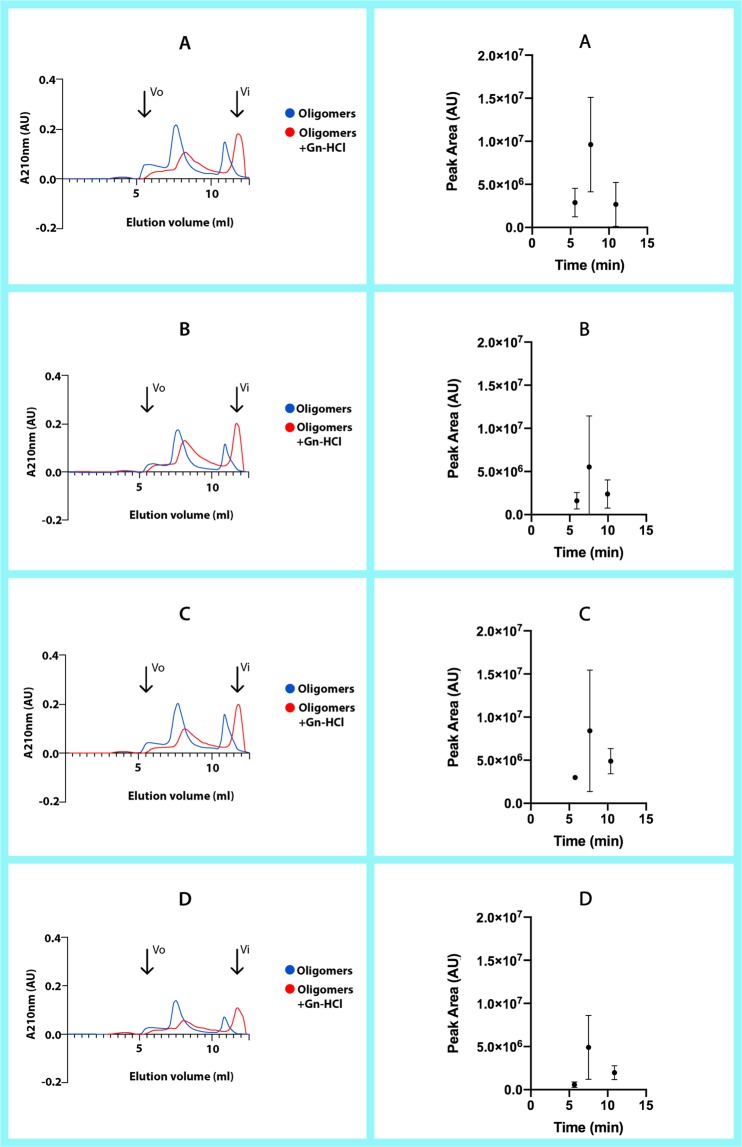
The formation of amyloid oligomers and fibrils of the human islet amyloid polypeptide (hIAPP) has been linked with β- cell failure and death which causes the onset, progression, and comorbidities of diabetes. We begin to unpack the aggregation-oligomerization-fibrillization process of these oligomers taken from sera of pediatric patients. The naturally occurring or real hIAPP (not synthetic) amyloid oligomers (RIAO) were successfully isolated, we demonstrated the presence of homo (dodecamers, hexamers, and trimers) and hetero-RIAO, as well as several biophysical characterizations which allow us to learn from the real phenomenon taking place. We found that the aggregation/oligomerization process is active in the sera and showed that it happens very fast. The RIAO can form fibers and react with anti-hIAPP and anti-amyloid oligomers antibodies. Our results opens the epistemic horizon and reveal real differences between the four groups (Controls vs obesity, T1DM or T2DM) accelerating the process of understanding and discovering novel and more efficient prevention, diagnostic, transmission and therapeutic pathways.


Conflict of interest statement

The authors declare no competing interests.

Figures

Figure 1
Figure 1
Results from the western blot. (A) PTS reacting to the Anti-hIAPP antibody. Codes of samples: (INP2: T1DM, INP75:T2DM, INP7:T1DM, INP64:T2DM, CMN131:Healthy children, CMN132:Healthy children, INP5:T1DM, INP46:T2DM, OLI: hIAPP synthetic oligomers). Ten micrograms of each PTS were loaded in SDS-PAGE 12% gel. The numbers on the left correspond to the molecular weight in kDa for the bands. The largest amount came out in the 50 kDa and 25 kDa markers. (B) Densitometry analysis of the samples for the bands of 50, 25, and 13 kDa. It shows us the amount of hIAPP oligomers found in each of these bands for these three molecular weights. (C) Samples reacting to the Anti-oligomer antibody. (D) Densitometry for the oligomers found in each sample.
Figure 2
Figure 2
Representative TEM images of Oligomers and fibers characterization in small, medium, and large from the negative staining of patient PTS with different clinical characteristics. PTS at 0.1 mg/mL were in PBS 1X pH 7.4 before TEM experiments.
Figure 3
Figure 3
Representative TEM images of Negative staining of the patient PTS. (A) Group A-T1DM; many oligomers and a few intermixed fibers. (B) Group B-T2DM; We can see large oligomers forming clusters, mixed with small and medium fibers. (C) Group C-Obesity; A high amount of medium oligomers is found with very elongated fibers. (D) Group D-Healthy children; Small and medium oligomers with small fibers. PTS at 0.1 mg/mL were in PBS 1X pH 7.4 before TEM experiments.
Figure 4
Figure 4
Electron micrography of the immunolocalization of anti-amylin in patient PTS. (A) Group A-T1DM, (B) Group B-T2DM, (C) Group C-Obesity, (D) Group D-Healthy children. Colloidal gold is 20 nm. Gold traces are found on small fiber clusters. PTS at 0.1 mg/mL were in PBS 1X pH 74 before TEM experiments.
Figure 5
Figure 5
Electron micrography of the immunolocalization of anti-A11 in patient PTS with different clinical characteristics. (A) Group A, shows disperse granules (B) Group B, we can find the gold particles on the fibers (C) Group C and D are similar to figure (A). Colloidal gold is 12 nm. Gold traces are found on fibers or fibers clusters. PTS at 0.1 mg/mL were in PBS 1X pH 7.4 before TEM experiments.
Figure 6
Figure 6
(A) Results from the ThT fluorescence experiments. (A) Group A-T1DM, (B) Group B-T2DM, (C) Group C-Obesity, (D) Group D-Healthy children. Representative sample from every group was analyzed at two different concentrations, and in absence of synthetic monomeric hIAPP. A blank sample was included for comparison. All measurements were performed with a ThT-buffer at 37 °C (PBS 1X, pH 7.4 + 20 μM ThT); protein concentrations of 0.039 mg/mL or 0.0039 mg/mL (B) Comparison of the average t-lag for the trapping experiment (three measurements). One sample from every group was added to synthetic monomeric hIAPP at the same concentration 1:1 (0.039 mg/mL each one), and at one tenth of the concentration 1:0.1 (0.039 mg/mL synthetic hIAPP: 0.0039 mg/mL patient PTS). Synthetic Monomeric hIAPP in absence of patient PTS is included as reference.
Figure 7
Figure 7
Results for the circular dichroism experiments, comparing the spectra between freshly prepared samples and the same sample after some time in storage. (A) Group A-T1DM, (B) Group B-T2DM, (C) Group C-Obesity, (D) Group D-Healthy children. Each letter corresponds to the sample’s group. All measurements were performed with 0.1 mg/mL of patient PTS in PBS 1 X buffer (pH 7.4) and 0.1 cm flow-cell at RT (25 °C).
Figure 8
Figure 8
Results from the SEC fractionation experiments on a BioSuite 250, 5 μm HR SEC column. The panels on the left show the chromatography for selected representative PTS from each group, both with and without Gn-HCl as denaturant. The panels on the right show the results for all the PTS run for each group, where we can compare the differences between each sample’s peak area and elution time (without Gn-HCl). (A) Group A-T1DM, (B) Group B-T2DM, (C) Group C-Obesity, (D) Group D-Healthy children. All measurements were performed with 0.8 mg/mL of patient PTS or 0.4 mg/mL of patient PTS:Gn-HCl (3 M), in 50 mM Tris-HCl + 50 mM KCl pH = 7.4 at flow rate of 1 ml/min.

References

    1. Sontag, E. M., Samant, R. S. & Frydman, J. Mechanisms and Functions of Spatial Protein Quality Control., 10.1146/annurev-biochem (2017). - PubMed
    1. Chiti F, et al. Structural Studies of Amyloid Proteins at the Molecular Level. Annu. Rev. Biochem. 2017;86:193–224. doi: 10.1146/annurev-biochem-061516-045115. - DOI - PubMed
    1. Eisenberg DS, Sawaya MR. Structural Studies of Amyloid Proteins at the Molecular Level. Annu. Rev. Biochem. 2017;86:69–95. doi: 10.1146/annurev-biochem-061516-045104. - DOI - PubMed
    1. Dikic I. Proteasomal and Autophagic Degradation Systems. Annu. Rev. Biochem. 2017;86:193–224. doi: 10.1146/annurev-biochem-061516-044908. - DOI - PubMed
    1. Knowles, T. P., Vendruscolo, M. & Dobson, C. M. The amyloid state and its association with protein misfolding diseases. Nat.Rev.Mol.Cell Biol. 15, 384–396 (2014). - PubMed

Publication types

MeSH terms

Substances