

Prevalence and Severity of Artifacts in Optical Coherence Tomographic Angiograms
- PMID: 31804666
- PMCID: PMC6902206
- DOI: 10.1001/jamaophthalmol.2019.4971
Prevalence and Severity of Artifacts in Optical Coherence Tomographic Angiograms
Erratum in
-
Error in Byline.JAMA Ophthalmol. 2020 Apr 1;138(4):420. doi: 10.1001/jamaophthalmol.2020.0227. JAMA Ophthalmol. 2020. PMID: 32105296 Free PMC article. No abstract available.
Abstract
Importance: Artifacts can affect optical coherence tomographic angiography (OCTA) images and may be associated with misinterpretation of OCT scans in both clinical trials and clinical settings.
Objectives: To identify the prevalence and type of artifacts in OCTA images associated with quantitative output and to analyze the role of proprietary quality indices in establishing image reliability.
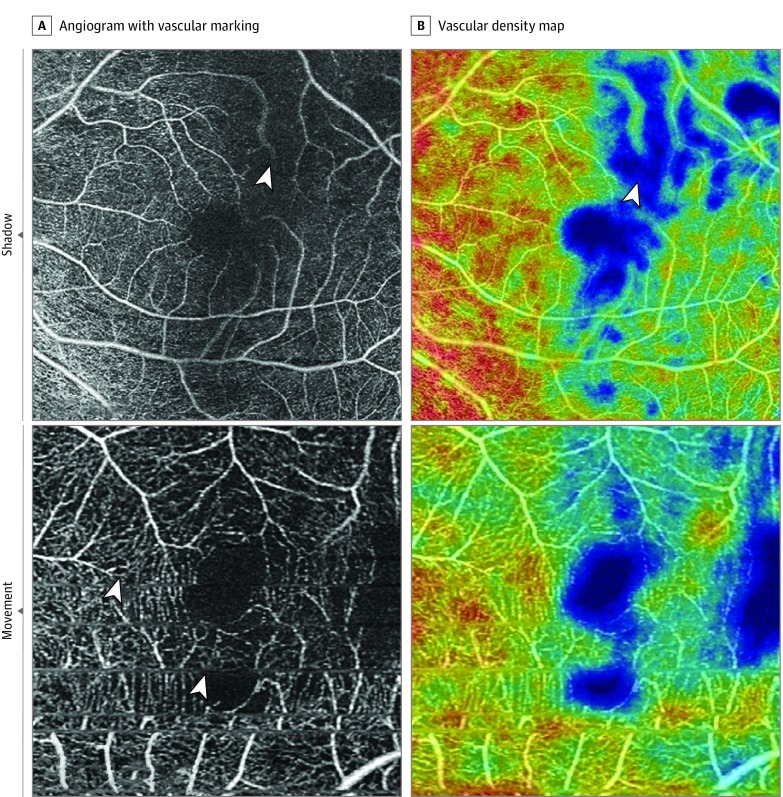
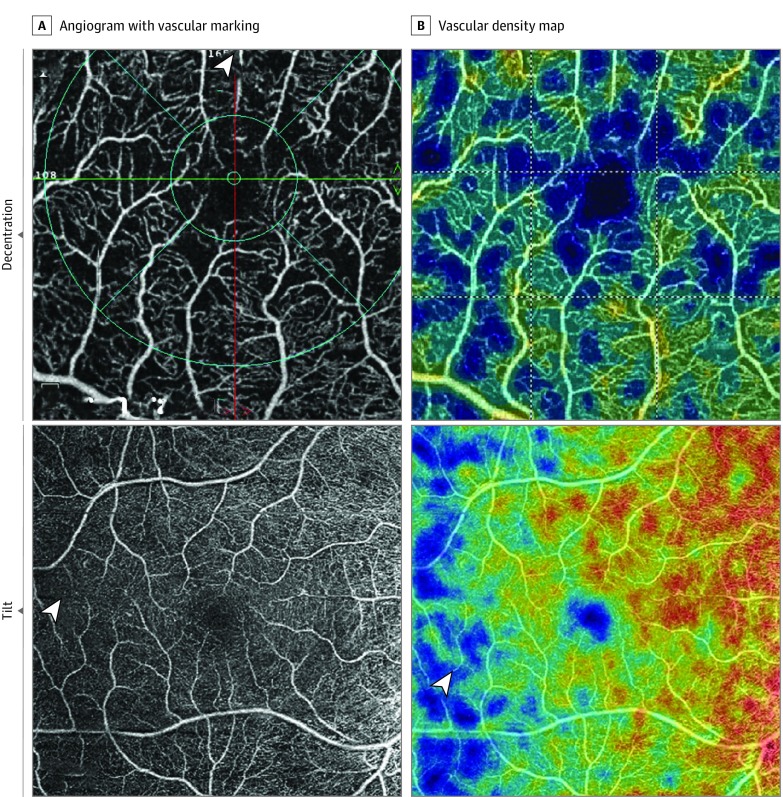
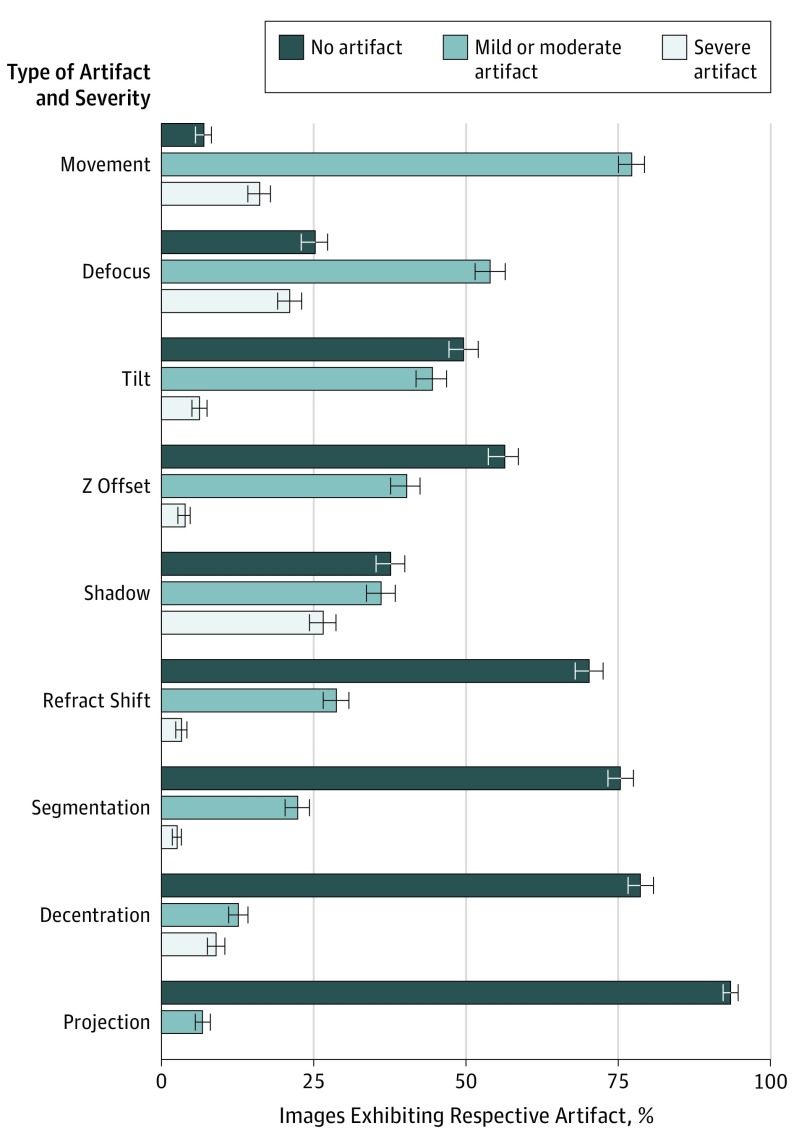
Design, setting, and participants: This cross-sectional study evaluated baseline OCTA images acquired in multicenter clinical trials and submitted to the Fundus Photograph Reading Center in Madison, Wisconsin, between January 1, 2016, and December 31, 2018. Images were captured using the 3 mm × 3 mm and/or 6 mm × 6 mm scan protocol with commercially available OCTA systems. Artifacts, including decentration, segmentation error, movement, blink, refraction shift, defocus, shadow, Z offset, tilt, and projection, were given a severity grade based on involvement of cross-sectional OCT and area of OCT grid affected.
Main outcomes and measures: Prevalence and severity of OCTA artifacts and area under the receiver operating characteristic curve (AUC) of quality indices with image reliability.
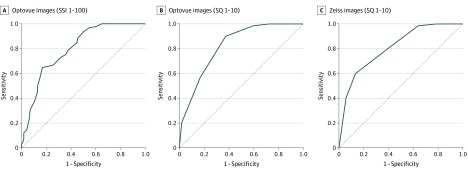
Results: A total of 406 OCTA images from 234 eyes were included in this study, of which 221 (54.4%) were 6 mm × 6 mm scans and 185 (45.6%) were 3 mm × 3 mm scans. At least 1 artifact was documented in 395 images (97.3%). Severe artifacts associated with the reliability of quantitative outputs were found in 217 images (53.5%). Shadow (26.9% [109 images]), defocus (20.9% [85 images]), and movement (16.0% [65 images]) were the 3 most prevalent artifacts. Prevalence of artifacts did not vary with the imaging system used or with the scan protocol; however, the type of artifacts varied. Commercially recommended quality index thresholds had an AUC of 0.80 to 0.83, sensitivity of 97% to 99%, and specificity of 37% to 41% for reliable images.
Conclusions and relevance: Findings from this study suggest that artifacts associated with quantitative outputs on commercially available OCTA devices are highly prevalent and that identifying common artifacts may require correlation with the angiogram and cross-sectional OCT scans. Knowledge of these artifacts and their implications for OCTA indices appears to be warranted for more accurate interpretation of OCTA images.
Conflict of interest statement
Figures
Comment in
-
Pearls and Pitfalls of Optical Coherence Tomography Angiography Image Interpretation.JAMA Ophthalmol. 2020 Feb 1;138(2):126-127. doi: 10.1001/jamaophthalmol.2019.5099. JAMA Ophthalmol. 2020. PMID: 31804665 No abstract available.
