. 2019 Dec 5;14(12):e0225826.
doi: 10.1371/journal.pone.0225826. eCollection 2019.

Predicting the replicability of social science lab experiments

Affiliations

Predicting the replicability of social science lab experiments

Adam Altmejd et al. PLoS One. .

Abstract

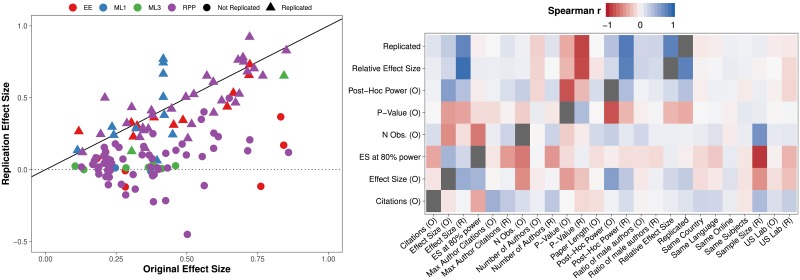
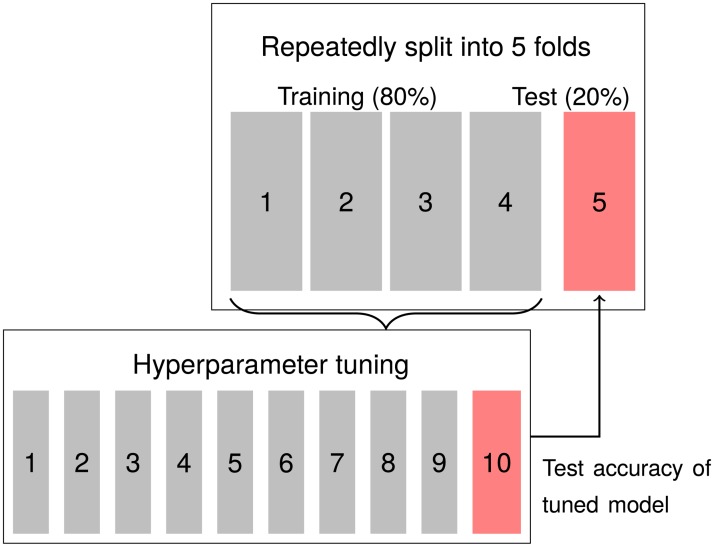
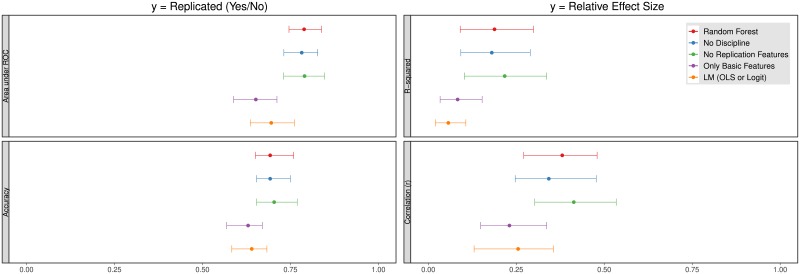
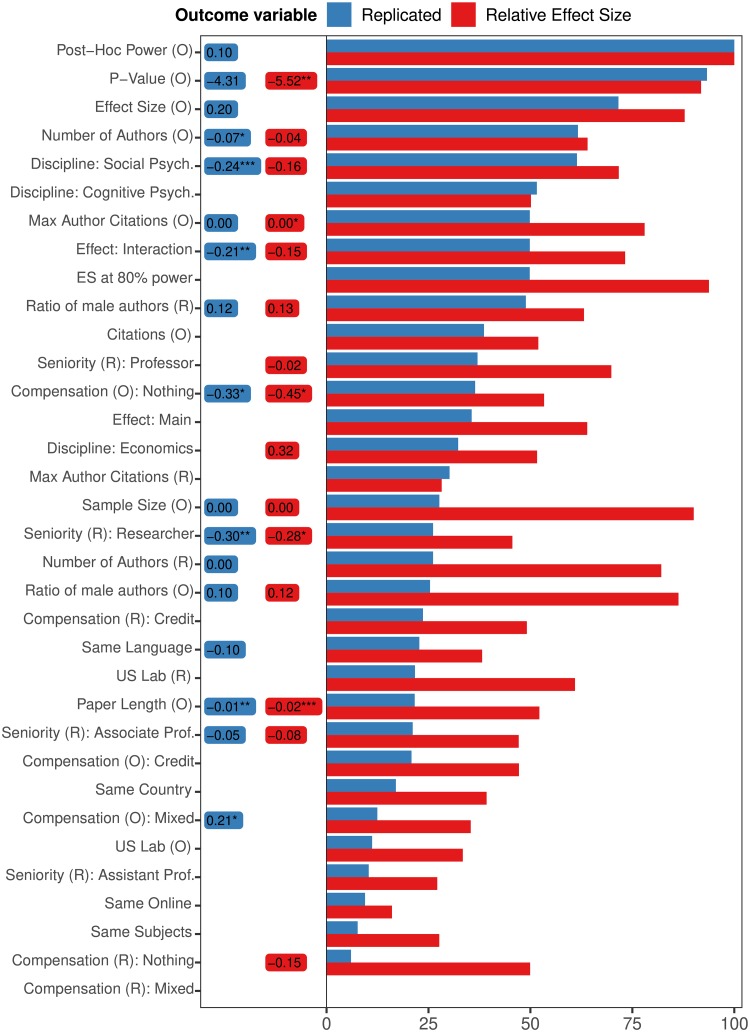
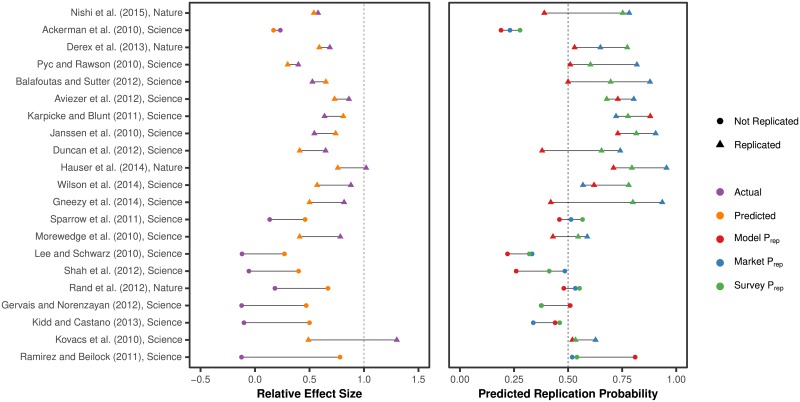
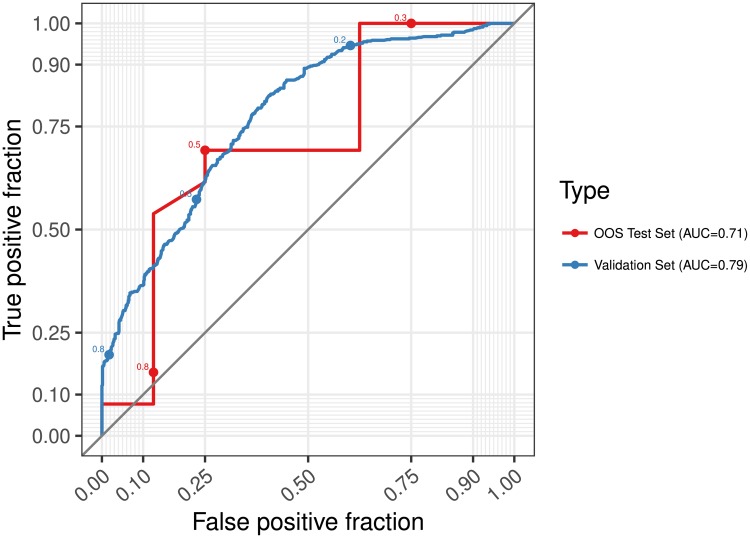
We measure how accurately replication of experimental results can be predicted by black-box statistical models. With data from four large-scale replication projects in experimental psychology and economics, and techniques from machine learning, we train predictive models and study which variables drive predictable replication. The models predicts binary replication with a cross-validated accuracy rate of 70% (AUC of 0.77) and estimates of relative effect sizes with a Spearman ρ of 0.38. The accuracy level is similar to market-aggregated beliefs of peer scientists [1, 2]. The predictive power is validated in a pre-registered out of sample test of the outcome of [3], where 71% (AUC of 0.73) of replications are predicted correctly and effect size correlations amount to ρ = 0.25. Basic features such as the sample and effect sizes in original papers, and whether reported effects are single-variable main effects or two-variable interactions, are predictive of successful replication. The models presented in this paper are simple tools to produce cheap, prognostic replicability metrics. These models could be useful in institutionalizing the process of evaluation of new findings and guiding resources to those direct replications that are likely to be most informative.


Conflict of interest statement

The authors have declared that no competing interests exist.

Figures

Fig 1
Fig 1. Effect sizes and correlations.
(A) A plot of effect sizes (r) in each study pair. Data source is coded by color. Symbol shape denotes whether a study replicated (binary measure). Most points are below the 45-degree line, indicating that effect sizes are smaller in replications. Replications with a negative effect size have effects in the opposite direction compared to the original study. (B) A heatmap showing Spearman rank-order correlations between variables. Y-axis shows most important features with the two dependent variables on the top. O and R in the variable label correspond to original and replication studies, respectively. Plus and minus indicate positive and negative correlations respectively. Most correlations are weak. See S1 Table for variable definitions and S1 Fig for a full correlation plot.
Fig 2
Fig 2. Model training, nested cross-validation (CV).
First, the data is split into five parts. Four parts are used for training. For each model a 10-fold CV is run on this training data to find optimal hyperparameters for each algorithm. When training the LASSO, different values for λ (penalty to weakly correlated variables) are tested, for Random Forest the number of randomly selected features to consider at each split changes. In each run the model is trained on 9/10th of the data and tested on the last decile. The best version (with highest AUC) is trained on all of the training data and its accuracy is estimated on the fifth fold of the outer loop. The process is repeated with a different outer fold held out. After five runs, a new set is drawn, and the process is repeated until 100 accuracy metrics have been generated.
Fig 3
Fig 3. Interquartile range (IQR) and median of Random Forest classifier (left) and regression (right) validation set performance.
For the classifier, the optimal model (first from top) has an average AUC of 0.79 and accuracy of 70% at the 50% probability cutoff (accuracy is mainly driven by a high true negative rate; unsuccessful replications are predicted with an accuracy of 80%, while successful only with 56%). The optimal regression model has a median R2 of 0.19 and a Spearman ρ of 0.38. The second bar from the top in each subplot shows unchanged model performance when dummy indicators for discipline (Economics, Social or Cognitive Psychology) are removed. The third has excluded any features unique to the replication effort (e.g. replication team seniority) with no observable loss of performance. The less accurate fourth model is only based on original effect size and p-value. Last, the model at the bottom is a linear model trained on the full feature set, for reference. See S3 Fig for more models.
Fig 4
Fig 4. Right side contains relative variable importance for all features used in the Random Forest, for both regression (red) and classification (blue) models, sorted by decreasing contribution to the predictive power of the binary classifier.
To the left are average marginal effects for those variables selected by a LASSO and then re-fit in a linear model (Logit for binary, OLS for continuous). Predictably, most of the top variables are statistical properties related to replicability and publication, but also other variables seem to be informative, especially for the Random Forest. For example, whether or not the effect tested is an interaction effect, as well as the number of citations are important. Last, note that the two top variables are basically non-linear transformations of one another. Stars indicate significance: p ≤ 0.01(***), p ≤ 0.05(**), and p ≤ 0.1(*).
Fig 5
Fig 5. Predicted and actual results of the SSRP.
Model predictions were registered before the experiments had been conducted. The left panel shows predicted relative effect size in purple and actual in orange, sorted by increasing prediction error. Right panel shows replication probability as predicted by the model, a prediction market, and a survey respectively. Data points are represented by a triangle when the replication was successful (p < 0.05 and an effect in the same direction). To see when the model made a correct prediction at the 50% probability threshold study the right panel. Red triangles on the right side of the dashed line and circles on the left side have been predicted correctly.
Fig 6
Fig 6. ROC curve for held-out validation sets from the best model during cross-validation and for the out of sample predictions.
The plot shows the trade off between true positives (predicting correctly that a study will replicate) and false positives (predicting that a study will replicate when it in fact does not) as the decision threshold varies. At a threshold of 0.5 the model identifies about 70% of the successful replications and 75% of the non-replications correctly. If a user of the model wants to lower the risk of missclassifying a paper that would replicate as not replicating they can use a threshold of e.g. 0.3. At this level, the model misclassifies less than 10% of the successful replications. The price, however, is that almost 70% of non-replications will also be labeled as successful.

References

    1. Dreber A, Pfeiffer T, Almenberg J, Isaksson S, Wilson B, Chen Y, et al. Using Prediction Markets to Estimate the Reproducibility of Scientific Research. Proceedings of the National Academy of Sciences. 2015;112(50):15343–15347. 10.1073/pnas.1516179112 - DOI - PMC - PubMed
    1. Camerer CF, Dreber A, Forsell E, Ho TH, Huber J, Johannesson M, et al. Evaluating Replicability of Laboratory Experiments in Economics. Science. 2016;351(6280):1433–1436. 10.1126/science.aaf0918 - DOI - PubMed
    1. Camerer CF, Dreber A, Holzmeister F, Ho TH, Huber J, Johannesson M, et al. Evaluating the Replicability of Social Science Experiments in Nature and Science between 2010 and 2015. Nature Human Behaviour. 2018;2(9):637–644. 10.1038/s41562-018-0399-z - DOI - PubMed
    1. Simonsohn U, Nelson LD, Simmons JP. P-Curve: A Key to the File-Drawer. Journal of Experimental Psychology: General. 2014;143(2):534–547. 10.1037/a0033242 - DOI - PubMed
    1. Simmons JP, Nelson LD, Simonsohn U. False-Positive Psychology Undisclosed Flexibility in Data Collection and Analysis Allows Presenting Anything as Significant. Psychological Science. 2011;22(11):1359–1366. 10.1177/0956797611417632 - DOI - PubMed

Publication types