Case Reports
. 2019 Dec 5;13(1):63.
doi: 10.1186/s40246-019-0238-y.

EFTUD2 gene deficiency disrupts osteoblast maturation and inhibits chondrocyte differentiation via activation of the p53 signaling pathway

Affiliations
Case Reports

EFTUD2 gene deficiency disrupts osteoblast maturation and inhibits chondrocyte differentiation via activation of the p53 signaling pathway

Jing Wu et al. Hum Genomics. .

Abstract

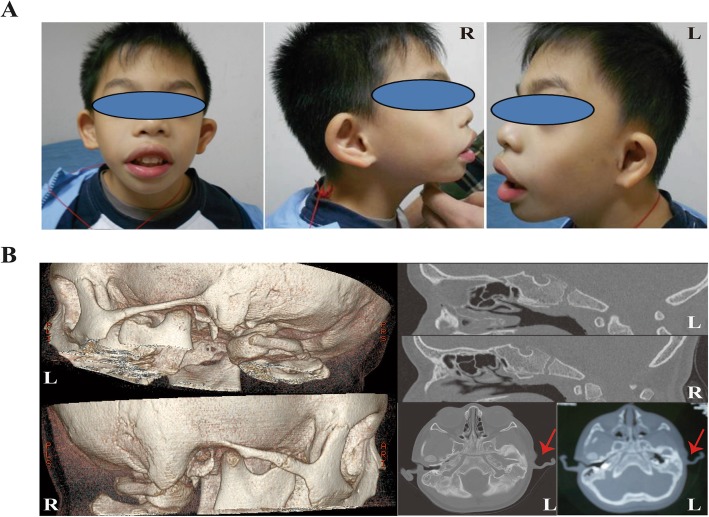
Background: Mandibulofacial dysostosis with microcephaly (MFDM) is characteristic of multiple skeletal anomalies comprising craniofacial anomalies/dysplasia, microcephaly, dysplastic ears, choanal atresia, and short stature. Heterozygous loss of function variants of EFTUD2 was previously reported in MFDM; however, the mechanism underlying EFTUD2-associated skeletal dysplasia remains unclear.

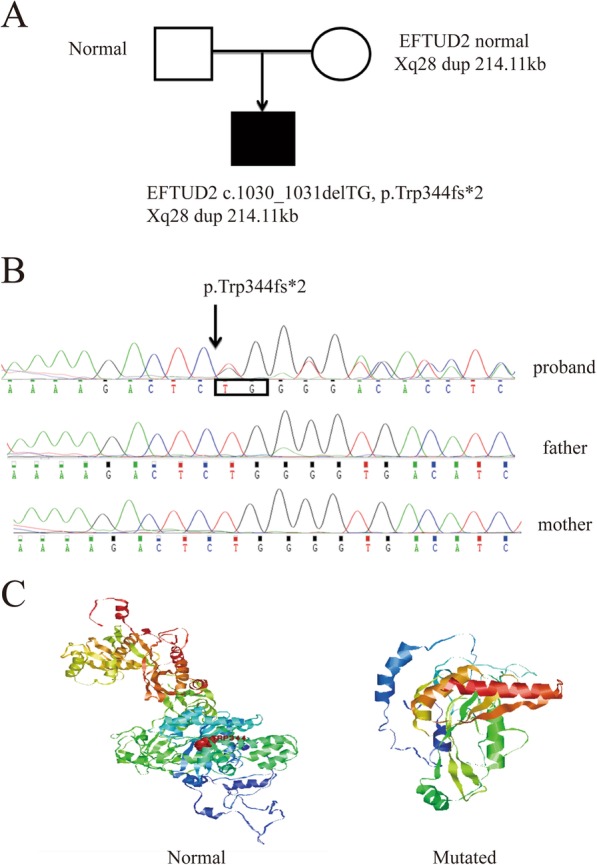
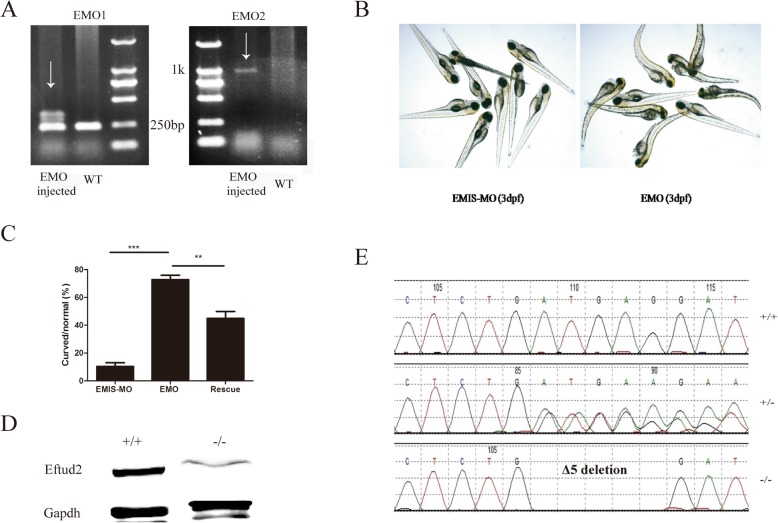
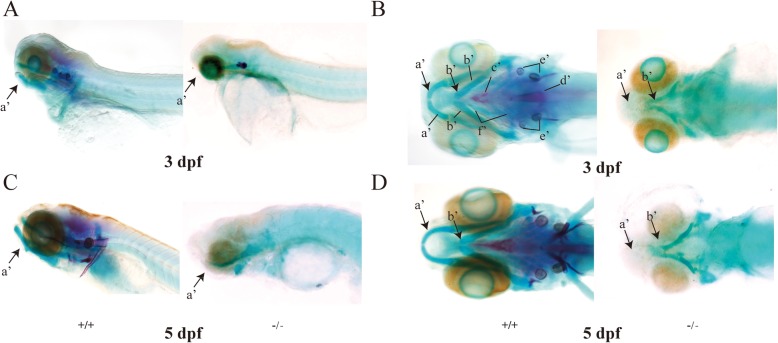
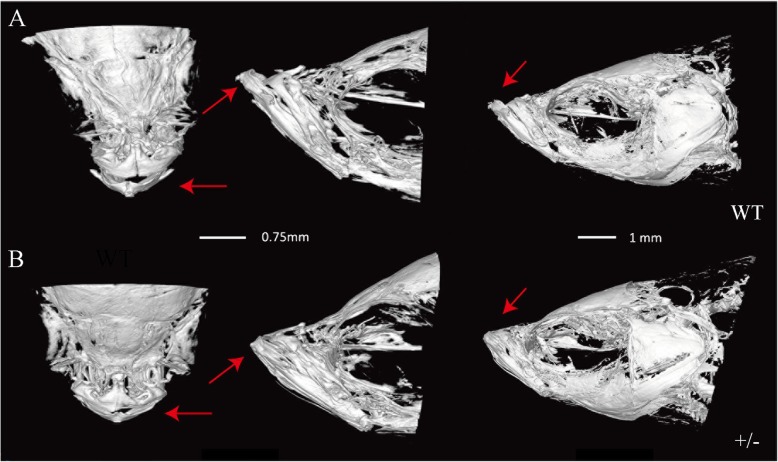
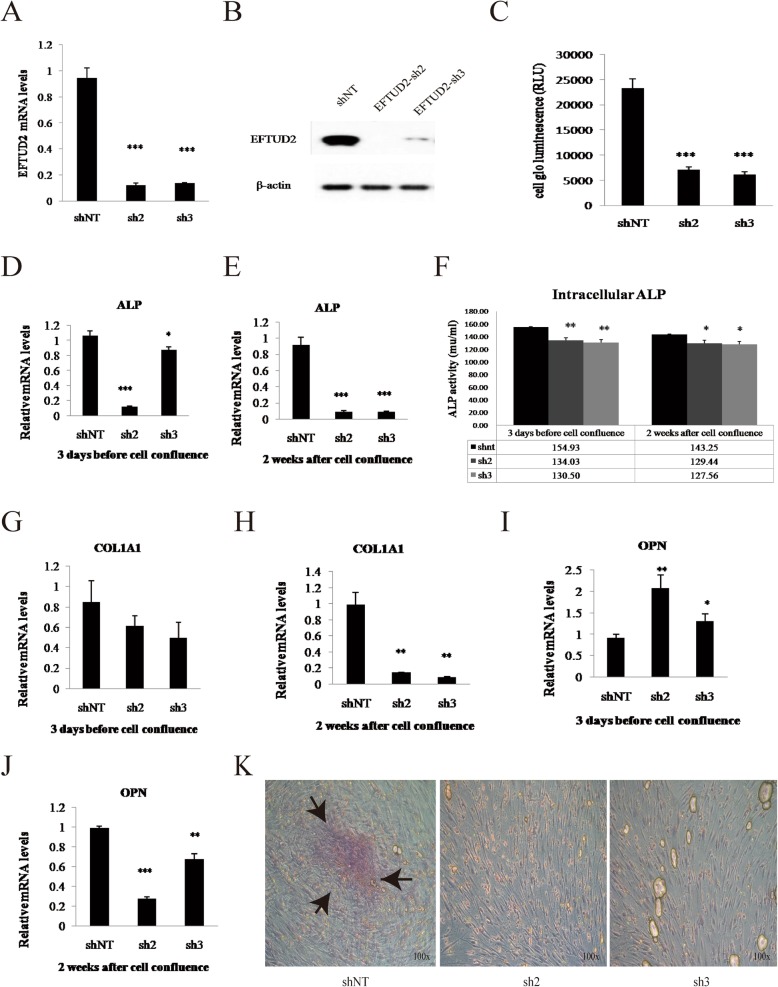
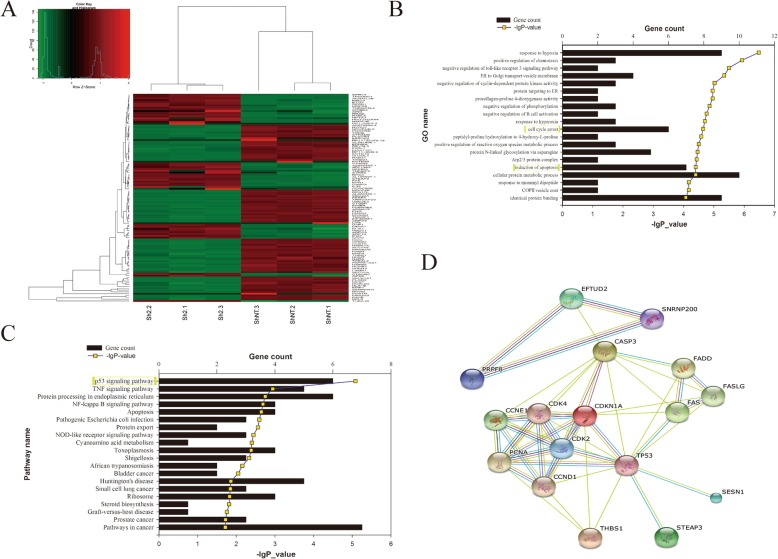
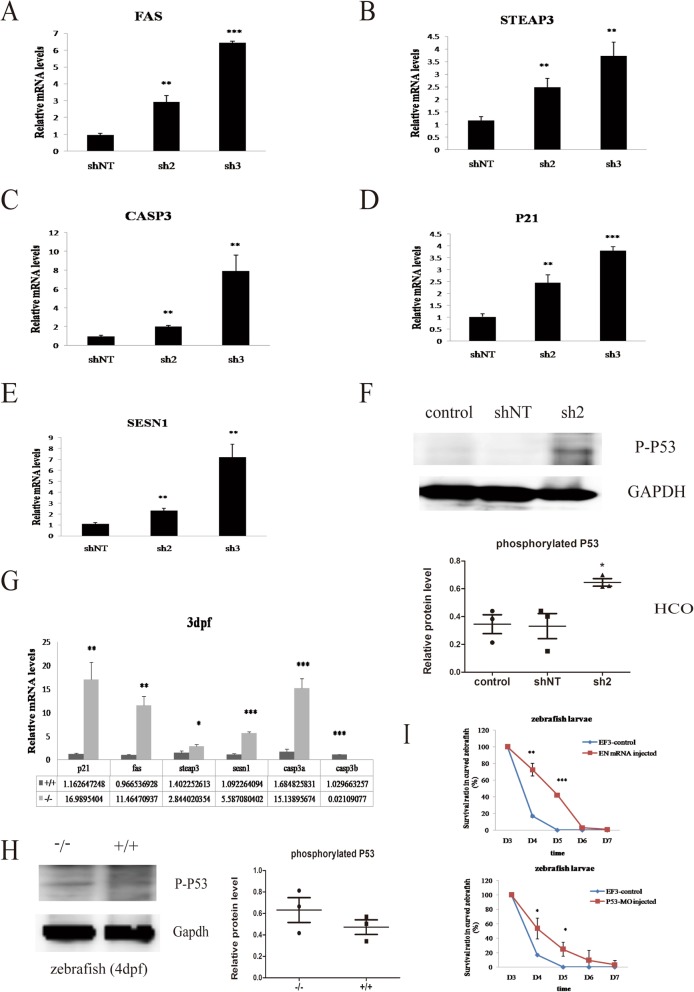
Results: We identified a novel frameshift variant of EFTUD2 (c.1030_1031delTG, p.Trp344fs*2) in an MFDM Chinese patient with craniofacial dysmorphism including ear canal structures and microcephaly, mild intellectual disability, and developmental delay. We generated a zebrafish model of eftud2 deficiency, and a consistent phenotype consisting of mandibular bone dysplasia and otolith loss was observed. We also showed that EFTUD2 deficiency significantly inhibited proliferation, differentiation, and maturation in human calvarial osteoblast (HCO) and human articular chondrocyte (HC-a) cells. RNA-Seq analysis uncovered activated TP53 signaling with increased phosphorylation of the TP53 protein and upregulation of five TP53 downstream target genes (FAS, STEAP3, CASP3, P21, and SESN1) both in HCO and in eftud2-/- zebrafish. Additionally, inhibition of p53 by morpholino significantly reduced the mortality of eftud2-/- larvae.

Conclusions: Our results confirm a novel de novo variant of the EFTUD2 gene and suggest that EFTUD2 may participate in the maturation and differentiation of osteoblasts and chondrocytes, possibly via activation of the TP53 signaling pathway. Thus, mutations in this gene may lead to skeletal anomalies in vertebrates.

Keywords: Chondrocyte; Developmental delay; EFTUD2; Mandibulofacial dysostosis with microcephaly; Osteoblast; TP53 signaling pathway; Zebrafish.


Conflict of interest statement

The authors declare that they have no competing interests.

Figures

Fig. 1
Fig. 1
Clinical presentation of the proband. a Microcephaly, abnormal external ear, and mandibular hypoplasia features of the patient at 57 months of age. b Malformed structures of the external and middle ear on the left head and temporal bones via CT scan at 37 months of age; soft tissue could be seen in the left tympanic cavity. R, right; L, left
Fig. 2
Fig. 2
Pedigrees and EFTUD2 variant identified by family trio whole-exome sequencing. a Pedigree and genotype. b De novo heterozygous mutation c.1030_1031delTG (p.Trp344fs*2) in EFTUD2 (NM_001258353.1) in the proband. c Difference in protein structures between normal EFTUD2 and the variant
Fig. 3
Fig. 3
eftud2 gene knockdown and knockout in zebrafish. a PCR analysis and gel electrophoresis to identify the efficacy of an eftud2 morpholino (EMO). On the left, amplification was performed with the EMO1 primer, which resulted in a clear band in WT zebrafish and nonspecific bands in EMO-injected larvae. On the right, amplification was performed with the EMO2 primer, which produced a clear band in EMO-injected zebrafish and nothing in the WT. b Phenotypes of mutant zebrafish subjected to EMO injection and control morpholino (mismatch morpholino, EMIS-MO)-injected zebrafish at 3 dpf. c Comparison of the numbers of curved larvae among zebrafish injected with EMO, EMO together with normal EFTUD2 mRNA (rescue group), or EMIS-MO. d Western blot analysis of Eftud2 protein levels between the WT (+/+) and homozygous (−/−) mutant zebrafish at 3 dpf. e DNA sequencing of WT (+/+), heterozygous (+/−), and homozygous (−/−) mutants at 3 dpf
Fig. 4
Fig. 4
Zebrafish subjected to eftud2 gene knockout had aberrant cartilage and bone development. a, c Lateral view of larvae treated with eftud2 TALEN mRNA (−/−) at 3 dpf and 5 dpf, exhibiting disruption of cartilage and bone formation compared with WT (+/+). b, d Ventral view of larvae treated with eftud2 TALEN mRNA (−/−) at 3 dpf and 5 dpf, showing cartilage and bone hypoplasia and otolith loss compared with WT (+/+). (The images on the left are WT controls, and those on the right are eftud2 mutants. Black arrows indicate the jawbone. a’ Meckel’s bone. b’ Ceratohyal bone. c’ Parasphenoid. d’ Notochord. e’ Otolith. f’ Ceratobranchial 1–5)
Fig. 5
Fig. 5
Adult zebrafish with heterozygous eftud2 mutation showed abnormal mandibular bone. a Mandible bone of wild-type adults (WT) scanned by synchrotron radiation X-ray microtomography (arrows). Scale bar, 0.75 mm. b The heterozygous F2 generation (+/−) exhibited a shortened mandibular bone (arrows). Images on the left are viewed from the dorsal side, while the images in the middle and on the right show lateral views. Scale bar, 1 mm
Fig. 6
Fig. 6
EFTUD2 gene knockdown in HCO cells. a Expression of EFTUD2 mRNA in HCO cells transfected with shNT, sh2, and sh3 lentiviruses. b Protein expression of EFTUD2 in HCO cells transfected with shNT, sh2, and sh3 lentiviruses. c Comparison of cell proliferation between HCO cells with EFTUD2 knockdown (sh2 and sh3) and the control group (shNT). d, e ALP mRNA levels in different groups (shNT, sh2, sh3) at 3 days before and 2 weeks after cell confluence in HCO cells. f Intracellular ALP activity (mu/ml) in HCO cells with EFTUD2 knockdown (sh2 and sh3) was much lower than in the control (shNT) at 3 days before cell confluence according to Student’s t test. g, h COL1A1 mRNA levels in HCO cells in different groups (shNT, sh2, sh3) at 3 days before and 2 weeks after cell confluence. i, j OPN mRNA levels in different groups (shNT, sh2, sh3) of HCO cells during development. k Alizarin red staining of HCO cells in these 3 groups at 3 days after cell confluence. Black arrows indicate calcific nodules (*P < 0.05; **P < 0.01; and ***P < 0.001; Student’s t test)
Fig. 7
Fig. 7
RNA-Seq analysis in HCO cells. a Hierarchical cluster heatmap of Z-scores for relevant genes between the sh2 and shNT groups, each of which includes three samples (sh2-1, sh2-2, sh2-3; shNT-1, shNT-2, shNT-3). b GO annotation revealed the most significant enrichment (P < 0.001), among which “cell cycle arrest” and “induction of apoptosis” were directly associated with cell development. c KEGG metabolic pathway categories with a significant P value; the P53 pathway was predicted to be the most likely (P < 0.001). d Protein interactions between EFTUD2 and the P53 pathway determined by the STRING website
Fig. 8
Fig. 8
The p53 pathway mediates cell development in HCO cells and zebrafish. a Expression of the FAS gene in cells transfected with different lentiviruses (sh2, sh3, and shNT as a scramble control) at 3 days before cell confluence. HCO cells subjected to EFTUD2 knockdown (sh2 and sh3) exhibited increased FAS levels. b The expression of CASP3 in the sh2 and sh3 groups was dramatically increased compared with that in the shNT group. c STEAP3 mRNA levels in the sh2 and sh3 groups were markedly higher than that in the negative control. d P21 mRNA levels were also highly increased in the sh2 and sh3 groups. e SESN1 was highly expressed in the sh2 and sh3 groups. f HCO cells transfected with sh2 had a higher expression of phosphorylated P53 protein (53 kDa) than the nontransfected (control) and shNT groups. g Expression of relevant genes involved in the P53 pathway in the EFTUD2 knockout (−/−) and WT (+/+) zebrafish. h The expression of phosphorylated P53 in EFTUD2-mutated larvae (−/−) with curved bodies and WT larvae at 4 dpf. i The survival rate among the curved F3 generation hybridizing from EFTUD2 heterozygous mutants (EF3 control), EF3 controls injected with EFTUD2 normal mRNA (EN mRNA), and p53 morpholino (P53-MO) during the early developmental stage (*P < 0.05, **P < 0.01, and ***P < 0.001)

References

    1. Matsuo M, Yamauchi A, Ito Y, et al. Mandibulofacial dysostosis with microcephaly: a case presenting with seizures. Brain and Development. 2017;39:177–181. doi: 10.1016/j.braindev.2016.08.008. - DOI - PubMed
    1. Huang L, Vanstone MR, Hartley T, et al. Mandibulofacial dysostosis with microcephaly: mutation and database update. Hum Mutat. 2016;37:148–154. doi: 10.1002/humu.22924. - DOI - PMC - PubMed
    1. Guion-Almeida ML, Zechi-Ceide RM, Vendramini S, Tabith JA. A new syndrome with growth and mental retardation, mandibulofacial dysostosis, microcephaly, and cleft palate. Clin Dysmorphol. 2006;15:171–174. doi: 10.1097/01.mcd.0000220603.09661.7e. - DOI - PubMed
    1. Zarate YA, Bell C, Schaefer GB. Radioulnar synostosis and brain abnormalities in a patient with 17q21.31 microdeletion involving EFTUD2. Cleft Palate Craniofac J. 2015;52:237–239. doi: 10.1597/13-221. - DOI - PubMed
    1. Voigt C, Megarbane A, Neveling K, et al. Oto-facial syndrome and esophageal atresia, intellectual disability and zygomatic anomalies - expanding the phenotypes associated with EFTUD2 mutations. Orphanet J Rare Dis. 2013;8:110. doi: 10.1186/1750-1172-8-110. - DOI - PMC - PubMed

Publication types

MeSH terms

Substances