. 2019 Dec 5;18(1):406.
doi: 10.1186/s12936-019-3038-x.

Changing plasma cytokine, chemokine and growth factor profiles upon differing malaria transmission intensities

Affiliations

Changing plasma cytokine, chemokine and growth factor profiles upon differing malaria transmission intensities

Ruth Aguilar et al. Malar J. .

Abstract

Background: Malaria epidemiological and immunological data suggest that parasite tolerance wanes in the absence of continuous exposure to the parasite, potentially enhancing pathogenesis. The expansion of control interventions and elimination campaigns raises the necessity to better understand the host factors leading to susceptibility or tolerance that are affected by rapid changes in malaria transmission intensity (MTI). Mediators of cellular immune responses are responsible for the symptoms and pathological alterations during disease and are expected to change rapidly upon malaria exposure or cessation.

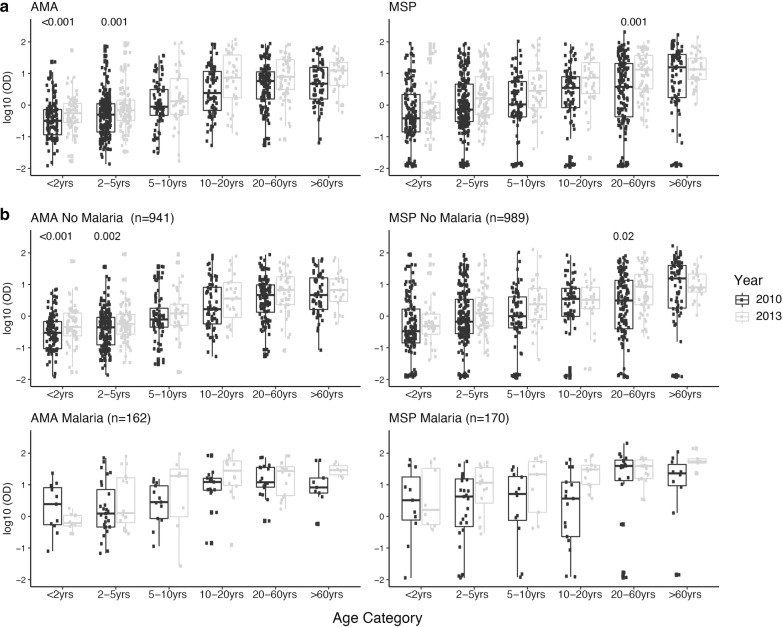
Methods: The plasma concentrations of 30 cytokine, chemokine and growth factors in individuals of all ages from a malaria endemic area of southern Mozambique were compared between 2 years of different MTI: 2010 (lower, n = 234) and 2013 (higher, n = 143). The effect of the year on the correlations between cytokines, chemokines and growth factors and IgGs to Plasmodium falciparum (markers of exposure) was explored. The effects of age, sex, neighbourhood and parasitaemia on analyte levels and their interactions with year were also assessed.

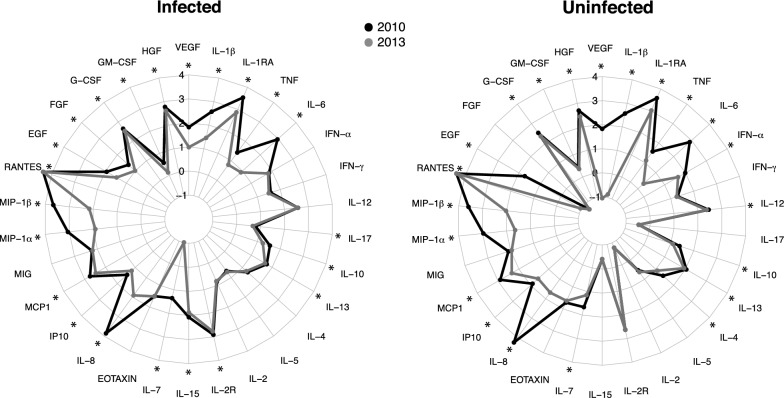
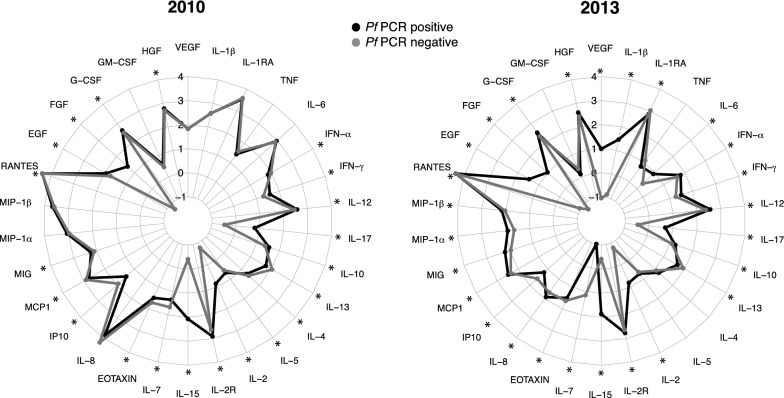
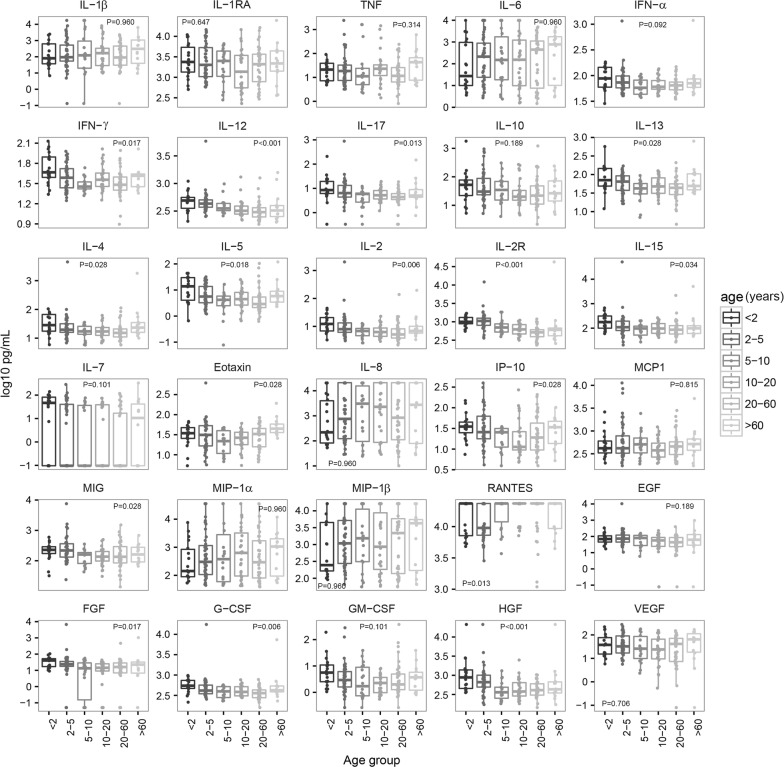
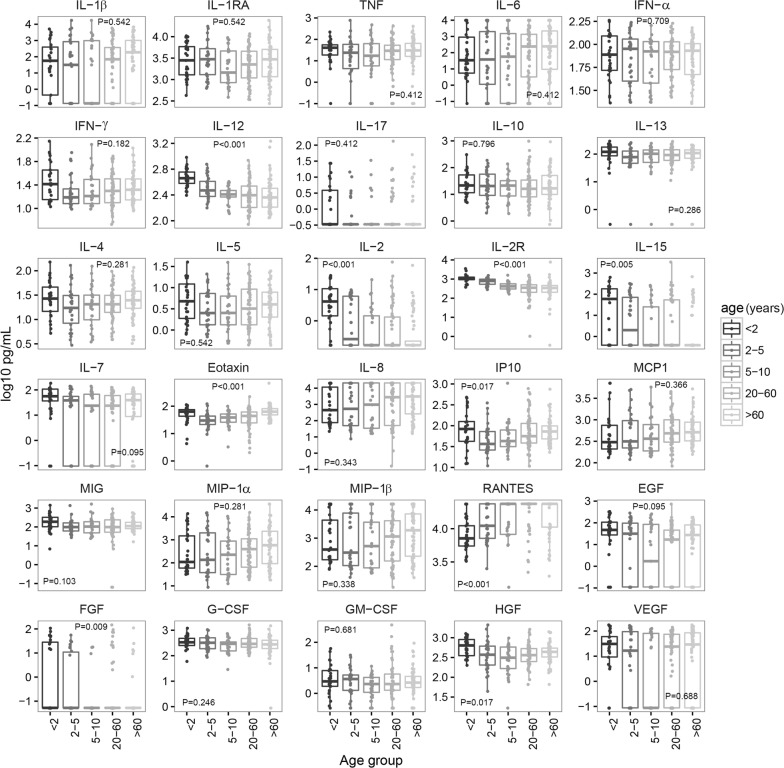
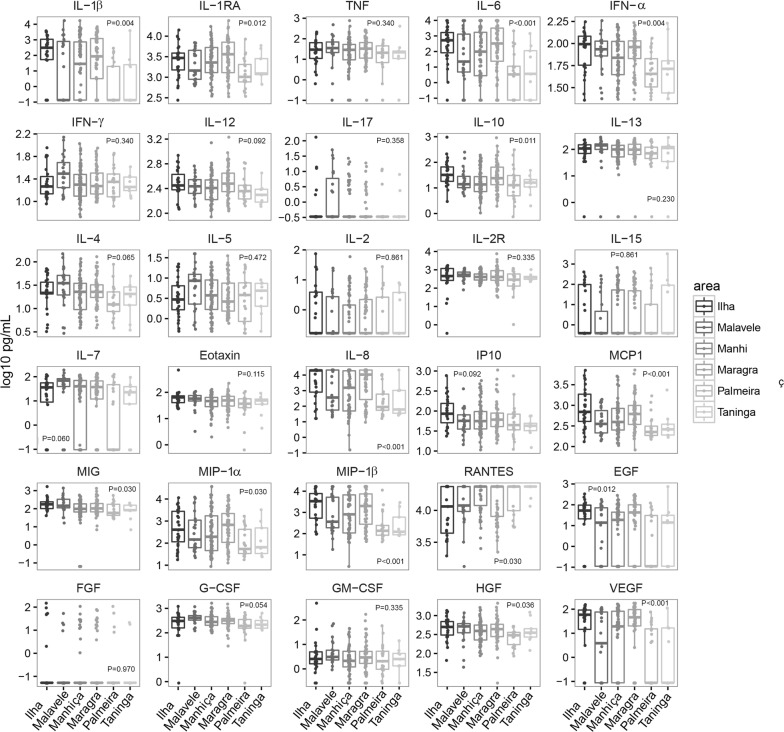
Results: An inverse correlation of several cellular immune mediators with malarial antibodies in 2013, and a lack of correlation or even a positive correlation in 2010 were observed. Most cytokines, chemokines and growth factors, regardless of their immune function, had higher concentrations in 2010 compared with 2013 in P. falciparum-infected and uninfected subjects. Age and neighbourhood showed an effect on analyte concentrations.

Conclusions: The results show a different regulation of the cellular immune response in 2010 vs 2013 which could be related to a loss of immune-tolerance after a decline in MTI in 2010 and previous years, and a rapid re-establishment of tolerance as a consequence of more continuous exposure as MTI began increasing in 2012. Cellular immune mediators warrant further investigation as possible surrogates of MTI-associated host susceptibility or tolerance.

Keywords: Age; Antibodies; Chemokines; Cytokines; Growth factors; Immunity; Malaria transmission intensity; Plasmodium falciparum; Tolerance.


Conflict of interest statement

The authors declare that they have no competing interests.

Figures

Fig. 1
Fig. 1
Differences in IgG levels against apical membrane protein-1 (AMA-1) and merozoite surface protein-1 (MSP-142) between 2010 and 2013 in each of the age groups (a) and stratifying by P. falciparum infection detected by qPCR (b). Box plots representing the median and interquartile range of IgG levels (log10 OD) measured by ELISA. a Shows an increase of IgGs to both antigens along age groups within each cross-sectional (p trend < 0.001in all four cases). In (a) and (b) levels between years were compared by Wilcoxon rank-sum test (adjusted p-values for multiple testing by the Holm approach < 0.05 are shown)
Fig. 2
Fig. 2
Differences in analyte concentrations between 2010 and 2013 stratified by infection. Radar charts representing the medians of each analyte concentration (log10 pg/mL) in 2010 and 2013 and stratifying in infected and uninfected subjects. Levels into each group have been compared between years by Wilcoxon rank-sum test and p-values were adjusted for multiple testing by the Benjamini–Hochberg approach. Statistically significant differences between years are highlighted with an asterisk
Fig. 3
Fig. 3
Differences in analytes concentrations between P. falciparum-infected and uninfected subjects stratified by year. Radar charts representing the medians of each analyte concentration (log10 pg/mL) in infected and uninfected subjects and stratifying by year. Levels between infected and uninfected subjects into each year have been compared by Wilcoxon rank-sum test and p-values were adjusted for multiple testing by the Benjamini–Hochberg approach. Statistically significant differences between infected and uninfected subjects are highlighted with an asterisk
Fig. 4
Fig. 4
Differences in concentrations of cellular immune mediators between age groups in P. falciparum-infected subjects from both years combined. Box plots representing the median and interquartile range of each analyte concentration (log10 pg/mL) in infected subjects stratified by age group. Levels between age groups have been compared by Kruskal–Wallis test. P-values were adjusted for multiple testing using the Benjamini–Hochberg approach
Fig. 5
Fig. 5
Differences in concentrations of cellular immune mediators between age groups in uninfected subjects from both years combined. Box plots representing the median and interquartile range of each analyte concentration (log10 pg/mL) in uninfected subjects stratified by age group. Levels between age groups have been compared by Kruskal–Wallis test. P-values were adjusted for multiple testing using the Benjamini–Hochberg approach
Fig. 6
Fig. 6
Differences in concentrations of cellular immune mediators between areas in uninfected subjects. Box plots representing the median and interquartile range of each analyte concentration (log10 pg/mL) in uninfected subjects stratified by neighbourhood. Levels between areas have been compared by Kruskal–Wallis test. p-values were adjusted for multiple testing using the Benjamini–Hochberg approach

References

    1. WHO. World malaria report 2018. Geneva: World Health Organization; 2018. https://www.who.int/malaria/publications/world-malaria-report-2018/en/. Accessed 1 Apr 2019
    1. Marsh K, Kinyanjui S. Immune effector mechanisms in malaria. Parasite Immunol. 2006;28:51–60. doi: 10.1111/j.1365-3024.2006.00808.x. - DOI - PubMed
    1. Langhorne J, Ndungu FM, Sponaas AM, Marsh K. Immunity to malaria: more questions than answers. Nat Immunol. 2008;9:725–732. doi: 10.1038/ni.f.205. - DOI - PubMed
    1. Portugal S, Moebius J, Skinner J, Doumbo S, Doumtabe D, Kone Y, et al. Exposure-dependent control of malaria-induced inflammation in children. PLoS Pathog. 2014;10:e1004079. doi: 10.1371/journal.ppat.1004079. - DOI - PMC - PubMed
    1. Jagannathan P, Kim CC, Greenhouse B, Nankya F, Bowen K, Eccles-James I, et al. Loss and dysfunction of Vdelta2(+) gammadelta T cells are associated with clinical tolerance to malaria. Sci Transl Med. 2014;6:251ra117. doi: 10.1126/scitranslmed.3009793. - DOI - PMC - PubMed

MeSH terms