. 2020 Feb;32(2):319-335.
doi: 10.1105/tpc.19.00562. Epub 2019 Dec 5.

A PXY-Mediated Transcriptional Network Integrates Signaling Mechanisms to Control Vascular Development in Arabidopsis

Affiliations

A PXY-Mediated Transcriptional Network Integrates Signaling Mechanisms to Control Vascular Development in Arabidopsis

Margot E Smit et al. Plant Cell. 2020 Feb.

Abstract

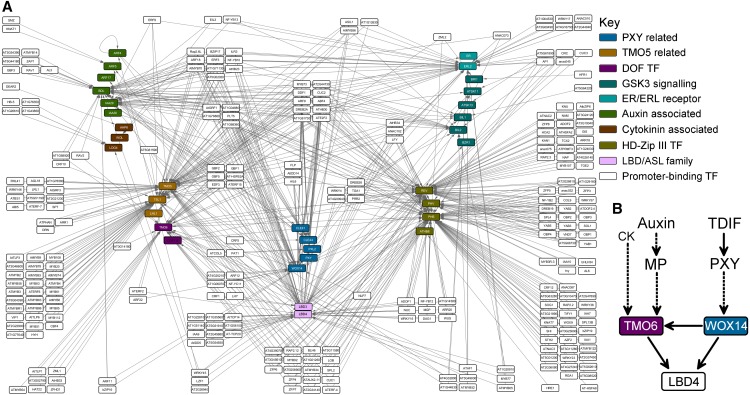
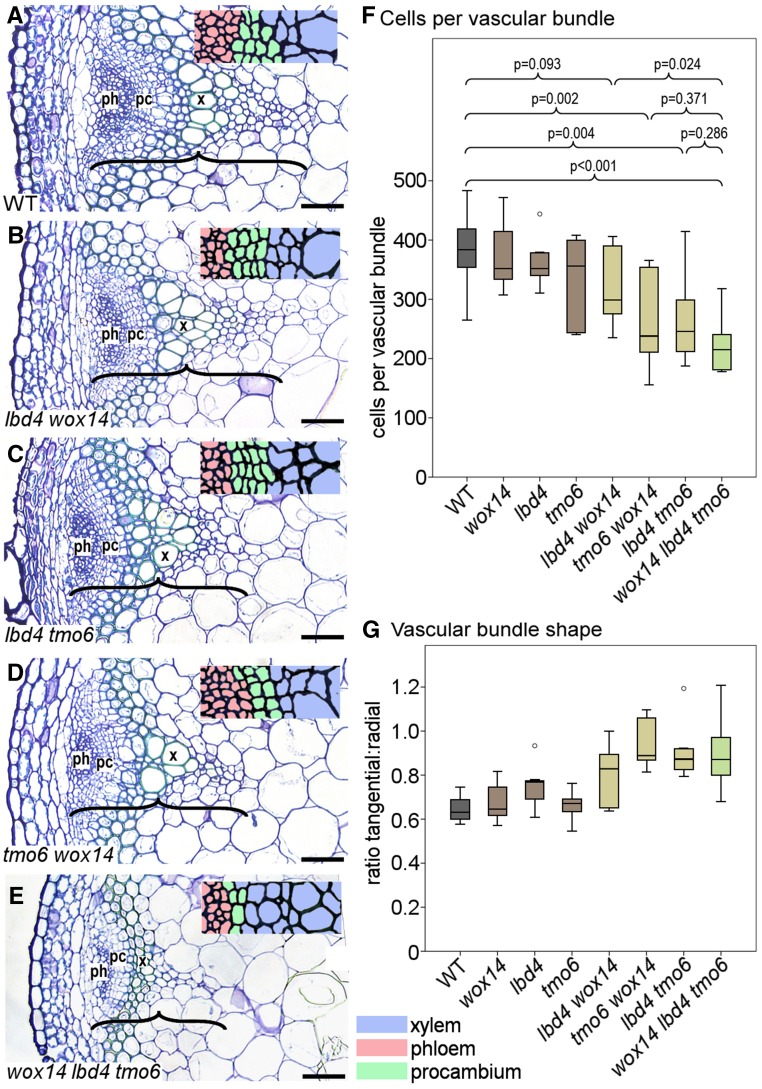
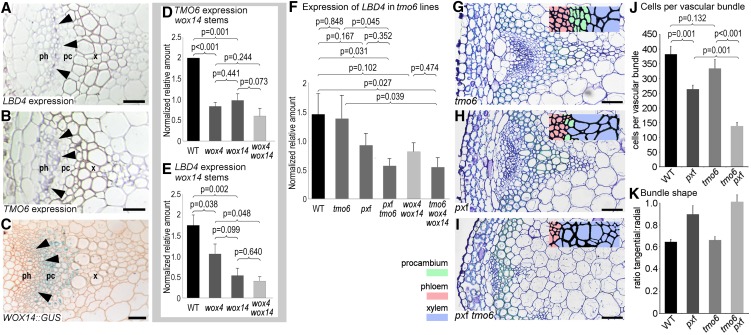
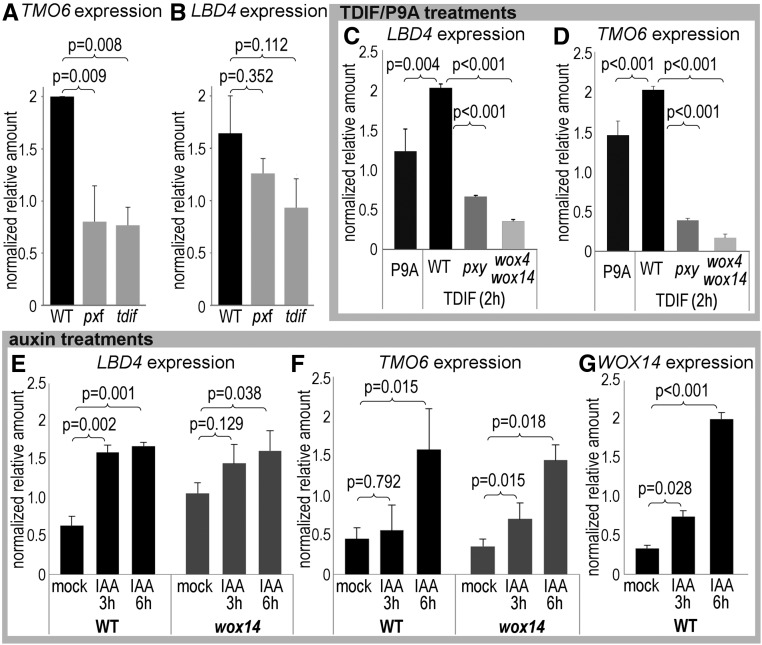
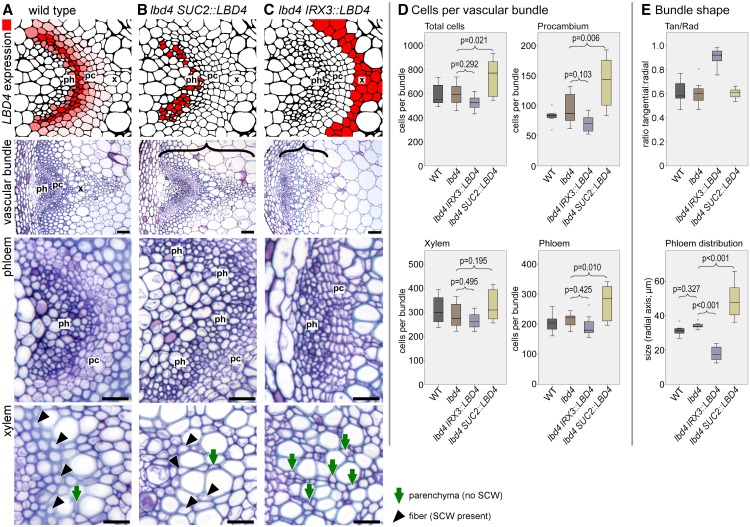
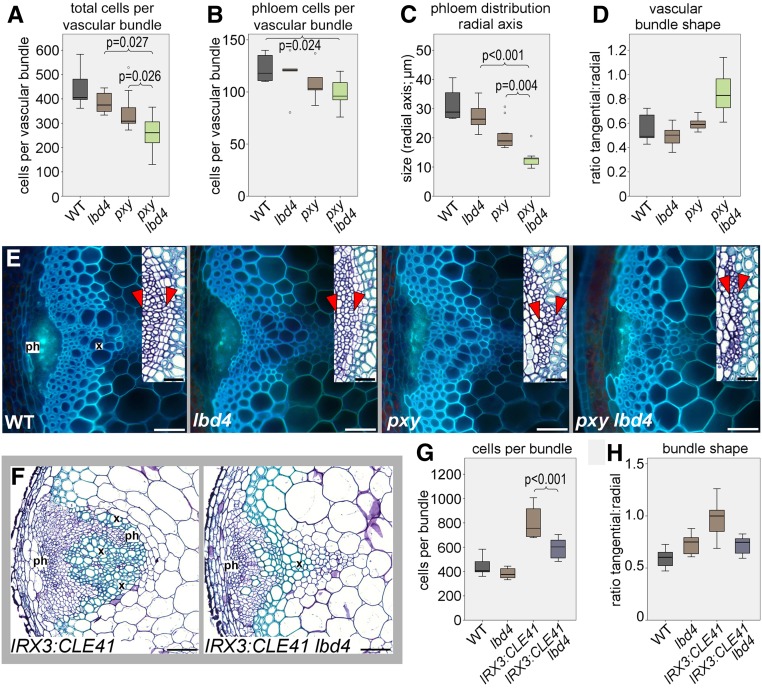
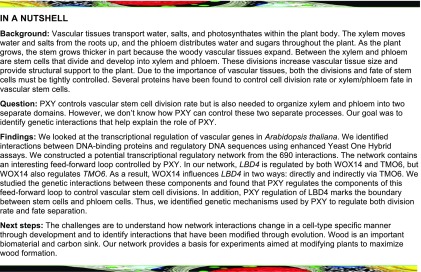
The cambium and procambium generate the majority of biomass in vascular plants. These meristems constitute a bifacial stem cell population from which xylem and phloem are specified on opposing sides by positional signals. The PHLOEM INTERCALATED WITH XYLEM (PXY) receptor kinase promotes vascular cell division and organization. However, how these functions are specified and integrated is unknown. Here, we mapped a putative PXY-mediated transcriptional regulatory network comprising 690 transcription factor-promoter interactions in Arabidopsis (Arabidopsis thaliana). Among these interactions was a feedforward loop containing transcription factors WUSCHEL HOMEOBOX RELATED14 (WOX14) and TARGET OF MONOPTEROS6 (TMO6), each of which regulates the expression of the gene encoding a third transcription factor, LATERAL ORGAN BOUNDARIES DOMAIN4 (LBD4). PXY signaling in turn regulates the WOX14, TMO6, and LBD4 feedforward loop to control vascular proliferation. Genetic interaction between LBD4 and PXY suggests that LBD4 marks the phloem-procambium boundary, thus defining the shape of the vascular bundle. These data collectively support a mechanism that influences the recruitment of cells into the phloem lineage, and they define the role of PXY signaling in this context in determining the arrangement of vascular tissue.


Figures

Figure 1.
Figure 1.
Diagrammatic Representation of the Vascular Development TRN. (A) Representation of all the interactions identified using eY1H. Promoters screened are shown as colored nodes. Transcription factors are shown as white nodes. Gray lines connect transcription factor nodes, with promoter nodes representing interactions in eY1H assays. (B) Subnetwork describing the feed-forward loop constituted of WOX14, TMO6, and LBD4 interactions and its regulation by auxin, cytokinin (CK), and TDIF-PXY signaling.
Figure 2.
Figure 2.
Consequences of Removing the Feed-Forward Loop. (A) to (E) Morphology of vascular bundles from inflorescence stems in the wild type (A), lbd4 wox14 (B), lbd4 tmo6 (C), tmo6 wox14 (D), and wox14 lbd4 tmo6 (E). Transverse sections were stained with toluidine blue. Insets show closeups of the cambium (green). pc, cambium; ph, phloem; x, xylem. Brackets mark the vascular bundle size along the radial axis of the stem. Bars = 50 μm. (F) Boxplots showing mean number of cells per vascular bundle in wox14 lbd4 tmo6 and double and single mutant controls. Significant differences were determined by ANOVA with an LSD posthoc test (n = 6). (G) Boxplot showing vascular bundle shape determined by measuring the ratio of tangential to radial axis (n = 6). Boxplots show median (inner line) and inner quartiles (box). Whiskers extend to the highest and lowest values no greater than 1.5 times the inner quartile range, and circles show outliers.
Figure 3.
Figure 3.
Gene Expression Studies Supporting a Regulatory Relationship between WOX14, TMO6, and LBD4. (A) to (C) WOX14, TMO6, and LBD4 demonstrate overlapping expression in inflorescence stem vascular bundles. Antisense probes against LBD4 mRNA (A) or TMO6 mRNA (B) localize to the phloem-procambium boundary. A WOX14:GUS transcriptional fusion (C) shows the presence of broad WOX14 expression in vascular bundles including at the phloem-procambium boundary. pc, cambium; ph, phloem; x, xylem. Bars = 30 μm. (D) and (E) qRT-PCR on inflorescence stem tissue from the lower third of the stem showing that TMO6 (D) and LBD4 (E) expression is dependent on WOX14. (F) qRT-PCR showing that TMO6 and PXf are required to maintain LBD4 expression in the lower one-half of 15-cm inflorescence stems. Expression differences were determined in technical triplicate for each of three biological replicates. Tissue for each biological replicate was taken from a different pot. Statistical differences were determined with ANOVA and an LSD posthoc test (n = 3 biological replicates; error bars are se). (G) to (I) Vascular bundles from the inflorescence stems of tmo6 (G), pxf (H), and pxf tmo6 (I) plants. Transverse sections were stained with toluidine blue. Bars = 30 μm. (J) Graph showing the mean number of cells per vascular bundle. P values were determined with ANOVA and an LSD posthoc test. (K) Histogram showing vascular bundle shape determined by measuring the ratio of tangential to radial axis. (n = 6; error bars are se).
Figure 4.
Figure 4.
PXY and Auxin Signaling Regulate the Feedforward Loop. (A) and (B) qRT-PCR showing TMO6 (A) and LBD4 (B) expression in pxf and tdif lines. (C) and (D) LBD4 (C) and TMO6 (D) expression in seedlings treated with TDIF or P9A for 2 h. (E) to (G) qRT-PCR showing LBD4 (E), TMO6 (F), and WOX14 (G) expression in seedlings treated with IAA for 3 or 6 h. Expression differences were determined in technical triplicate for each of three biological replicates. Tissue for each biological replicate was taken from a different plate. P values marked on critical comparisons were determined using ANOVA and an LSD posthoc test (n = 3 biological replicates; error bars are se).
Figure 5.
Figure 5.
LBD4 Expression Patterns the Vascular Tissue. (A) to (C) Consequences of LBD4 expression at the phloem-procambium boundary (A), in phloem (B), or in xylem (C) in inflorescence stems. Upper panels show diagrammatic representation of the LBD4 expression domain, with subsequent panels showing overall vascular morphology, phloem (ph), and xylem (x). pc, cambium; SCW, secondary cell wall. The radial axis is marked in (B) and (C) with a black bracket. Bars = 50 µm (whole vascular bundle) and 20 µm (xylem and phloem closeups). (A) Wild-type vascular bundle showing an arc of phloem cells, procambium cells, and xylem cells along the radial axis of a stem transverse section. Xylem is characterized by the presence of fiber cells with large secondary cell walls (black arrowheads). (B) lbd4 SUC2:LBD4 lines have an increased phloem size. Xylem fiber cells retain secondary cell walls (black arrowheads). Parenchyma, with no secondary cell wall, is marked with a green arrow. (C) lbd4 IRX3:LBD4 lines demonstrate a change to phloem morphology, as the characteristic arc is absent. Cells where fibers were observed in wild-type xylem do not have large secondary cell walls (parenchyma; green arrows). (D) Boxplots showing the mean number of total cells per vascular bundle (upper left) and number of procambium (upper right), phloem (lower right), and xylem (lower left) cells per vascular bundle. P values were determined using ANOVA with an LSD posthoc test (n = 7). (E) The upper boxplot shows vascular bundle shape determined by measuring the ratio of the tangential to the radial axis, and the lower boxplot shows the distribution of phloem along the radial axis of the stem. P values were determined using ANOVA with an LSD posthoc test (n = 7). Boxplots show median (inner line) and inner quartiles (box). Whiskers extend to the highest and lowest values no greater than 1.5 times the inner quartile range, and circles show outliers.
Figure 6.
Figure 6.
Genetic Interactions between LBD4 and TDIF-PXY. (A) to (E) Analysis of pxy lbd4 double mutants and controls. (A) and (B) Boxplots showing the total number of cells ([A]; n = 7) and the number of phloem cells ([B]; n = 6) per vascular bundle in 8-week-old inflorescence stems. (C) Boxplot showing the distribution of phloem along the radial axis of the stem (distribution is shown on insets in [E] as tissue between the red arrowheads; n = 7). (D) Boxplot showing vascular bundle shape determined by measuring the ratio of the tangential to the radial axis (n = 8). (E) Aniline blue-stained transverse sections of the wild type, lbd4, pxy, and pxy lbd4. Insets show closeups of phloem tissue stained with toluidine blue. (F) to (H) lbd4 suppresses CLE41 misexpression phenotypes. (F) IRX3:CLE41 vascular bundles are characterized by organization defects, but these defects are attenuated in IRX3:CLE41 lbd4 lines. (G) and (H) Boxplots show the number of cells per vascular bundle (G) and vascular bundle shape determined by measuring the ratio of tangential to radial axis ([H]; n = 6). Eight-week-old plants were used. Error bars are se; P values in (A) to (C) and (G) were determined using ANOVA with an LSD posthoc test. ph, phloem; x, xylem. Boxplots show median (inner line) and inner quartiles (box). Whiskers extend to the highest and lowest values no greater than 1.5 times the inner quartile range, and circles show outliers. Bars = 50 μm, except for insets in (E), where bars = 20 μm.
None

Comment in

References

    1. Alonso J.M., et al. (2003). Genome-wide insertional mutagenesis of Arabidopsis thaliana. Science 301: 653–657. - PubMed
    1. Atanassov I.I., Atanassov I.I., Etchells J.P., Turner S.R. (2009). A simple, flexible and efficient PCR-fusion/Gateway cloning procedure for gene fusion, site-directed mutagenesis, short sequence insertion and domain deletions and swaps. Plant Methods 5: 14. - PMC - PubMed
    1. Bae S., Park J., Kim J.-S. (2014). Cas-OFFinder: A fast and versatile algorithm that searches for potential off-target sites of Cas9 RNA-guided endonucleases. Bioinformatics 30: 1473–1475. - PMC - PubMed
    1. Baima S., Forte V., Possenti M., Peñalosa A., Leoni G., Salvi S., Felici B., Ruberti I., Morelli G. (2014). Negative feedback regulation of auxin signaling by ATHB8/ACL5-BUD2 transcription module. Mol. Plant 7: 1006–1025. - PubMed
    1. Baima S., Nobili F., Sessa G., Lucchetti S., Ruberti I., Morelli G. (1995). The expression of the Athb-8 homeobox gene is restricted to provascular cells in Arabidopsis thaliana. Development 121: 4171–4182. - PubMed

Publication types

MeSH terms