. 2019 Dec;25(12):1843-1850.
doi: 10.1038/s41591-019-0673-2. Epub 2019 Dec 5.

Undulating changes in human plasma proteome profiles across the lifespan

Affiliations

Undulating changes in human plasma proteome profiles across the lifespan

Benoit Lehallier et al. Nat Med. 2019 Dec.

Abstract

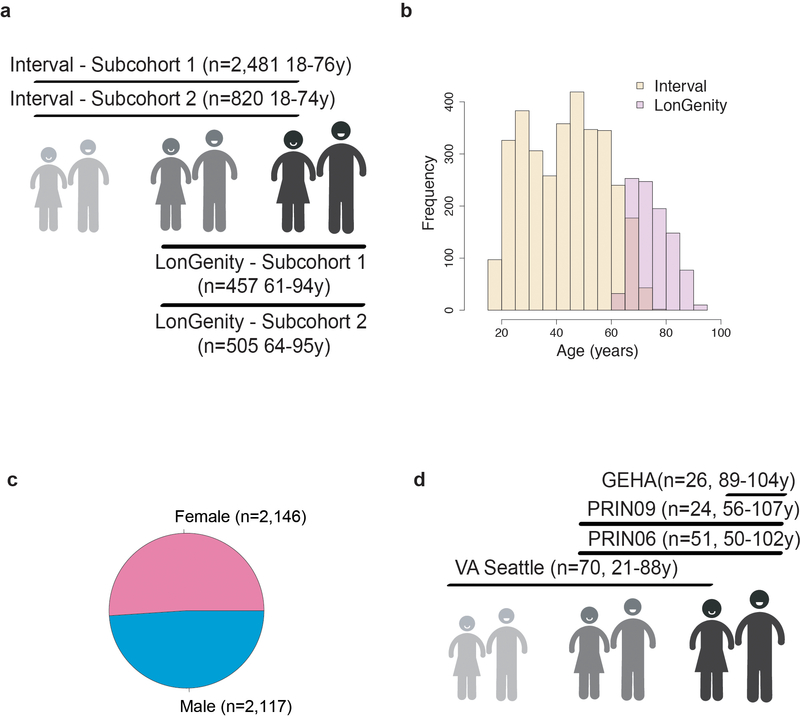
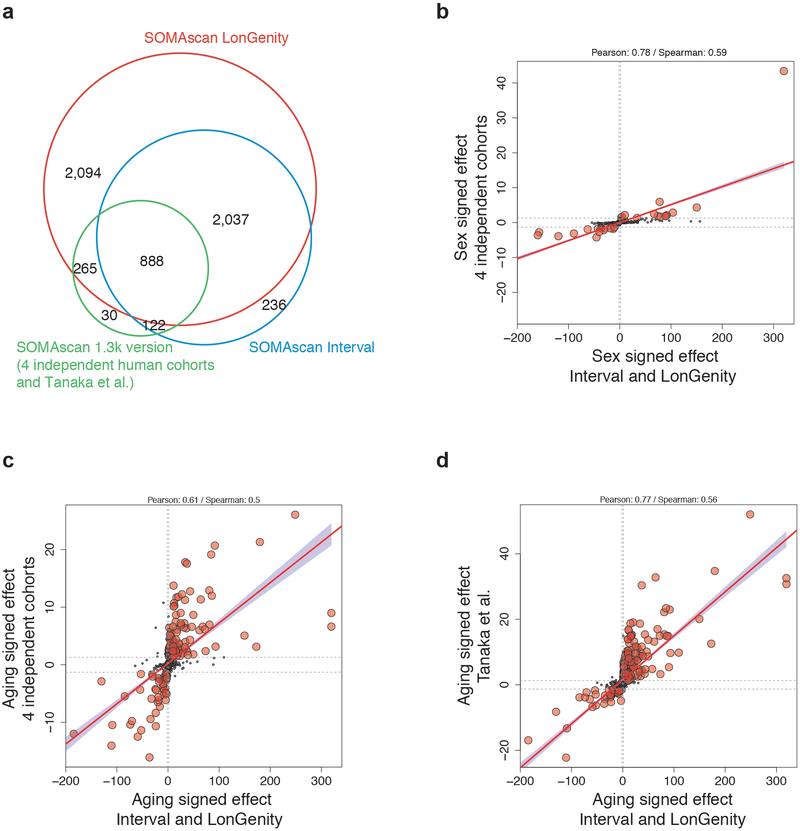
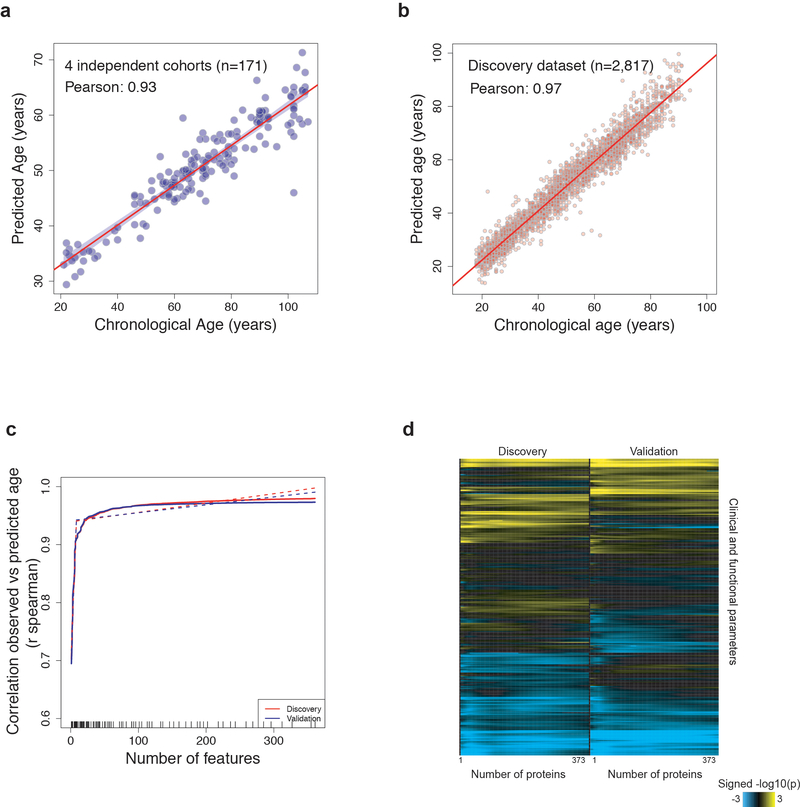
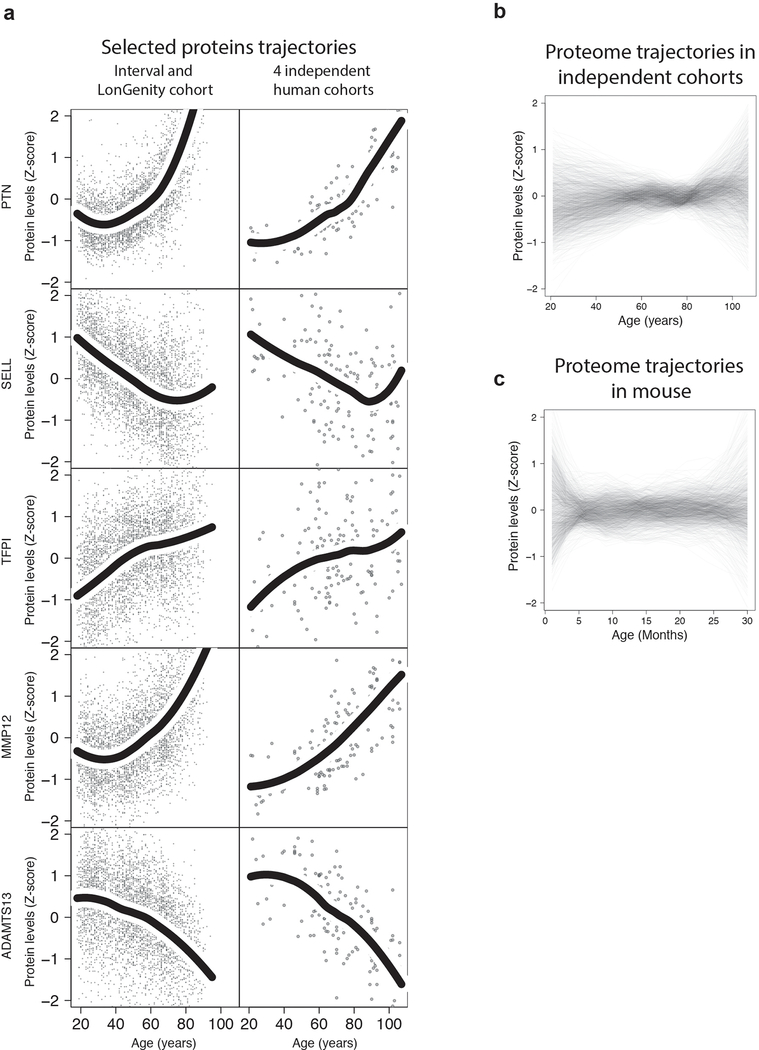
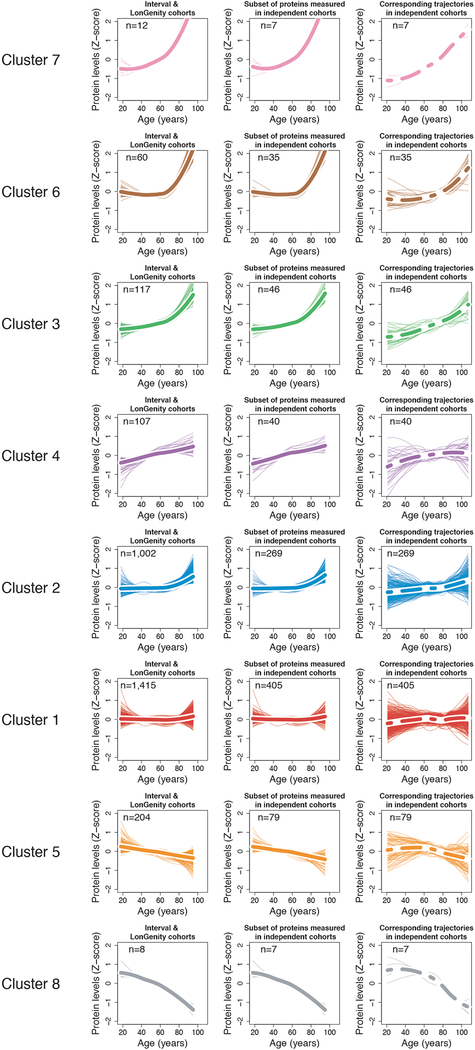
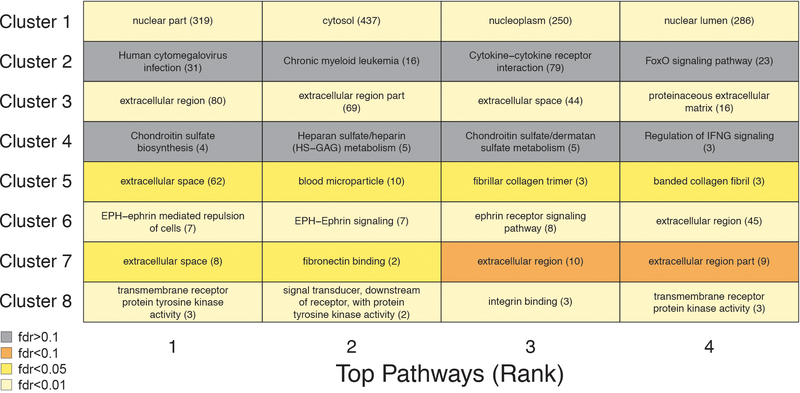
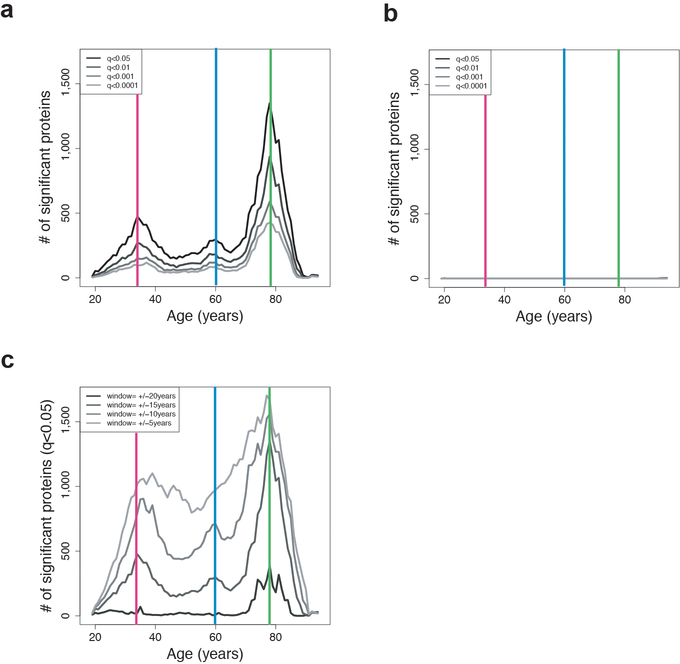
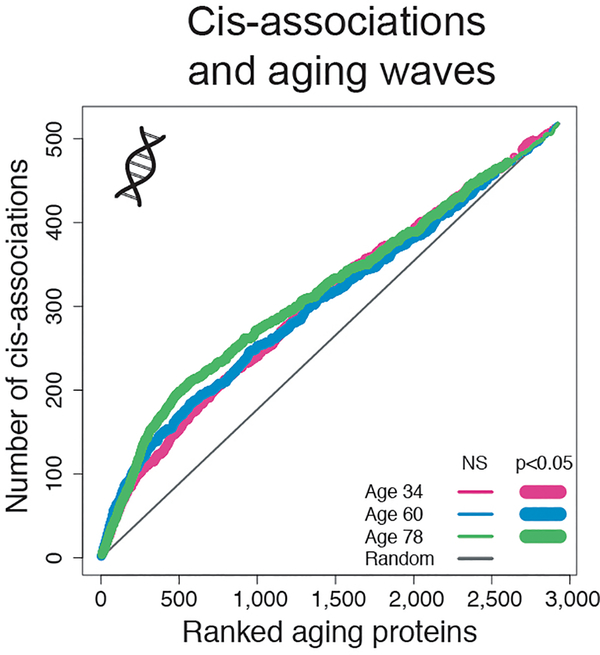
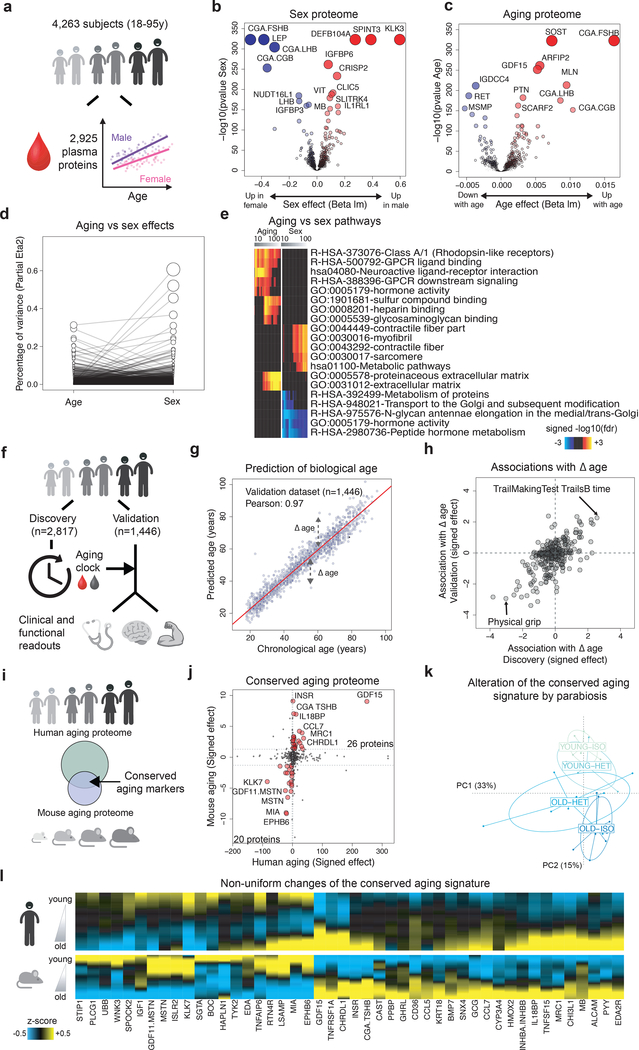
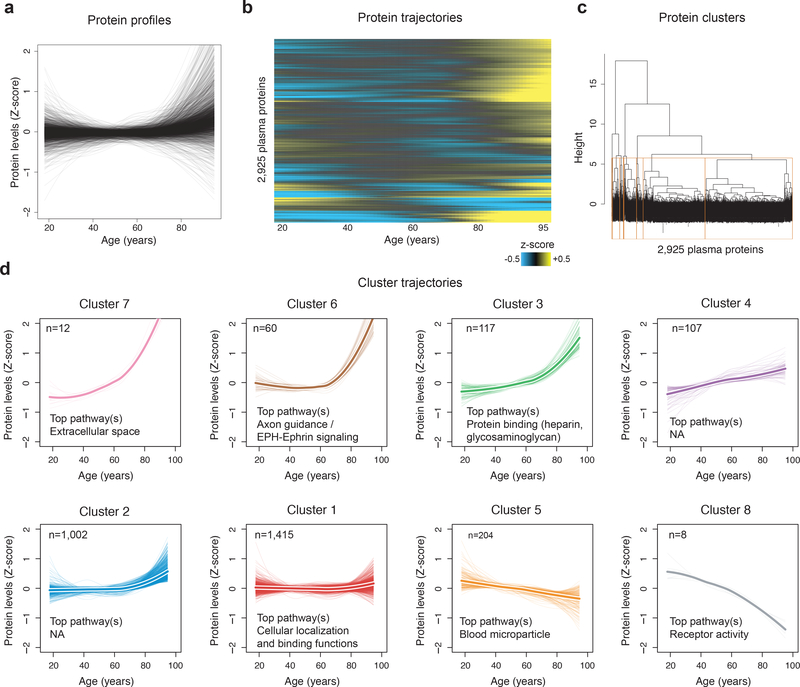
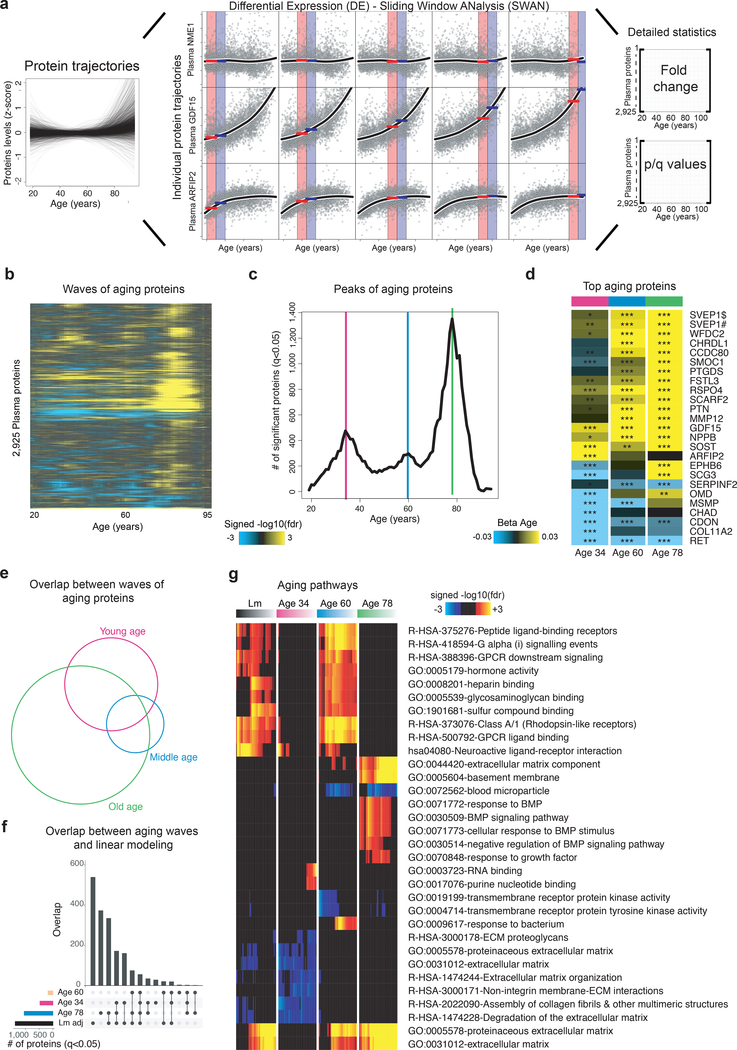
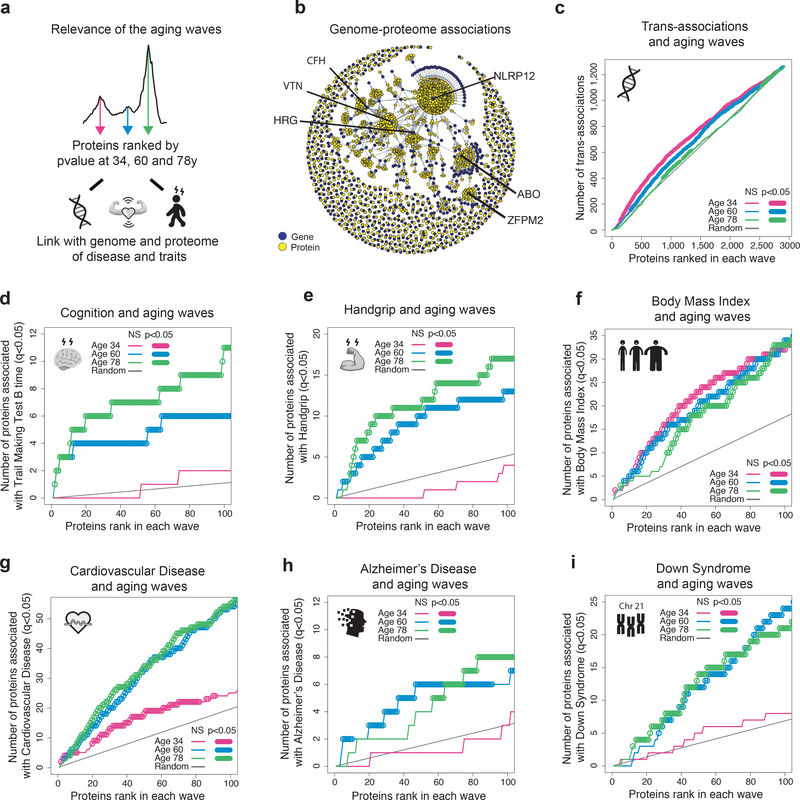
Aging is a predominant risk factor for several chronic diseases that limit healthspan1. Mechanisms of aging are thus increasingly recognized as potential therapeutic targets. Blood from young mice reverses aspects of aging and disease across multiple tissues2-10, which supports a hypothesis that age-related molecular changes in blood could provide new insights into age-related disease biology. We measured 2,925 plasma proteins from 4,263 young adults to nonagenarians (18-95 years old) and developed a new bioinformatics approach that uncovered marked non-linear alterations in the human plasma proteome with age. Waves of changes in the proteome in the fourth, seventh and eighth decades of life reflected distinct biological pathways and revealed differential associations with the genome and proteome of age-related diseases and phenotypic traits. This new approach to the study of aging led to the identification of unexpected signatures and pathways that might offer potential targets for age-related diseases.


Conflict of interest statement

Competing Interests

The authors declare no competing financial interests.

Figures

Extended Data Fig. 1
Extended Data Fig. 1. Sample demographics
Age (a, b), cohort (a, b) and sex distributions (c) of the 4,263 subjects from the INTERVAL and LonGenity cohorts. (d) Age and cohort distributions of the 171 subjects from the 4 independent cohorts.
Extended Data Fig. 2
Extended Data Fig. 2. Comparing age and sex effects in independent cohorts
(a) Age and sex effects in the INTERVAL and LonGenity studies (n=4,263) were compared to age and sex effects in 4 independent cohorts analyzed together (n=171) and to age effect from Tanaka et al. (n=240, 2018) The aging plasma proteome was measured with the SomaScan assay in these cohorts and 888 proteins were measured in all studies (b) Scatter plot representing the signed -log10(q value) of the sex effect in the INTERVAL/LonGenity cohorts (x axis, n=4,263) vs the 4 independent cohorts (y-axis, n=171). Similar analysis for the age effect in the 4 independent cohorts (c, n=171) and in Tanaka et al study (d, n=240)
Extended Data Fig. 3
Extended Data Fig. 3. Deeper investigation of the aging proteomic clock
a) Prediction of age in the 4 independent cohorts (n=171) using the proteomic clock. Only 141 proteins out of the 373 constituting the clock were measured in these samples. (b) Prediction of age in the discovery cohort (n=2,817) using the 373 plasma markers. (c) Feature reduction of the aging model in the Discovery and Validation cohorts to estimate whether a subset of the aging signature can provide similar results to the 373 aging proteins. Dashed lines represent a broken stick model and indicate the best compromise between number of variables and prediction accuracy. (d) Heatmap representing the associations between delta age and 334 clinical and functional variables. For quantitative traits, linear models adjusted for delta age, age and sex were used and significance was tested using F-test. For binary outcomes, binomial generalized linear models adjusted for delta age, age and sex were used and significance was tested using likelihood ratio chi-square test. As in (c) the analysis was performed for the top 2 to top 373 variables predicting age. The non-uniformity in the heatmaps suggests that specific subsets of proteins may best predict certain clinical and functional parameters
Extended Data Fig. 4
Extended Data Fig. 4. Proteins and proteome undulations in independent human cohorts and in mouse
(a) Trajectories of 5 selected proteins based on the INTERVAL and LonGenity cohorts (n=4,263, left) and 4 independent human cohorts (n=171, right). Trajectories were estimated using LOESS regression. Undulation of the 1,305 plasma proteins measured in 4 independent cohorts (b, n=171) and in mouse (c, n=81). Plasma proteins levels were z-scored and LOESS regression was fitted for each plasma factor.
Extended Data Fig. 5
Extended Data Fig. 5. Cluster trajectories in independent cohorts
Protein trajectories for the 8 clusters identified in the INTERVAL and LonGenity cohorts (left column). Thicker lines represent the average trajectory for each cluster. Cluster trajectories for the subset of proteins measured in the 4 independent cohorts (middle column). Corresponding cluster trajectories in 4 independent cohorts (right column).
Extended Data Fig. 6
Extended Data Fig. 6. Pathways in clusters
Pathway enrichment was tested using GO, Reactome and KEGG databases (n=4,263). Enrichment was tested using Fisher’s exact test (GO) and hypergeometric test (Reactome and KEGG). The top 4 pathways for each cluster are shown. Pathway IDs and number of plasma proteins associated are represented in the table.
Extended Data Fig. 7
Extended Data Fig. 7. DE-SWAN age effect for multiple q-values cutoffs, windows size and after phenotypes permutations
Different Q-value cutoffs are represented in (a). Similar analysis with different after phenotype permutations (b) and different windows size in (c). The 3 local peaks identified at age 34, 60 and 78 are indicated by colored vertical lines.
Extended Data Fig. 8
Extended Data Fig. 8. Cis-associations and aging waves
Enrichment for cis-association in the waves of aging proteins identified by DE-SWAN. Aging proteins were ranked based on p-values at age 34, 60 and 78 and the cumulative number of cis-associations was counted. One-sided permutation tests (1e+5 permutations) were used to assess significance.
Figure 1:
Figure 1:. Linear modeling links the plasma proteome to functional aging and identifies a conserved aging signature.
(a) Schematic representation of analysis of the plasma proteome. Volcano plots representing changes of the plasma proteome (n=4,263) with sex (b) and age (c). Linear models, adjusted for age, sex and subcohort were tested using F-test. (d) Relative percentage of variance explained by age and sex. Values for each plasma protein are connected by edges. (e) Pathways associated with sex and age identified by Sliding Enrichment Pathway Analysis (SEPA, n=4,263). Proteins upregulated and downregulated are analyzed separately. The top 10 pathways per condition are represented. Enrichment was tested using Fisher’s exact test (GO) and hypergeometric test (Reactome and KEGG). (f) Schematic representation of the of biological age modeling using the plasma proteome. (g) Prediction of age in the validation cohort (n=1,446) using 373 plasma proteins. Pearson correlation coefficient between chronological and predicted age is indicated. (h) Association between delta age (difference between chronological age and chronological age) and functional readouts in old. Top associations in both Discovery and Validation datasets are represented. (i) Schematic representation of the comparison between the human and mouse aging proteomes. (j) Conserved markers of aging. Both human and mouse aging effects are signed by the beta age of their corresponding linear analysis. Forty-six plasma proteins are changing in the same direction in mouse and humans (red dots) and define a conserved aging signature. (k) Alteration of the conserved aging signature by parabiosis. Normed principal component analysis was used to characterize changes of the conserved aging signature when mice are exposed to young or old blood. (l) Age-related changes of the conserved aging signature. Plasma protein levels were z-scored and aging trajectories were estimated by locally estimated scatterplot smoothing.
Figure 2:
Figure 2:. Clustering of protein trajectories identifies linear and non-linear changes during aging.
(a) Protein trajectories during aging. Plasma protein levels were z-scored and trajectories of the 2,925 plasma proteins were estimated by LOESS. (b) Trajectories are represented in two dimensions by a heatmap and unsupervised hierarchical clustering was used to group plasma proteins with similar trajectories. (c) Hierarchical clustering dendrogram. The 8 clusters identified are represented by orange boxes. (d) Protein trajectories of the 8 identified clusters. Clusters are grouped by the similarity of global trajectories, the thicker lines representing the average trajectory for each cluster. The number of proteins and the most significant enriched pathways are represented for each cluster. Pathway enrichment was tested using GO, Reactome and KEGG databases. The top 20 pathways for each cluster are listed in Supplementary Table 12.
Figure 3:
Figure 3:. Sliding window analysis distinguishes waves of aging plasma factors.
(a) Differential Expression - Sliding Window ANalysis (DE-SWAN). DE-SWAN compares proteins levels between groups of individuals in parcels of 10 years, e.g. 30–40 compared with 40–50. DE-SWAN identifies linear and non-linear changes during aging. Examples of the DE-SWAN for 3 proteins and 5 age windows. Red and blue rectangles show the two parcels and the red and blue lines symbolize the mean within each parcel. DE-SWAN provides statistics for each age window and each plasma protein, allowing detailed analysis of plasma proteomic changes during aging. (b) Waves of aging plasma proteins characterized by DE-SWAN (n=4,263). Within each window, −log10(p-values) and −log10(q-values) were estimated by linear modeling adjusted for age and sex and significance was tested using F-test. Local changes attributable to age were signed based on corresponding beta age. (c) Number of plasma proteins differentially expressed during aging. Three local peaks at the ages of 34, 60 and 78 were identified by DE-SWAN. (d) Top 10 plasma proteins identified by DE-SWAN at age 34, 60 and 78 (n=4,263). Linear models adjusted for age, sex and subcohort were used and significance was tested using F-test. Blue and yellow colors represent local decrease and increase, respectively. # and $ indicate different SOMAmers targeting the same protein. * q<0.05, ** q<0.01, *** q<0.001. (e) Intersections between waves of aging proteins (n=4,263, q<0.05). Linear models adjusted for age, sex and subcohort were used and significance was tested using F-test. (f) Intersections between linear modeling and the aging waves (n=4,263, q<0.05). Linear models adjusted for age, sex and subcohort were used and significance was tested using F-test. (g) Visualization of pathways significantly enriched for aging proteins identified by linear modeling and DE-SWAN at age 34, 60 and 78 (n=4,263). Proteins upregulated and downregulated were analyzed separately. The top 10 pathways per condition are represented. Enrichment was tested using Fisher’s exact test (GO) and hypergeometric test (Reactome and KEGG).
Figure 4:
Figure 4:. Waves of aging proteins are differentially linked to the genome and proteome of disease and traits
(a) Relevance of the aging waves. Schematic representation of analysis. The proteins changing at 34, 60 and 78y were ranked by p-value and were associated with the genome and the proteome of disease and traits. (b) Association between the genome and the proteome. Network created using the pQTL associations identified by Sun et al. (2018). (c) Enrichment for trans-association in the waves of aging proteins identified by DE-SWAN. Aging proteins at age 34, 60 and 78y were ranked based on p-value and the cumulative number of trans-associations was enumerated. One-sided permutation tests (1e+5 permutations) were used to assess significance. Enrichment for proteins involved in cognitive and physical performance in the waves of aging proteins (d-e). Enrichment for disease-associated proteins in the waves of aging proteins (f-i).

References

    1. Harman D The aging process: major risk factor for disease and death. Proc Natl Acad Sci U S A 88, 5360–5363 (1991). - PMC - PubMed
    1. Baht GS, et al. Exposure to a youthful circulaton rejuvenates bone repair through modulation of beta-catenin. Nat Commun 6, 7131 (2015). - PMC - PubMed
    1. Conboy IM, et al. Rejuvenation of aged progenitor cells by exposure to a young systemic environment. Nature 433, 760–764 (2005). - PubMed
    1. Huang Q, et al. A Young Blood Environment Decreases Aging of Senile Mice Kidneys. J Gerontol A Biol Sci Med Sci 73, 421–428 (2018). - PubMed
    1. Katsimpardi L, et al. Vascular and neurogenic rejuvenation of the aging mouse brain by young systemic factors. Science 344, 630–634 (2014). - PMC - PubMed

Methods-only References

    1. Mehan MR, et al. Protein signature of lung cancer tissues. PloS one 7, e35157 (2012). - PMC - PubMed
    1. Britschgi M, et al. Modeling of pathological traits in Alzheimer’s disease based on systemic extracellular signaling proteome. Mol Cell Proteomics 10, M111 008862 (2011). - PMC - PubMed
    1. Franceschi C, et al. Genetics of healthy aging in Europe: the EU-integrated project GEHA (GEnetics of Healthy Aging). Ann N Y Acad Sci 1100, 21–45 (2007). - PubMed
    1. Fox J & Weisberg S An R Companion to Applied Regression, (SAGE Publications, 2011).
    1. Benjamini Y & Hochberg Y Controlling the False Discovery Rate: A Practical and Powerful Approach to Multiple Testing. Journal of the Royal Statistical Society. Series B (Methodological) 57, 289–300 (1995).

Publication types