. 2019 Dec;25(12):1873-1884.
doi: 10.1038/s41591-019-0672-3. Epub 2019 Dec 5.

Human SNORA31 variations impair cortical neuron-intrinsic immunity to HSV-1 and underlie herpes simplex encephalitis

Affiliations

Human SNORA31 variations impair cortical neuron-intrinsic immunity to HSV-1 and underlie herpes simplex encephalitis

Fabien G Lafaille et al. Nat Med. 2019 Dec.

Abstract

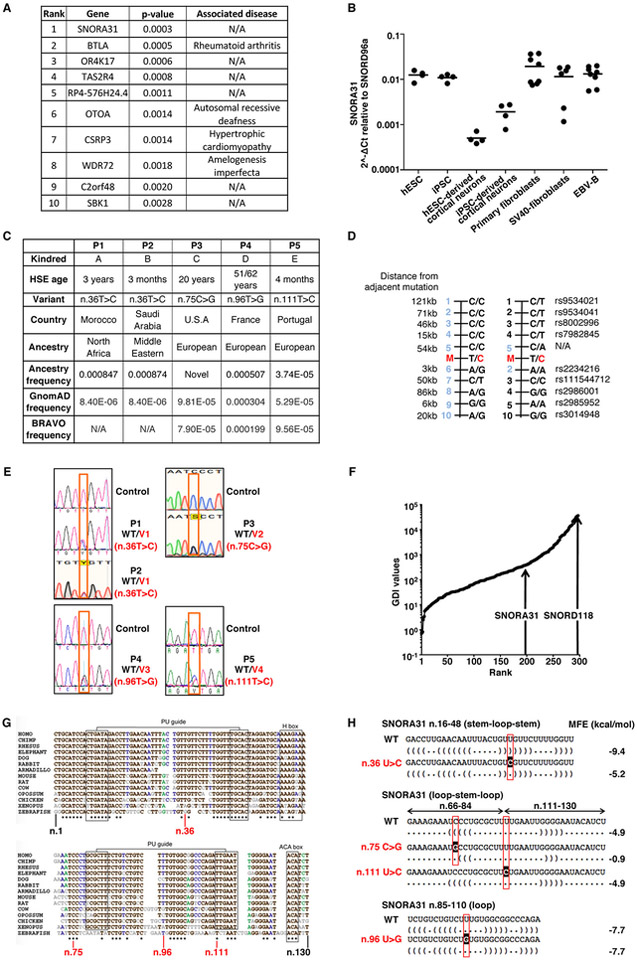
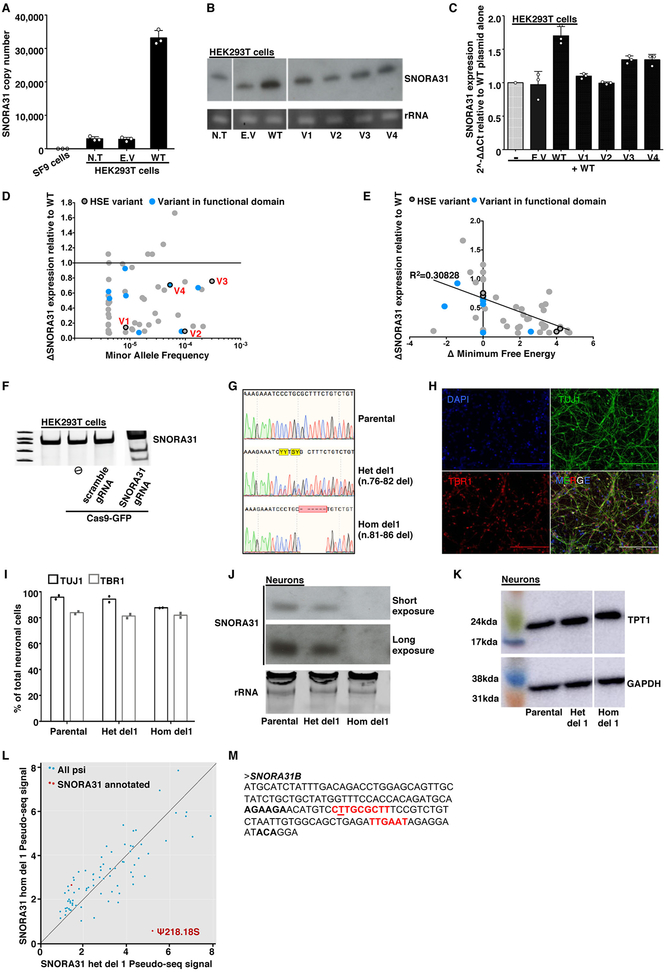
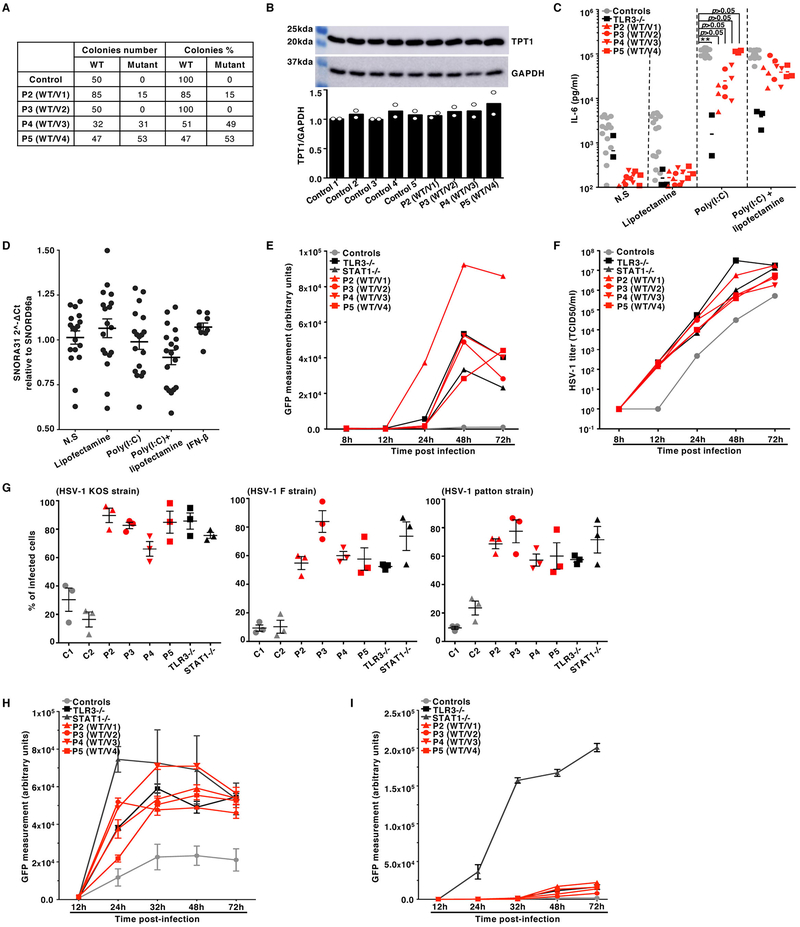
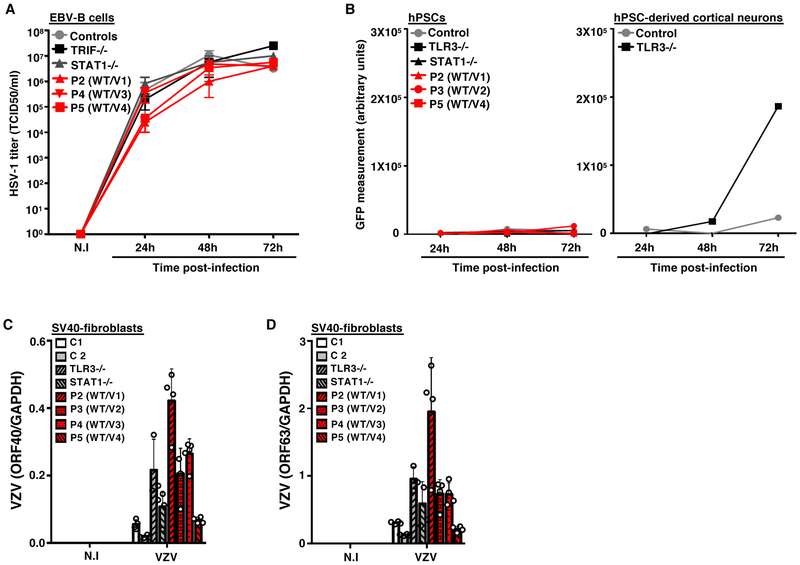
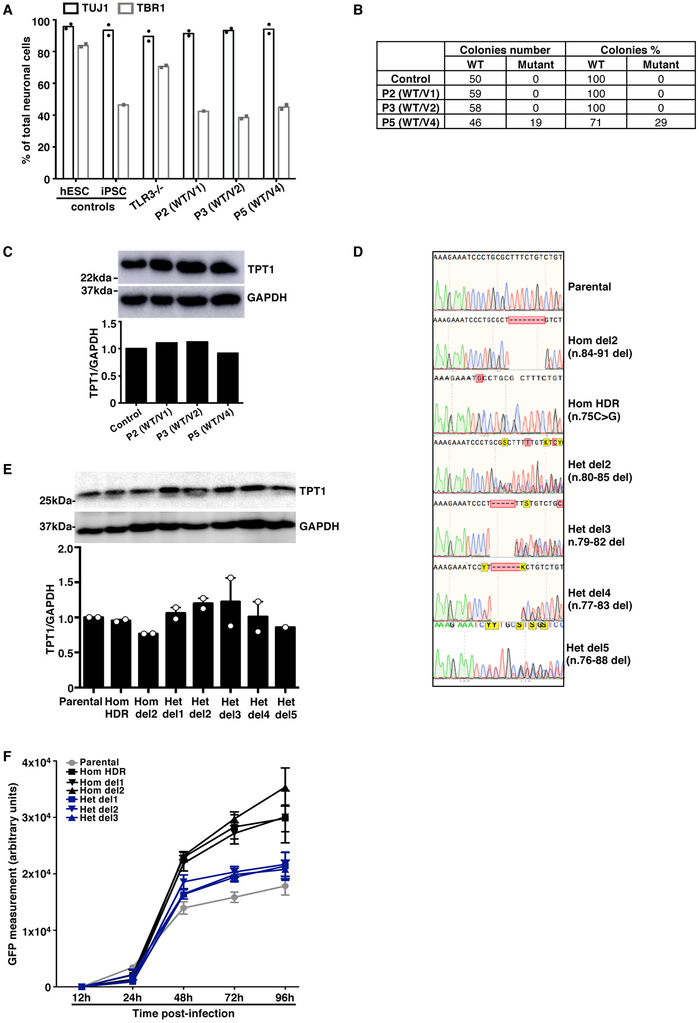
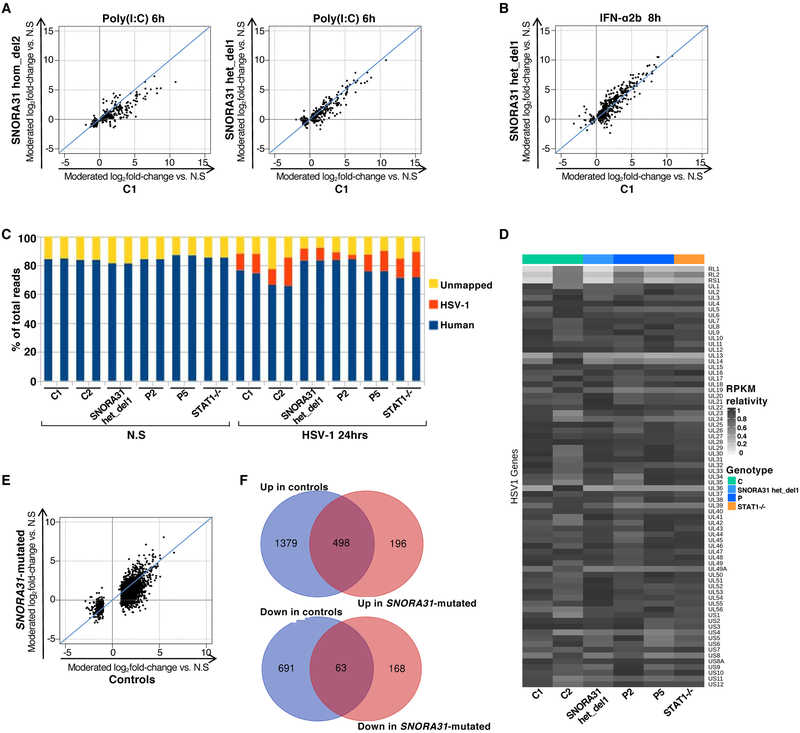
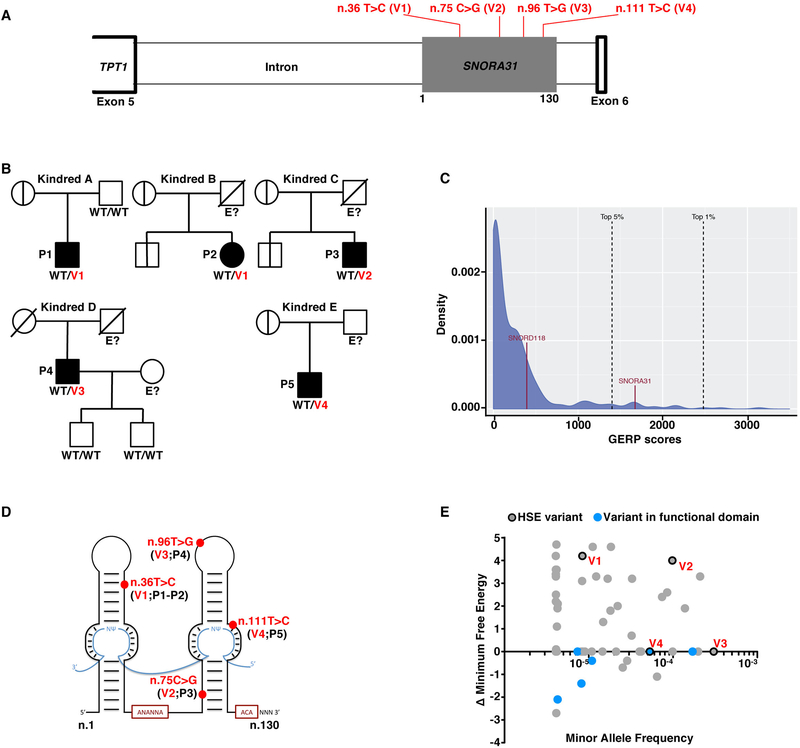
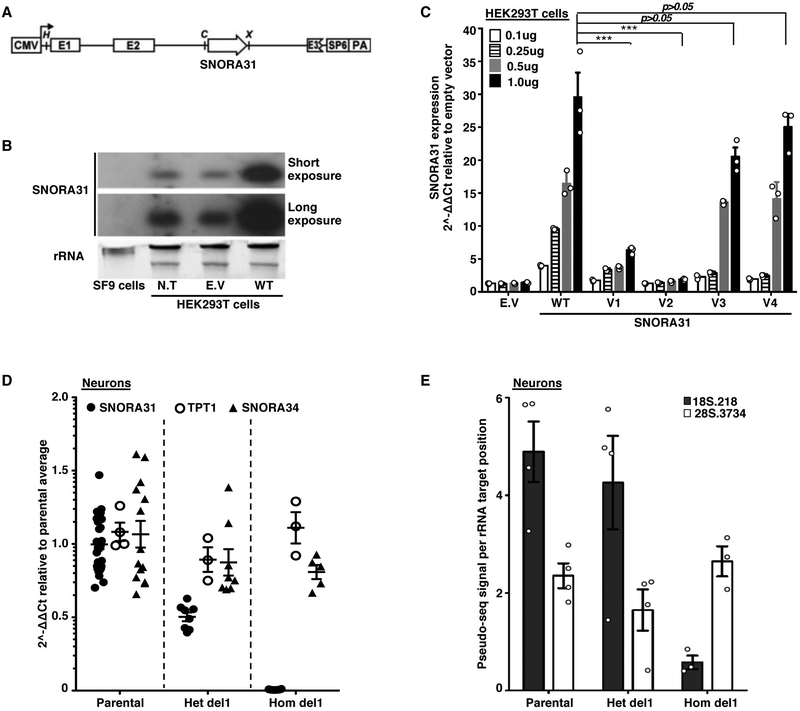
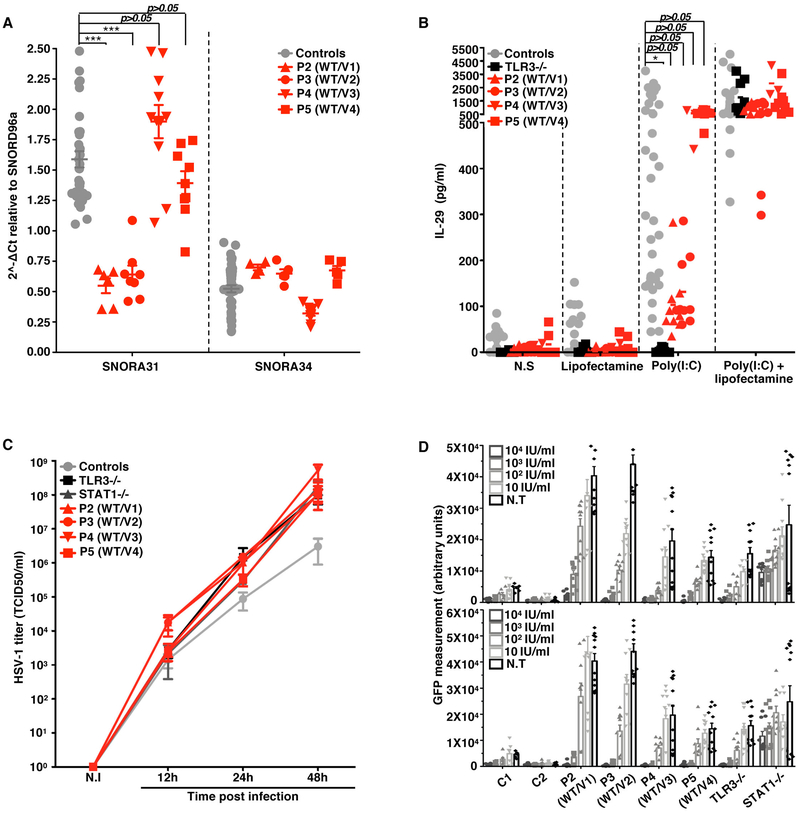
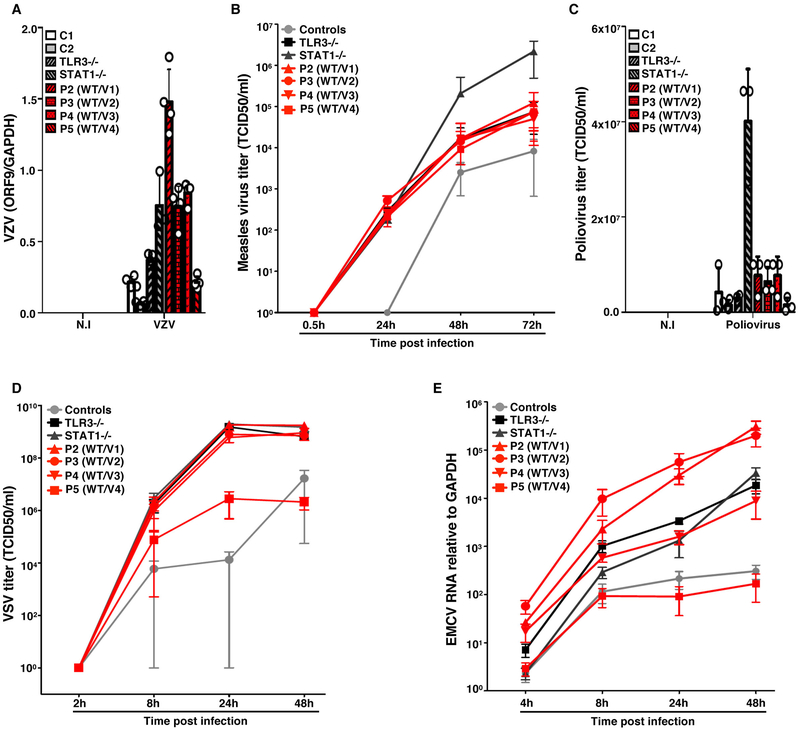
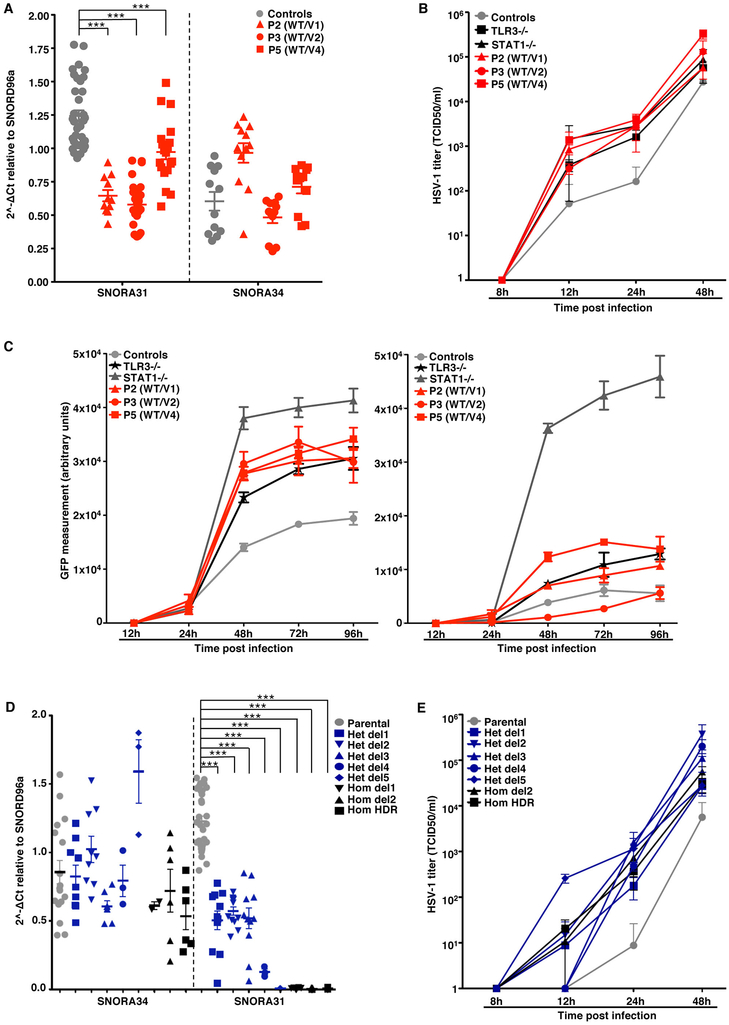
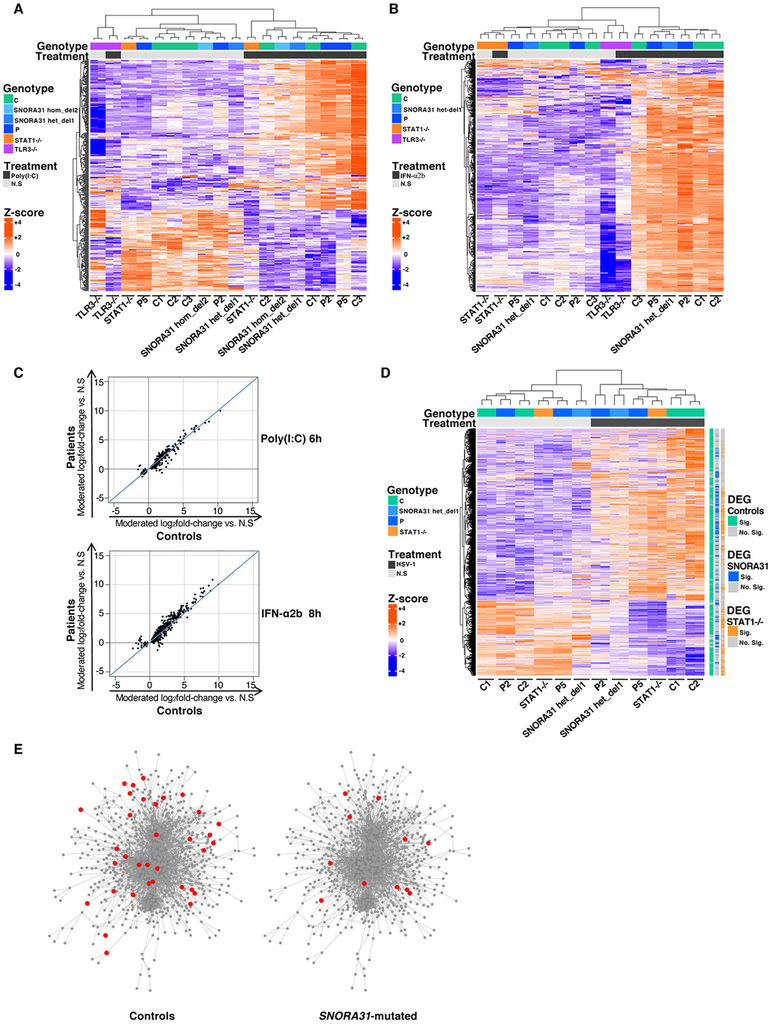
Herpes simplex virus-1 (HSV-1) encephalitis (HSE) is typically sporadic. Inborn errors of TLR3- and DBR1-mediated central nervous system cell-intrinsic immunity can account for forebrain and brainstem HSE, respectively. We report five unrelated patients with forebrain HSE, each heterozygous for one of four rare variants of SNORA31, encoding a small nucleolar RNA of the H/ACA class that are predicted to direct the isomerization of uridine residues to pseudouridine in small nuclear RNA and ribosomal RNA. We show that CRISPR/Cas9-introduced bi- and monoallelic SNORA31 deletions render human pluripotent stem cell (hPSC)-derived cortical neurons susceptible to HSV-1. Accordingly, SNORA31-mutated patient hPSC-derived cortical neurons are susceptible to HSV-1, like those from TLR3- or STAT1-deficient patients. Exogenous interferon (IFN)-β renders SNORA31- and TLR3- but not STAT1-mutated neurons resistant to HSV-1. Finally, transcriptome analysis of SNORA31-mutated neurons revealed normal responses to TLR3 and IFN-α/β stimulation but abnormal responses to HSV-1. Human SNORA31 thus controls central nervous system neuron-intrinsic immunity to HSV-1 by a distinctive mechanism.


Conflict of interest statement

Declaration of Interests

The authors have no competing interests to declare.

Figures

Extended Data Fig. 1
Extended Data Fig. 1. Heterozygous SNORA31 mutations in HSE patients from five unrelated kindreds
A) Ranking of the top 10 mutated genes for which enrichment was detected in the HSE cohort (205 patients) versus 4,267 controls. The selection filters for the variants were: MAF ExAC<0.001 and CADD>MSC. This represents 1,274,230 variants in 20,691 genes. For each gene, the number of affected individuals among HSE cases and controls was determined. Individuals were considered affected if they carried at least one mutant allele passing the filters. The genes were ranked by p-values adjusted for ethnic heterogeneity, which was obtained by logistic regression comparing cases and controls adjusted for the three principal components and using the likelihood ratio test (see Methods for more details). B) Expression of snoRNA31 across the different cell types tested. N=4 (for hESC, iPSC, hESC-derived cortical neurons, iPSC-derived cortical neurons), n=6 (SV40-fibroblasts) or n=8 (for primary fibroblasts, EBV-B) biological replicates were tested per cell type, in a single experiment. Each point represents one biological replicate. Means from the biological replicates are indicated with centre lines. C) Patient origin, age at the time of the HSE event, and the MAF of the SNORA31 variant in the GnomAD and BRAVO databases. The ancestry frequencies of the n.36T>C variant were determined from WES data for 500 Moroccan individuals and 1,100 Saudi Arabian individuals. D) Genomic haplotypes of the n.36 T>C regions in kindreds A and B. The n.36 T>C mutation occurred independently in kindreds A and B. Genotypes for the mutation (M, in red) and 10 informative SNPs (black) are represented. Different haplotypes were found in kindreds A and B. E) Histogram representation of the patient-specific SNORA1 mutations, confirmed by Sanger sequencing on genomic DNA from leukocytes and/or fibroblasts from the 5 patients and a healthy control wild type (WT) for SNORA31. F) Plot of GDI values for all reported snoRNA genes (from Ensembl) against their rank, from the least to the most mutated, in the general population (1000 Genomes database). The ranks of SNORA31 and SNORD118 are indicated. G) Phylogenic conservation of the genomic sequence of SNORA31 across 14 different vertebrate species. The data were taken from the snoRNABase (www.snorna.biotoul.fr). Invariant residues are indicated by asterisks below the sequence. Residues conserved in at least 78% of the species are indicated in black. Residues conserved in at least 64% of the species are indicated in blue. Residues conserved in at least 57% of the species are indicated in green. All other residues are indicated in gray. The positions of the variants found in the HSE patients are indicated in red below the sequence. H) Minimum free energy (MFE) of a SNORA31 stem (n.66-84; n.111-130) or loop (n.16-48 and n.85-110), for WT or mutated sequences. The MFE was calculated with the RNAfold program (www.rna.tbi.univie.ac.at). The dot-bracket sequence of SNORA31 is indicated under each nucleotide. The location of each mutation is indicated in red and highlighted.
Extended Data Fig. 2
Extended Data Fig. 2. Expression of WT and mutant SNORA31 in HEK293T cells and in isogenic hESC-derived neurons
A) Quantification, by qPCR, of SNORA31 copy numbers in 293T cells transfected with an empty plasmid or a plasmid containing the WT sequence of SNORA31. Copy numbers were calculated from a standard curve. Insect SF9 cells were used as a negative control in this experiment as they contain no SNORA31 homolog. N.T: not transfected. E.V: empty vector. Means and standard deviations from n=3 independent experiments are shown. B) Northern blot of SNORA31 in HEK293T cells either not transfected or transfected with an empty vector or a vector containing WT or mutant SNORA31. Cropped images from the same blot are shown. The data presented are representative of n=2 independent experiments. C) RT-qPCR quantification of the fold-change in SNORA31 expression in HEK293T cells. Cells were transfected with a vector containing WT SNORA31 alone or cotransfected with the same amount of empty vector and a vector containing the WT or one of the HSE SNORA31 mutant sequences. The data are expressed relative to SNORD96a expression and normalized relative to the expression of SNORA31 in HEK293T cells transfected with WT SNORA31 vector alone. Means and standard deviations from n=3 independent experiments are shown. D) Plots of the relative expression levels of gnomAD SNORA31 mutant alleles (normalized relative to WT SNORA31 expression level) against minor allele frequency in gnomAD. RT-qPCR quantification of gnomAD SNORA31 mutant allele expression in HEK293T cells transfected with vectors containing each of the mutant alleles. The data are expressed relative to the expression of endogenous SNORD96a and normalized relative to that of SNORA31 in cells transfected with a plasmid carrying the WT sequence. The expression levels of each gnomAD variant were assessed in n=2 independent experiment, and the mean value for each variant is shown as a dot. E) Plot of the relative levels of expression of gnomAD SNORA31 mutant alleles (normalized relative to WT SNORA31 expression levels) against their calculated change in minimum free energy. The expression levels of each gnomAD variant were assessed in n=2 independent experiment, and the mean value for each variant is shown as a dot. F) Surveyor assay for full-length SNORA31 PCR in HEK293T cells transfected with Cas9-GFP vector alone (⦸) or together with a scrambled guide RNA (gRNA) vector, or a SNORA31 gRNA vector. The data shown is representative of data from n=2 independent experiments. G) Histogram representation of the CRISPR-Cas9-introduced homozygous or heterozygous SNORA1 mutations (het del1 n.76-82, hom del1 n.81-86), confirmed by Sanger sequencing on genomic DNA from the gene-edited hESC lines. Sequencing results from the parental line is also shown. H) Demonstration of the CNS cortical identity (TBR1-positive) of neurons (TUJ1-positive) differentiated from the hESC control line H9. The images shown are representative of data from n=6 independent experiments. I) Quantification of the proportion of cortical neurons among total neurons based on the immunostaining of parental and gene-edited hESCs harboring either a heterozygous (het del1) or a homozygous (hom del1) deletion in SNORA31. Results from technical duplicates from a single experiment are shown, representative of n=3 independent neuron differentiations for each line. J) Northern blot of SNORA31 expression in isogenic hESC-derived CNS neurons. SNORA31 expression in parental cells is compared to that in cells carrying heterozygous del 1 (het del1) or homozygous del 1 (hom del1) in the genomic sequence of SNORA31. The data presented are representative of n=2 independent experiments. K) Levels of TPT1 protein, encoded by the host gene of SNORA31, as assessed on western blots for isogenic CNS neurons. Cropped images from the same blot are shown. GAPDH was used as a loading control. The data are representative of n=2 independent experiments. L) Pseudouridylation data obtained by pseudo-seq. Each point represents a pseudouridylation site. Mean values from n=4 libraries each for the parental and het del1 lines and n=3 libraries for the hom del1 line are shown. M) Genomic sequence of SNORA31B. The guide sequences for this putative snoRNA gene are highlighted in red.
Extended Data Fig. 3
Extended Data Fig. 3. Cellular phenotypes of the SV40-fibroblasts of patients with SNORA31 mutations
A) Sequencing results for SNORA31 cDNA from the SV40-fibroblasts of four patients (P2-P5), after cloning in E. coli. The number of individual WT or mutant colonies detected by sequencing is indicated on the left of the table, whereas the corresponding percentage is indicated on the right. B) Levels of TPT1 protein (upper panel), encoded by the host gene of SNORA31, in the patient and control SV40-fibroblasts, as measured by western blotting. GAPDH was used as a loading control (middle panel). The data presented are representative of n=2 independent experiments. Semi-quantification of TPT1 band density relative to GPADH was performed and the data are shown in the lower panel. C) IL-6 production in SV40-fibroblasts from patients (P2-P5), a TLR3−/− control, and five healthy controls, as measured by ELISA, in the supernatant of control and patient SV40-fibroblasts stimulated with 25 ng/mL poly(I:C) alone, Lipofectamine alone, or both. TLR3−/− cells were used as a negative control for the poly(I:C) response. N.S: not stimulated. N=3 independent experiments were performed, with n=1 biological replicate per cell line tested per experiment. Each point represents one biological replicate. The means of the three independent experiments are shown. The levels of IL-6 production upon poly(I:C) stimulation are compared between controls’ and patients’ cells, in one way ANOVA (F=1.403, total df=29) followed by Dunnett’s multiple comparison tests. ** 0.001<p<0.01. D) Relative expression levels for SNORA31, as determined by RT-qPCR after stimulation with poly(I:C) or IFN-β in control SV40-fibroblasts. The data are expressed relative to SNORD96a expression. N=3 independent experiments were performed, with n=3 (for IFN-β stimulation) or n=6 (all other conditions) biological replicates tested per experiment. Each point represents one biological replicate. Means and standard deviations from three independent experiments are shown. E, F) HSV-1 (strain KOS) abundance, as determined by measurements of GFP-capsid expression in SV40-fibroblasts at the indicated time points post infection with a MOI of 0.01 (E) followed by measurements of the corresponding titers, as determined by calculating the 50% end point (TCID50) in Vero cells (F), for four SNORA31-deficient patients (P2-P5), a TLR3−/− patient and a STAT1−/− patient as susceptible controls, and two healthy controls. Mean values from n=2 independent experiments are shown. N=1 (for TCID50 assay) or n=3 (for measurement of GFP-capsid expression) biological replicates were tested per condition per experiment. G) Percentage of patient and control SV40-fibroblasts producing capsids 24 hours post infection with HSV-1 strain KOS (left), F (middle) or Patton (right) at a MOI of 3 (based on titers measured on Vero cells). Means and standard deviations of n=3 independent experiments are shown. N=1 biological replicate was tested per condition per experiment. H, I) HSV-1 (strain KOS) abundance, as determined by measurements of GFP-capsid expression in patient (P2-P5) and control SV40-fibroblasts at the indicated time points following infection at a MOI of 0.1, without (H) and with (I) IFN-β pretreatment for 16 hours. STAT1−/− cells were used as a control with no IFN-β response. Means and standard deviations from n=3 independent experiments are shown. N=3 biological duplicates were tested per condition per experiment.
Extended Data Fig. 4
Extended Data Fig. 4. HSV-1 propagation in immortalized B cells and iPSCs from patients with SNORA31 mutations
A) Quantification of HSV-1 (strain KOS) in EBV-immortalized B cells from patients (P2, P4, P5), a TRIF−/− patient and a STAT1−/− patient, and healthy controls, at the indicated time points post infection with a MOI of 0.1. HSV-1 titers were determined by the TCID50 virus titration method. Means and standard deviations from n=3 independent experiments are shown. B) HSV-1 (strain KOS) abundance, as determined by measurements of GFP-capsid expression in iPSCs (left) at the indicated time points post infection with a MOI of 0.1, for three SNORA31-mutated patients (P2, P3, P5), a TLR3−/− patient and a STAT1−/− patient, and hESCs from a healthy control (H9 line). HPSC-derived cortical neurons from a TLR3−/− patient and a healthy control were assessed in the same assay (right). Mean values from n=2 independent experiments are shown. C, D) Expression levels of the VZV ORF40 (C) and ORF63 (D) transcripts, as measured by RT-qPCR on SV40-fibroblasts from patients (P2-P5), a TLR3−/− patient and a STAT1−/− patient, and healthy controls (C1 and C2), 48 h post exposure to VZV-infected MeWo cells (VZV) or MeWo cells that were not infected (N.I.). The data are expressed relative to GAPDH expression. Means and standard deviations from n=3 independent experiments are shown.
Extended Data Fig. 5
Extended Data Fig. 5. Characterization of CNS neurons derived from patient iPSCs and isogenic hESCs
A) Quantification of the proportion of neurons among total neuronal cells, based on immunostaining, for control hESC- and control iPSC-derived CNS neurons (H9 and J2) and for CNS neurons derived from the patients’ iPSCs. Results from technical duplicates from one experiment are shown, representative of n=3 neuron differentiations per line (H9, J1, J2 control lines, and iPSC lines from P2, P3 and P5). B) Sequencing results for the SNORA31 cDNA obtained from the patients’ iPSC-derived neurons, after cloning in E. coli. The number of individual WT or mutant colonies detected by sequencing is indicated on the left side of the table, whereas the corresponding percentage is indicated on the right. C) Levels of TPT1 protein, encoded by the host gene of SNORA31, in control (H9 hESC) and patient iPSC-derived neurons, as assessed by western blotting. GAPDH was used as a loading control. Results of semi-quantification of TPT1 expression levels relative to GAPDH are shown in the lower panel. The data presented are representative of n=2 independent experiments. D) Histogram representation of the CRISPR-Cas9-introduced homozygous or heterozygous SNORA1 mutations (hom del2 n.84-91, hom HDR n.75C>G, het del2 n.80-85, het del3 n.79-82, het del4 n.77-83, het del5 n.76-88), confirmed by Sanger sequencing on genomic DNA from the gene-edited hESC lines. Sequencing results from the parental line is also shown. E) Levels of TPT1 protein, encoded by the host gene of SNORA31, as measured by western blotting (upper panel), in CNS neurons derived from isogenic hESCs carrying a homozygous HDR-introduced patient-specific point mutation (hom HDR), a homozygous deletion (hom del1 or hom del2), or various heterozygous mutations (het del1, het del2, het del3, het del4, het del5) in SNORA31. GAPDH was used as a loading control (lower panel). The data presented are representative of n=3 independent experiments, with n=1 biological replicate tested per condition per experiment. Semi-quantification of TPT1 band density relative to GPADH was performed and the data are shown in the lower panel. F) Quantification of HSV-1 in isogenic hPSC-derived CNS neurons, at various time points after HSV-1 infection at a MOI of 1, as assessed by measuring GFP-capsid expression. Four healthy control lines were used in these experiments: two control hESC lines and two control iPSC lines. Means and standard deviations from n=3 independent experiments are shown.
Extended Data Fig. 6
Extended Data Fig. 6. Transcriptome responses to stimulation with poly(I:C), IFN-α2b or HSV-1 in SNORA31-mutated hPSC-derived cortical neurons
A, B) Scatter plots of fold-changes in RNA-Seq-quantified gene expression following stimulation with 25 μg/ml poly(I:C) for 6 hours (A) or 100 IU/ml IFN-α2b for 8 hours (B), in hPSC-derived cortical neurons from one healthy control H9 hESC line (C1) versus one isogenic SNORA31-mutated line (hom del2 or het del1). Moderated fold-changes are expressed relative to the corresponding mock-treated samples. Each point represents a single gene, and each plot includes genes identified as differentially expressed (FDR<=0.05) in response to the indicated stimulus relative to non-stimulated (N.S) samples in the isogenic control or SNORA31-mutated line. C) Transcriptome composition analysis of RNA-Seq-quantified gene expression, in hPSC-derived cortical neurons from healthy controls (C1 and C2), an isogenic SNORA31-mutated line, SNORA31-mutated patients (P2 and P5), and a STAT1−/− patient, with or without 24 hours of infection with HSV-1 at a MOI of 1. D) Heatmap of RNA-Seq-quantified HSV-1 transcript expression (RPKM relativity) in hPSC-derived cortical neurons from healthy controls (C1 and C2), SNORA31-mutated patients (P2 and P5), an isogenic SNORA31-mutated hESC line (het del1), and a STAT1−/− patient, following infection with HSV-1 for 24 hours at a MOI of 1. E) Scatter plot of averaged log2 fold-changes in gene expression by 24 hours of HSV-1 infection, in two healthy controls (C1, C2) versus hPSC-derived cortical neurons from three SNORA31-mutated lines (patient-specific lines from P2 and P5, and an isogenic SNORA31-mutated hESC line, SNORA31 het del1). Moderated fold-changes are expressed relative to the corresponding mock-treated samples. Each point represents a single gene, and the plot includes genes identified as differentially expressed (FDR<=0.05, >2-fold difference) in response to the indicated stimulus relative to N.S samples in the healthy control or SNORA31-mutated groups. F) Number of human transcripts up- or downregulated by HSV-1 infection in either or both of control (C1 and C2) and SNORA31-mutated (P2 and P5, and isogenic SNORA31 het del1 line) hPSC-derived cortical neurons.
Figure 1.
Figure 1.. Heterozygous SNORA31 mutations in herpes simplex encephalitis patients from five unrelated kindreds
A) Schematic representation of the genomic structure of human SNORA31. Human SNORA31 is located on chromosome 13, between exons 5 and 6 of the host gene TPT1. The mutations found in five HSE patients are shown in red: n.36T>C (V1) in patient 1 (P1) and P2; n.75C>G (V2) in P3; n.96T>G (V3) in P4; n.111T>C (V4) in P5. B) Family pedigrees with allele segregation in the five families. The patients, in black, are heterozygous for the following mutations (‘V’ in red): n.36T>C (V1) in kindreds A and B; n.75C>G (V2) in kindred C; n.96T>G (V3) in kindred D; n.111T>C (V4) in kindred E. Vertical bars indicate the same SNORA31 genotype as the patient from the corresponding family. “E?” indicates that the individual’s SNORA31 genotype is unknown. C) Conservation score ranking of the known human snoRNA genes, as assessed by the GERP++ method. Density (y-axis) of GERP scores (x-axis) for conserved elements overlapping snoRNAs. D) Schematic representation of the canonical secondary structure of H/ACA class snoRNAs, including snoRNA31. The positions of the patients’ SNORA31 variants are indicated in red. E) Frequency and predicted impact on the secondary structure of snoRNA31, as measured by the calculated change in minimum free energy of mutant sequences relative to wild type, for all variants found in gnomAD. All variants associated with a change in minimum free energy of more than 1 were considered possibly damaging.
Figure 2.
Figure 2.. Impaired expression of two SNORA31 variants found in three HSE patients and the loss of a ribosomal modification in SNORA31-null hESC-derived CNS neurons
A) Schematic diagram of the snoRNA expression vector, into which the wild-type (WT) or mutant sequences of SNORA31 were inserted. Upon expression of the beta-globulin transgene, the immature SNORA31 RNA is spliced at the E2-E3 intron and then processed by the cell machinery into a mature snoRNA molecule. B) Expression of WT snoRNA31 in HEK293T cells, with and without transient transfection with the WT SNORA31 plasmid, as assessed by northern blotting. Insect SF9 cells, which do not express a homolog of SNORA31, were used as a negative control in this experiment. N.T: not transfected. E.V: empty vector. The data are representative of n=2 independent experiments. C) RT-qPCR measurement of snoRNA31 expression in HEK293T cells transfected with the indicated amounts of WT or HSE patient-specific SNORA31 mutant plasmids. The data are expressed relative to SNORD96a expression, with normalization against empty vector transfection. Means and standard deviations from n=3 independent experiments are shown. Mean values of SNORA31 expression levels upon the same amount of WT or mutant plasmid transfection were compared in one-way ANOVA (F=47.51, total df=17) followed by Dunnett’s multiple comparison tests, and the results are shown for the highest amount plasmid transfection group. ***, p<0.001. D) RT-qPCR measurement of relative snoRNA31 expression levels, TPT1 mRNA, and an unrelated snoRNA, SNORA34, in isogenic hESC-derived CNS neurons carrying either a heterozygous deletion (het del1) or a homozygous deletion (hom del1) in SNORA31, or the WT allele (parental). For SNORA31 and SNORA34, data are expressed relative to SNORD96a and normalized relative to the mean value for control cells. For TPT1, the data are expressed relative to GUS mRNA, with normalization relative to the mean value for control cells. The mean and standard deviation from n=3 independent experiments are shown. Each point represents one biological replicate from an independendent experiment, with n=2 (for hom del1), n=3 (het del 1) or n=10 (parental) biological replicates per genotype tested for snoRNA31 expression per experiment. E) Quantification of the pseudo-seq signal at two different rRNA sites in isogenic hESC-derived CNS neurons, either WT for SNORA31 or carrying a heterozygous (het del 1) or homozygous (hom del 1) deletion in SNORA31. Means and standard deviations for n=4 libraries each for the parental and het del1 lines and n=3 libraries for the hom del1 line are shown.
Figure 3.
Figure 3.. Cellular phenotypes of the SV40-fibroblasts of patients with SNORA31 mutations
A) The expression of SNORA31, as measured by RT-qPCR in SV40-fibroblasts from patients (red dots) and four controls (grey dots). The data are expressed relative to SNORD96a expression. Means and standard deviations from three independent experiments are shown. Each point represents one biological replicate from an independent experiment, with n=2 (for P2) or n=3 (all other cell lines) biological replicates per cell line tested per experiment. Mean values were compared between control cells and cells from the patients, in one-way ANOVA (F=26.01, total df=65) followed by Dunnett’s multiple comparison tests. *** 0.0001<p<0.001. B) IL-29 production in SV40-fibroblasts from patients (P2-P5, red dots), a TLR3−/− control (black dots), and four healthy controls (grey dots), as measured by ELISA, in the supernatant of control and patient SV40-fibroblasts stimulated with 25 ng/mL poly(I:C) alone, Lipofectamine alone, or both. N.S: not stimulated. N=3 independent experiments were performed, with n=1 (for P4) or n=3 (all other cell lines) biological replicates per cell line tested per experiment. Means and standard deviations from three independent experiments are shown. Mean values were compared between control cells and cells from the patients, in one-way ANOVA (F=3.254, total df=84) followed by Dunnett’s multiple comparison tests. * 0.01<p<0.05. C) HSV-1 propagation in SV40-fibroblasts from patients (P2-P5), an autosomal recessive (AR) complete TLR3-deficient (TLR3−/−) and an AR complete STAT1-deficient (STAT1−/−) patient as susceptible controls, and two healthy controls. HSV-1 titers were determined at the indicated time points post infection, at a multiplicity of infection (MOI) of 0.001, as quantified by calculating the 50% end point (TCID50) in Vero cells. N.I: not infected. Means and standard deviations from n=3 independent experiments are shown. D) HSV-1 abundance was determined by assessing GFP-capsid expression in patient (P2-P5) and control (C1 and C2) SV40-fibroblasts 24 h post-infection at a MOI of 1. Cells were treated with the indicated doses of IFN-α2b (top) or IFN-β (bottom) for 16 hours before infection (N.T: not pretreated). STAT1−/− cells were used as a control displaying no response to IFN-β in this assay. N=3 independent experiments were performed, with n=3 biological replicates tested per condition per experiment. Means values from n=3 independent experiments are shown with standard deviations.
Figure 4.
Figure 4.. Transcription and propagation of various viruses in the SV40-fibroblasts of patients with SNORA31 mutations
A) Levels of VZV ORF9 transcript, as determined by RT-qPCR, on SV-40 fibroblasts from patients (P2-P5, red bars with black shadings), a TLR3−/− and a STAT1−/− patient (grey bars with black shadings), and healthy controls (C1 and C2, white and grey bars), 48 h after exposure to VZV-infected MeWo cells (VZV) or MeWo cells that were not infected (N.I). The data are expressed relative to GAPDH expression. Means and standard deviations from n=4 independent experiments are shown. N=1 biological replicate was tested per condition per experiment. B-D) Propagation of measles virus (B), poliovirus (C) and VSV (D), in SV40-fibroblasts from patients and two healthy controls at the indicated times post infection with measles virus at a MOI of 0.5, poliovirus at a MOI of 1, or VSV at a MOI of 1, as assessed by the TCID50 virus titration method. Means and standard deviations from n=3 independent experiments are shown. N=1 biological replicate was tested per condition per experiment. E) Expression levels of the 3D region of the EMCV genome, as measured by RT-qPCR in SV40-fibroblasts from patients (P2-P5), a TLR3−/− and a STAT1−/− patient as susceptible controls, and healthy controls, at the indicated times post infection with EMCV at a MOI of 0.1. The data are expressed relative to GAPDH expression. Means and standard deviations from n=3 independent experiments are shown. N=2 biological replicates were tested per condition per experiment.
Figure 5.
Figure 5.. Cellular phenotypes in CNS neurons derived from patient iPSCs and isogenic hESCs
A) Expression of SNORA31 and SNORA34, as measured by RT-qPCR in hPSC-derived CNS neurons for patients (P2, P3, P5) and controls. Four healthy control lines were used in the experiments: two control hESC lines and two control iPSC lines. Means and standard deviations from three independent experiments are shown. Each point represents one biological replicate, with n=3 (control lines) n=4 (P2), n=8 (P3) or n=6 (P5) biological replicates per cell line tested for snoRNA31 expression per experiment. Mean values were compared for SNORA31 expression between control cells and cells from the patients, in one-way ANOVA (F=50.84, total df=89)) followed by Dunnett’s multiple comparison tests. ***, p<0.001. B) Quantification of HSV-1 in CNS neurons derived from control and patient hPSCs, at the indicated times post infection at a MOI of 0.001, as quantified by the TCID50 virus titration method. TLR3−/− and STAT1−/− cells, which are highly susceptible to HSV-1, were used as controls. Means and standard deviations from n=3 independent experiments are shown. N=1 biological replicate was tested per condition per experiment. C) HSV-1 abundance was assessed by measuring GFP-capsid expression in iPSC-derived CNS neurons from patients (P2, P3, P5), a TLR3−/− patient and a STAT1−/− patient, and four healthy control lines. Measurements were made at the indicated times post infection with a MOI of 1, without (left) or with (right) IFN-β pretreatment for 16 hours. Means and standard deviations from n=3 independent experiments, with n=3 biological replicates for each set of conditions in each experiment, are shown. D) SNORA31 and SNORA34 expression in CNS neurons derived from gene-edited isogenic hESCs (blue and black dots) and the parental line hESCs (grey dots). Means and standard deviations from n=3 independent experiments are shown. Each point represents one biological replicate, with n=10 (for parental line), n=1 (het del4, het del5), n=2 (hom del1), n=3 (hom del2) or n=4 (het del1, het del2, het del3, hom HDR) biological replicates per genotype tested per experiment. Mean values were compared for SNORA31 expression between SNORA31-mutated and parental cells, in one-way ANOVA (F=106.6, total df=101) followed by Dunnett’s multiple comparison tests. ***, p<0.001. E) Quantification of HSV-1 in CNS neurons derived from isogenic hESCs, either WT (parental), or carrying a homozygous HDR-introduced patient-specific point mutation (hom HDR), a homozygous deletion (hom del2), or various heterozygous mutations (het del1, het del2, het del3, het del4, het del5) in SNORA31. HSV-1 levels were quantified at the indicated times post infection at a MOI of 0.001. HSV-1titers were determined by the TCID50 method. For the hom HDR, hom del2, het del1, het del2 and het del3 lines, means and standard deviations from n=3 independent experiments, with n=1 biological replicate in one experiment and n=2 biological replicates in two experiments for each set of conditions, are shown. For the het del4 and het del5 lines, the mean and standard deviation for n=3 biological replicates from n=4 independent experiments are shown.
Figure 6.
Figure 6.. Transcriptome responses to stimulations with poly(I:C), IFN-α2b or HSV-1 in SNORA31-mutated hPSC-derived cortical neurons
A, B) Heatmaps of RNA-Seq-quantified gene expression (z-score scaled log2 read counts per million, cpm) in hPSC-derived CNS cortical neurons from healthy controls (C1: a H9 hESC control line, C2 and C3: two iPSC control lines), SNORA31-mutated patients (P2 and P5), isogenic SNORA31-mutated hESC lines (SNORA31 hom del2, het del 1), a TLR3−/− and a STAT1−/− patient, not stimulated (N.S), stimulated with 25 μg/ml poly(I:C) for 6 hours (A), or stimulated with 100 IU/ml IFN-α2b for 8 hours (B). Each RNA-Seq library was sequenced twice. Each heatmap includes genes differentially expressed (FDR<=0.05) in response to the indicated stimulus relative to N.S samples in the healthy control or SNORA31-mutated groups. C) Scatter plots of average log2 fold-changes in RNA-Seq-quantified gene expression following stimulation with 25 μg/ml poly(I:C) for 6 hours (upper panel) or 100 IU/ml IFN-α2b for 8 hours (lower panel), in hPSC-derived cortical neurons from two SNORA31-mutated patients (P2 and P5) versus three healthy controls (C1, C2 and C3). Each point represents a single gene. D) Heatmaps of RNA-Seq-quantified gene expression (z-score scaled log2 read counts per million, cpm) in hPSC-derived cortical neurons from healthy controls (C1 and C2), SNORA31-mutated patients (P2 and P5), an isogenic SNORA31-mutated hESC line (SNORA31 het del 1), and a STAT1−/− patient, not stimulated (N.S), or infected with HSV-1 for 24 hours at a MOI of 1. The heatmap includes genes differentially expressed (FDR<=0.05, >2-fold difference) in response to HSV-1 relative to N.S samples in the healthy control or SNORA31-mutated groups. Each gene is annotated as significantly (Sig.) or not significantly (No. Sig.) differentially expressed (DEG = differentially expressed gene) in control, SNORA31-mutated or STAT1−/− neurons by the colored bars to the right of the heatmap. E) Upregulation of host immune response-related genes in healthy control and SNORA31-mutated hPSC-derived cortical neurons, after 24 hours of infection with HSV-1 at a MOI of 1. Each node represents one gene, and each edge represents the protein-protein interaction. The genes significantly upregulated by HSV-1 infection in healthy control or SNORA31-mutated hPSC-derived cortical neurons are highlighted in red.

Similar articles

Cited by

References

    1. Abel L, et al. Age-Dependent Mendelian Predisposition to Herpes Simplex Virus Type 1 Encephalitis in Childhood. J Pediatr 157, 623–629 (2010). - PubMed
    1. Whitley RJ Herpes simplex encephalitis: adolescents and adults. Antiviral Res 71, 141–148 (2006). - PubMed
    1. Jubelt B, Mihai C, Li TM & Veerapaneni P Rhombencephalitis / brainstem encephalitis. Current neurology and neuroscience reports 11, 543–552 (2011). - PubMed
    1. Whitley RJ Herpes Simplex Virus Infections of the Central Nervous System. Continuum 21, 1704–1713 (2015). - PubMed
    1. Audry M, et al. NEMO is a key component of NF-kappaB- and IRF-3-dependent TLR3-mediated immunity to herpes simplex virus. J Allergy Clin Immunol 128, 610–617 e611–614 (2011). - PMC - PubMed

Methods-only References

    1. Belkaya S, et al. Autosomal Recessive Cardiomyopathy Presenting as Acute Myocarditis. Journal of the American College of Cardiology 69, 1653–1665 (2017). - PMC - PubMed
    1. Desai P & Person S Incorporation of the green fluorescent protein into the herpes simplex virus type 1 capsid. J Virol 72, 7563–7568 (1998). - PMC - PubMed
    1. Reed LJ & Muench H A simple method of estimating fifty percent endpoints. The American Journal of Hygiene 27, 493–497(1938).
    1. Huffmaster NJ, Sollars PJ, Richards AL, Pickard GE & Smith GA Dynamic ubiquitination drives herpesvirus neuroinvasion. Proc Natl Acad Sci U S A 112, 12818–12823 (2015). - PMC - PubMed
    1. Wang Z, Liu Y, Lin W & Cui S A real-time PCR to detect and analyze virulent EMCV loads in sows and piglets. Mol Biol Rep 39, 10013–10017 (2012). - PubMed

Publication types

MeSH terms

Substances