

Recapitulation-like developmental transitions of chromatin accessibility in vertebrates
- PMID: 31807314
- PMCID: PMC6857340
- DOI: 10.1186/s40851-019-0148-9
Recapitulation-like developmental transitions of chromatin accessibility in vertebrates
Abstract
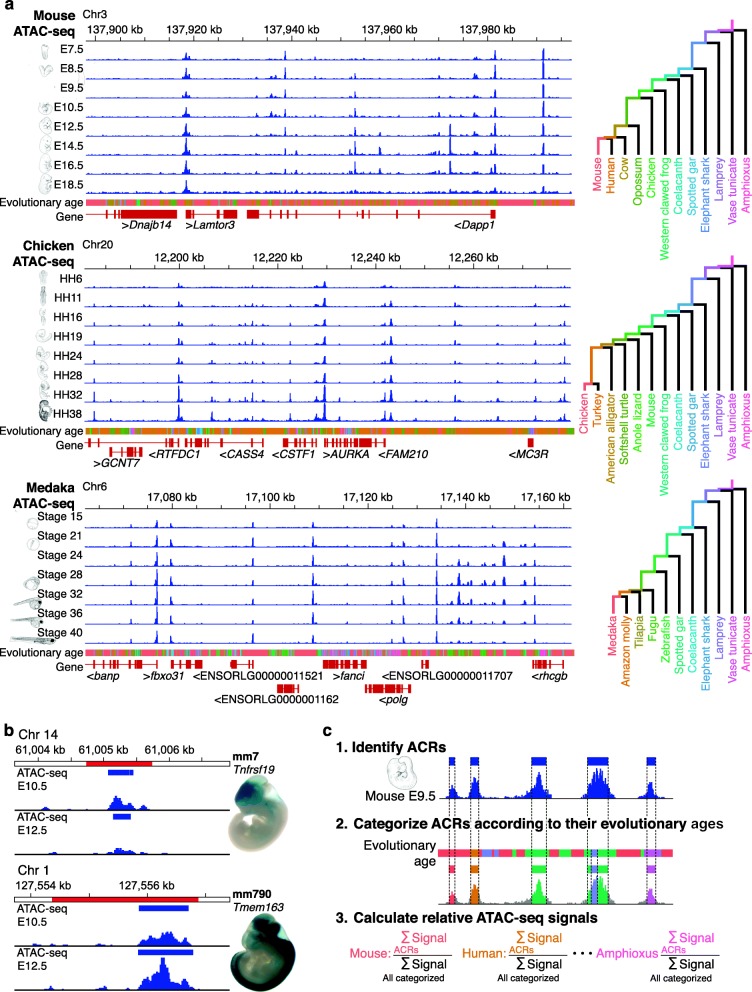
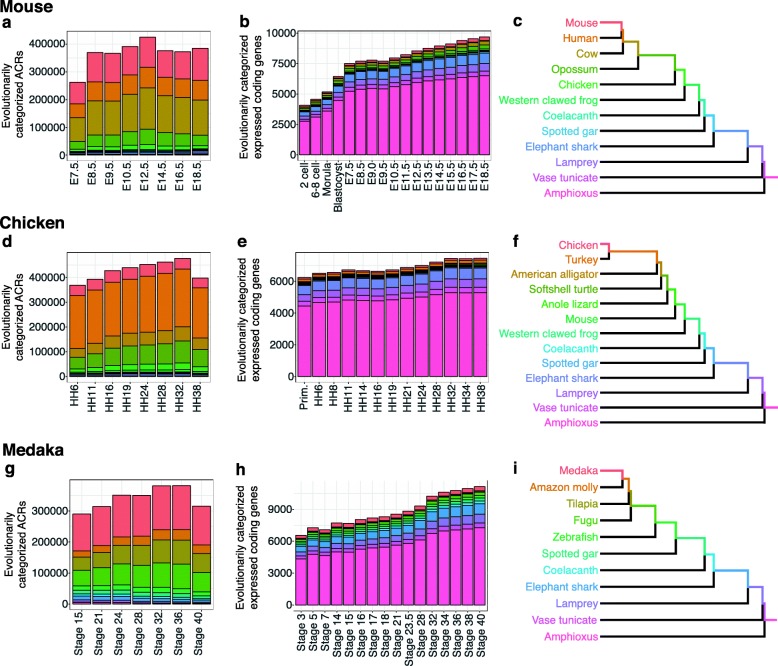
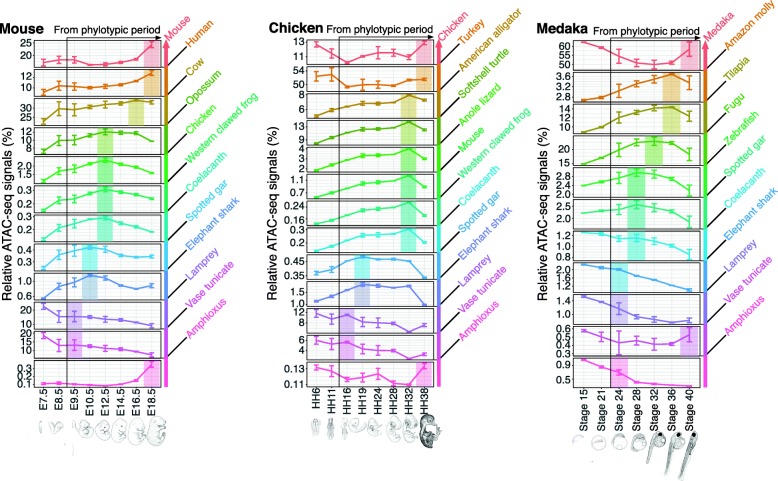
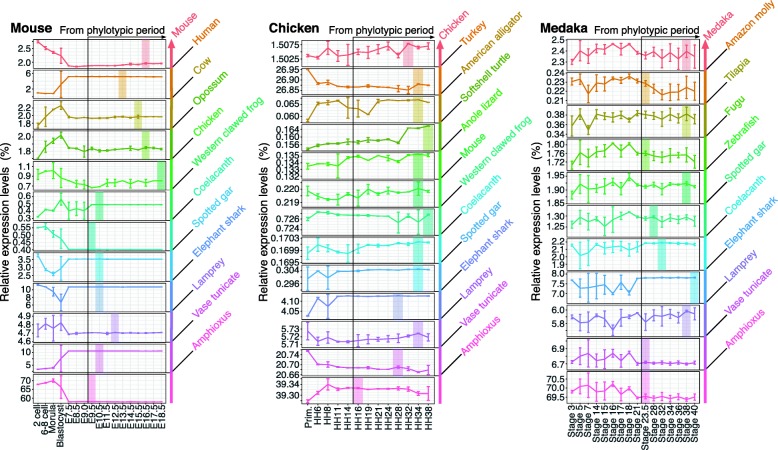
The relationship between development and evolution has been a central theme in evolutionary developmental biology. Across the vertebrates, the most highly conserved gene expression profiles are found at mid-embryonic, organogenesis stages, whereas those at earlier and later stages are more diverged. This hourglass-like pattern of divergence does not necessarily rule out the possibility that gene expression profiles that are more evolutionarily derived appear at later stages of development; however, no molecular-level evidence of such a phenomenon has been reported. To address this issue, we compared putative gene regulatory elements among different species within a phylum. We made a genome-wide assessment of accessible chromatin regions throughout embryogenesis in three vertebrate species (mouse, chicken, and medaka) and estimated the evolutionary ages of these regions to define their evolutionary origins on the phylogenetic tree. In all the three species, we found that genomic regions tend to become accessible in an order that parallels their phylogenetic history, with evolutionarily newer gene regulations activated at later developmental stages. This tendency was restricted only after the mid-embryonic, phylotypic periods. Our results imply a phylogenetic hierarchy of putative regulatory regions, in which their activation parallels the phylogenetic order of their appearance. One evolutionary mechanism that may explain this phenomenon is that newly introduced regulatory elements are more likely to survive if activated at later stages of embryogenesis. Possible relationships between this phenomenon and the so-called recapitulation are discussed.
Keywords: ATAC-seq; Development; Developmental hourglass model; Evolution; Gene regulatory evolution; Parallelism; Recapitulation.
© The Author(s). 2019.
Conflict of interest statement
Competing interestsThe authors declare that they have no competing interests.
Figures
Similar articles
-
The developmental hourglass model and recapitulation: An attempt to integrate the two models.J Exp Zool B Mol Dev Evol. 2022 Jan;338(1-2):76-86. doi: 10.1002/jez.b.23027. Epub 2021 Jan 27. J Exp Zool B Mol Dev Evol. 2022. PMID: 33503326 Free PMC article. Review.
-
Embryonic lethality is not sufficient to explain hourglass-like conservation of vertebrate embryos.Evodevo. 2018 Mar 16;9:7. doi: 10.1186/s13227-018-0095-0. eCollection 2018. Evodevo. 2018. PMID: 29568479 Free PMC article.
-
The hourglass model of evolutionary conservation during embryogenesis extends to developmental enhancers with signatures of positive selection.Genome Res. 2021 Sep;31(9):1573-1581. doi: 10.1101/gr.275212.121. Epub 2021 Jul 15. Genome Res. 2021. PMID: 34266978 Free PMC article.
-
The vertebrate phylotypic stage and an early bilaterian-related stage in mouse embryogenesis defined by genomic information.BMC Biol. 2007 Jan 12;5:1. doi: 10.1186/1741-7007-5-1. BMC Biol. 2007. PMID: 17222327 Free PMC article.
-
The Phylotypic Brain of Vertebrates, from Neural Tube Closure to Brain Diversification.Brain Behav Evol. 2024;99(1):45-68. doi: 10.1159/000537748. Epub 2024 Feb 9. Brain Behav Evol. 2024. PMID: 38342091 Review.
Cited by
-
Distinguishing Evolutionary Conservation from Derivedness.Life (Basel). 2022 Mar 17;12(3):440. doi: 10.3390/life12030440. Life (Basel). 2022. PMID: 35330191 Free PMC article. Review.
-
An irregular hourglass pattern describes the tempo of phenotypic development in placental mammal evolution.Biol Lett. 2020 May;16(5):20200087. doi: 10.1098/rsbl.2020.0087. Epub 2020 May 13. Biol Lett. 2020. PMID: 32396787 Free PMC article.
-
Dynamical systems approach to evolution-development congruence: Revisiting Haeckel's recapitulation theory.J Exp Zool B Mol Dev Evol. 2022 Jan;338(1-2):62-75. doi: 10.1002/jez.b.23031. Epub 2021 Feb 18. J Exp Zool B Mol Dev Evol. 2022. PMID: 33600605 Free PMC article. Review.
-
The domestic chick as an animal model of autism spectrum disorder: building adaptive social perceptions through prenatally formed predispositions.Front Neurosci. 2024 Jan 31;18:1279947. doi: 10.3389/fnins.2024.1279947. eCollection 2024. Front Neurosci. 2024. PMID: 38356650 Free PMC article. Review.
-
Developmental hourglass and heterochronic shifts in fin and limb development.Elife. 2021 Feb 9;10:e62865. doi: 10.7554/eLife.62865. Elife. 2021. PMID: 33560225 Free PMC article.
References
-
- von Baer KE. Über Entwickelungsgeschichte der Thiere: Beobachtung und Reflektion. Königsberg: Bei den Gebrüdern Bornträger; 1828.
-
- Haeckel E. Generelle Morphologie der Organismen: Allgemeine Grundzuge der organischen Formen-Wissenschaft, mechanisch begrundet durch die von Charles Darwin reformirte Descendenz-Theorie. Georg Reimer. 1866.
-
- Gould SJ. Ontogeny and phylogeny. Cambridge, MA: The Belknap Press of Harvard University Press; 1977.
LinkOut - more resources
Full Text Sources
