Review
. 2019 Nov 4:10:2128-2151.
doi: 10.3762/bjnano.10.207. eCollection 2019.

Nitrogen-vacancy centers in diamond for nanoscale magnetic resonance imaging applications

Affiliations
Review

Nitrogen-vacancy centers in diamond for nanoscale magnetic resonance imaging applications

Alberto Boretti et al. Beilstein J Nanotechnol. .

Abstract

The nitrogen-vacancy (NV) center is a point defect in diamond with unique properties for use in ultra-sensitive, high-resolution magnetometry. One of the most interesting and challenging applications is nanoscale magnetic resonance imaging (nano-MRI). While many review papers have covered other NV centers in diamond applications, there is no survey targeting the specific development of nano-MRI devices based on NV centers in diamond. Several different nano-MRI methods based on NV centers have been proposed with the goal of improving the spatial and temporal resolution, but without any coordinated effort. After summarizing the main NV magnetic imaging methods, this review presents a survey of the latest advances in NV center nano-MRI.

Keywords: nanodiamonds; nanoscale magnetic resonance imaging (nano-MRI); nitrogen-vacancy center; optically detected magnetic resonance.


Figures

Figure 1
Figure 1
Diamond NV center mediated optomagnetic imaging of brain sample neural activity [72]. Image reproduced with permission from [72], an article licensed under a Creative Commons Attribution 4.0 International License, https://creativecommons.org/licenses/by/4.0/. (A) Trisynaptic path in hippocampus sample. Electrical stimulation of the Schaffer collaterals evokes CA1 area activity which is then recorded. (B) 500 × 500 × 300 µm3 simulated CA1 subareas on top of the diamond surface, assuming up to 50 µm distance from the diamond makes neurons dysfunctional. Along x- and z-axis, the distribution of pyramidal cells is uniform, their soma locations being randomly jittered in a 50 µm wide band along the y-axis. Inverted microscope with a camera in place of a photodetector is used to detect the photoluminescence change in NV center layer emission due to neural magnetic fields. (C) Forward modeling scheme pyramidal cell multi-compartment model.
Figure 2
Figure 2
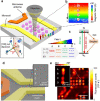
Experimental set-up and characterization of NV centers and the gradient microcoil of [43]. Image reproduced with permission from [43], an article licensed under a Creative Commons Attribution 4.0 International License, https://creativecommons.org/licenses/by/4.0/. (A) Experimental apparatus. A matrix of implantation regions (pink circles) of negative charge NV centers on the diamond is integrated into a scanning confocal microscope. A green laser (532 nm) is used to initialize and read out NV center spin states in a given region and microwaves emitted by an antenna (orange bar) manipulate them. A uniform magnetic bias field of B0 = 128 G is applied along one range of NV orientations, causing a Zeeman line splitting among |±1⟩ NV center spin states; without a magnetic field they would show a 2.87 GHz frequency shift from the |0⟩ state. An added gradient magnetic field (rainbow-colored arrows) of ≈0.1 G·nm−1 is applied by injecting current along a pair of gold wires (gradient microcoil), inducing the Zeeman shift depending on the position. (B) Each region (pink circle in a) holds a 1 × 4 array of NV sites with 60 nm diameter and 100 nm spacing, which undergo interaction that depends on the gradient in the magnetic field. Each site typically holds multiple (≈3 ± 1) NVs of the selected orientation. (C) NV energy-level diagram. A nonradiative intersystem crossing channel exists between the ground (3A2) and excited (3E) states, and the magnetic field gradient causes the NV center spin states |±1⟩ Zeeman splitting to be dependent on their position. Each site has a specific resonance that the microwave generator can be tuned to, allowing for selective detection of each site. (D) Gradient microcoil SEM image on the diamond substrate. The microcoil, represented by yellow pseudo-color, is 1 µm thick and 2 µm wide. (Inset) E-beam resist apertures on PMMA, SEM image of ion implantation mask to create a 1 × 4 array of NV sites. (E) Microcoil and NV center matrix image by scanning confocal microscopy. (Inset) STED image of 1 × 4 array of NV sites with 50 nm resolution. Photon count rate (kilo-counts-per-second) is shown by color table.
Figure 3
Figure 3
Single-cell magnetic imaging quantum diamond microscope [53]. Image reprinted with permission from [53], copyright 2015, Springer Nature Publishing. (a) Wide-field magnetic imaging microscope based on NV centers in diamond. Immunomagnetically labeled cells are positioned on top of a diamond with a surface layer of NV centers. A 532 nm laser is used to measure the ODMR of the NV electronic spins. An sCMOS camera is used to image the NV fluorescence. The magnetic field projection along one of the [111] diamond axes is measured over a 1 mm × 0.6 mm field-of-view for each imaging pixel. The scheme is adapted from [30] where further details are provided. (b) Electron micrograph of an SKBR3 cell labeled with MNPs conjugated to HER2 antibodies. The black dots on the cell membrane highlighted by the white arrows in the expanded view indicate the magnetic nanoparticles. The main figure scale bar is 2 μm. The inset scale bar is 500 nm. (c) MNP-labeled diagram of a target and surroundings with unlabeled normal blood cells. The magnetic bias field B0 externally applied is aligned with the diamond [111] axis. This field is used to magnetize the MNP labels. These magnetized nanoparticles produce the field then are imaged by the shallow NV center layer that is close to the surface of the diamond surface to show a dipole-like pattern.
Figure 4
Figure 4
NV-NMR detection system schematic of [73]. Image reprinted with permission from [73], copyright 2013, AAAS. (A) 12C diamond layer with NV center spin at [111] orientation embedded at 20 nm depth. Proton NMR is detected in a PMMA layer. (B) Sample surface from fluorescence imaging, with microwire and NV center (circled). (C) Proton detection sensitivity dependence from space along the PMMA layer cross-section. 50% of the proton signal comes from a (24 nm)3 volume. The NV center axis is 54.7° tilted from surface normal, originating two lobes as shown. (D) Normalized spin echo response vs total echo time.
Figure 5
Figure 5
Experimental setup and magnetometry with repetitive readout [78]. Image reprinted with permission from [78], copyright 2016 AAAS. (A) Experimental setup. NV center electronic spin and its associated 15 N nuclear spin are used as a proximal quantum sensor to probe ubiquitin proteins on the surface of the diamond. (B) Quantum circuit diagram and experimental magnetometry pulse sequence. (C) Repetitive readout cycles and measured fidelity gain. MW – microwave; RF – radiofrequency; APD – avalanche photodiode; B – nuclear spin magnetic field.
Figure 6
Figure 6
NV-ensemble sensor for coherently averaged synchronized readout (CASR) NMR. Image reprinted with permission from [82], copyright 2018, Springer Nature Publishing. (a) NV-ensemble sensor based on an NV center surface layer on a diamond chip, probed by a green laser. Thermally polarized nuclear spins are NMR detected from the sample. (b) CASR detection of an NMR FNP signal. Top row: thermally polarized spin precession at frequency f causes oscillations in the magnetic field. Middle row: CASR protocol made of optical NV spin-state readouts blocks repeated at the synchronized readout cycle period intertwined with blocks of identical NV AC magnetometry pulse sequences with central frequency. (c) Probe geometry: a cuvette holds the sample and the diamond chip, above and below are the cylindrical coils driving the nuclear spins, while a wire antenna drives the NV centers. A light guide collects the spin-state-dependent fluorescence from the NV to bring it to a photodiode, while an electromagnet supplies the magnetic bias field.

Similar articles

Cited by

References

    1. Hahn E L. Phys Rev. 1950;80:580–594. doi: 10.1103/physrev.80.580. - DOI
    1. Carr H Y, Purcell E M. Phys Rev. 1954;94:630–638. doi: 10.1103/physrev.94.630. - DOI
    1. Lauterbur P C. Nature. 1973;242:190–191. doi: 10.1038/242190a0. - DOI
    1. Edelman R R. Radiology (Oak Brook, IL, U S) 2014;273:S181–S200. doi: 10.1148/radiol.14140706. - DOI - PubMed
    1. Rosa L, Blackledge J, Boretti A. Biomedicines. 2017;5:7. doi: 10.3390/biomedicines5010007. - DOI - PMC - PubMed

LinkOut - more resources