. 2019 Oct;7(20):555.
doi: 10.21037/atm.2019.09.76.

Survival and analysis of prognostic factors for hepatoblastoma: based on SEER database

Affiliations

Survival and analysis of prognostic factors for hepatoblastoma: based on SEER database

Tie-Cheng Feng et al. Ann Transl Med. 2019 Oct.

Abstract

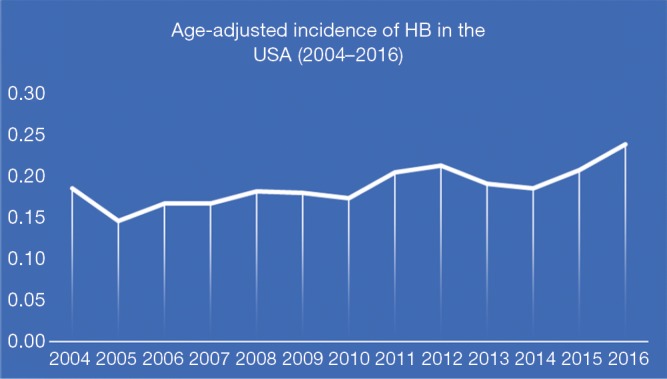
Background: The goal of this study is to assess the newest survival of hepatoblastoma (HB) and the risk factors which impacted on survival by using the Surveillance, Epidemiology and End Results (SEER) database, also calculate the incidence of HB in recent years.

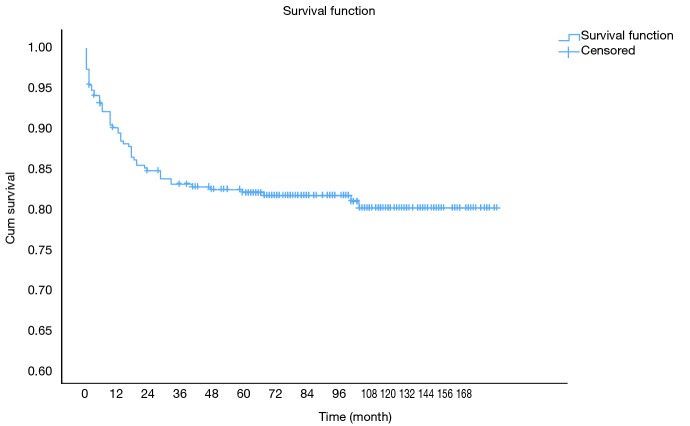
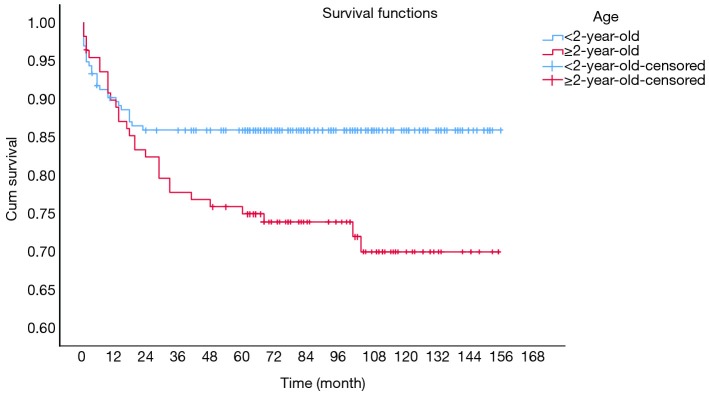
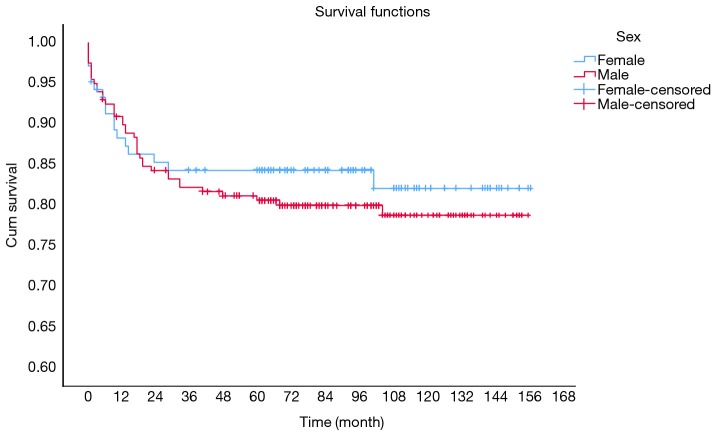
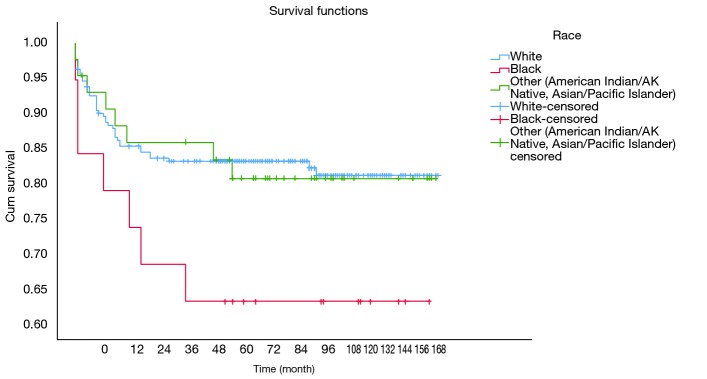
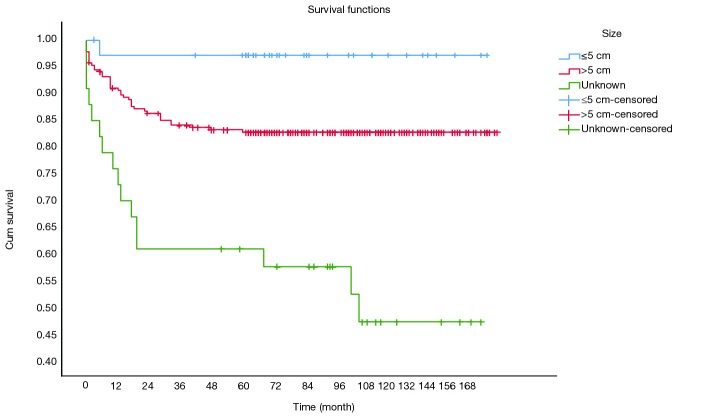
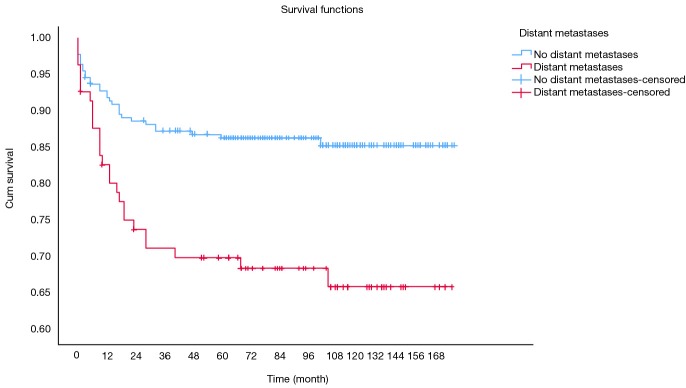
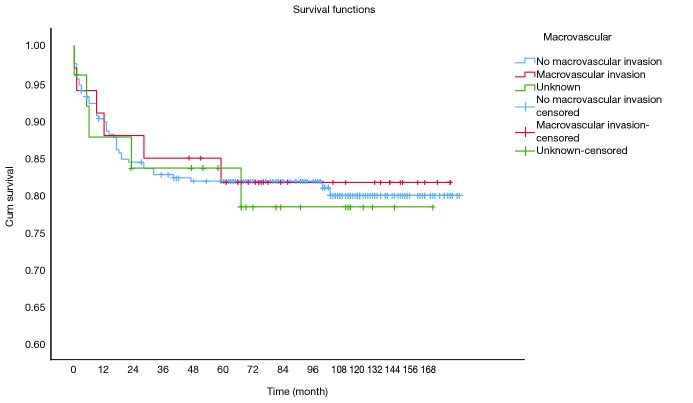
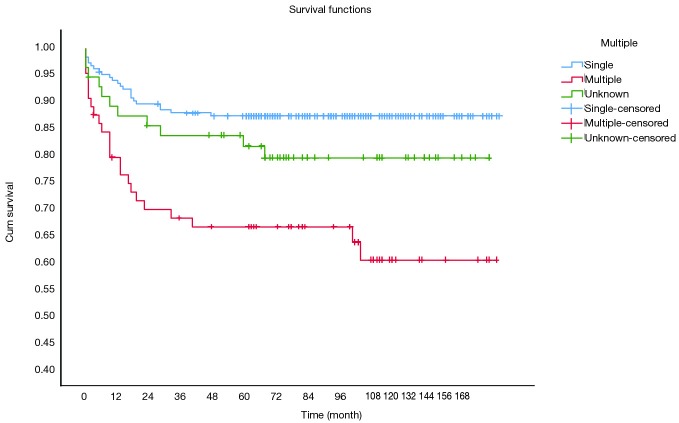
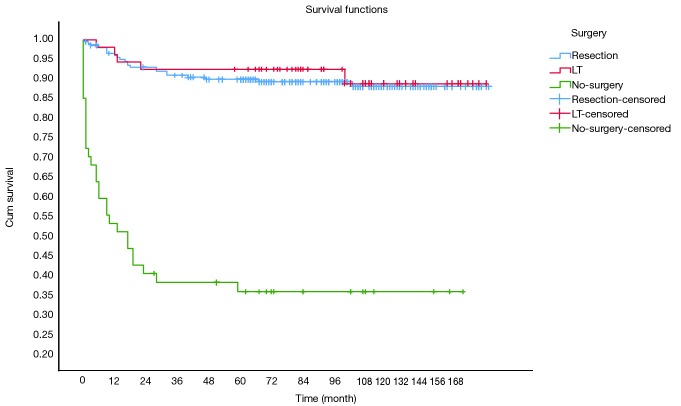
Methods: We calculate age-adjusted incidence of HB by using SEER 21 registries. Age, sex, race, tumor size, macrovascular involvement, multifocal tumor, distant metastasis, the way of treatment, and the survival were collected for survival and analysis of prognostic factors in SEER 18 registries. Survival curves, according to different factors, were obtained by Kaplan-Meier estimates. Multivariable Cox regression models were also built.

Results: The overall age-adjusted incidence of HB was 0.19 patients per 100,000 children with a statistically significant increase per year. Overall survival (OS) at 1-, 3- and 5-year for all patients were 89.3%, 84.6%, and 81.9%, respectively. Multivariate analysis showed tumor size >5 cm [hazard ratio (HR), 8.271; 95% confidence interval (CI), 1.134-60.310], multiple tumors (HR, 2.578; 95% CI, 1.424-4.668) and no-surgery treatment (HR, 7.520; 95% CI, 4.121-13.724) were independent indicators of poor prognosis. Only the age ≥2-year-old (HR, 3.240; 95% CI, 1.433-7.326) and multiple tumors (HR, 2.395; 95% CI, 1.057-5.430) were the risk factors for the surgical treatment group.

Conclusions: The survival of patients with HB has been greatly improved in the recent years, and at the same time, due to the application of better chemotherapy, we should re-evaluate the traditional risk indicators of prognosis in order to better apply to the clinical.

Keywords: Hepatoblastoma (HB); Surveillance, Epidemiology and End Results (SEER); survival.


Conflict of interest statement

Conflicts of Interest: The authors have no conflicts of interest to declare.

Figures

Figure 1
Figure 1
Age-adjusted incidence of HB in the USA (2004–2016). The incidence of HB has increased over time (APC, 2.53%; P<0.05). HB, hepatoblastoma; APC, annual percentage change.
Figure 2
Figure 2
Survival curves for all HB. The 1-, 3- and 5-year OS of all patients was 89.3%, 84.6% and 81.9%, respectively. HB, hepatoblastoma; OS, overall survival.
Figure 3
Figure 3
Survival curves for HB which were stratified according to age. <2- vs. ≥2-year-old, P=0.009. HB, hepatoblastoma.
Figure 4
Figure 4
Survival curves for HB which were stratified according to sex. Female vs. male, P=0.492. HB, hepatoblastoma.
Figure 5
Figure 5
Survival curves for HB which were stratified according to the race. White vs. black, P=0.041; white vs. other race, P=0.906; black vs. other race, P=0.120. HB, hepatoblastoma.
Figure 6
Figure 6
Survival curves for HB which were stratified according to tumor size. ≤5 vs. >5 cm, P=0.031. HB, hepatoblastoma.
Figure 7
Figure 7
Survival curves for HB which were stratified according to distant metastases. No distant metastases vs. distant metastases, P<0.0001. HB, hepatoblastoma.
Figure 8
Figure 8
Survival curves for HB which were stratified according to the macrovascular invasion. No macrovascular invasion vs. macrovascular invasion, P=0.887. HB, hepatoblastoma.
Figure 9
Figure 9
Survival curves for HB which were stratified according to multiple tumors or not. Single tumor vs. multiple tumors, P<0.0001. HB, hepatoblastoma.
Figure 10
Figure 10
Survival curves for HB which were stratified according to treatment. Resection vs. no-surgery, P<0.001; resection vs. LT, P=0.7; LT vs. no-surgery, P<0.001. HB, hepatoblastoma; LT, liver transplantation.

References

    1. Allan BJ, Parikh PP, Diaz S, et al. Predictors of survival and incidence of hepatoblastoma in the paediatric population. HPB (Oxford) 2013;15:741-6. 10.1111/hpb.12112 - DOI - PMC - PubMed
    1. Linabery AM, Ross JA. Trends in childhood cancer incidence in the U.S. (1992-2004). Cancer 2008;112:416-32. 10.1002/cncr.23169 - DOI - PubMed
    1. Xie L, Onysko J, Morrison H. Childhood cancer incidence in Canada: demographic and geographic variation of temporal trends (1992-2010). Health Promot Chronic Dis Prev Can 2018;38:79-115. 10.24095/hpcdp.38.3.01 - DOI - PMC - PubMed
    1. Hung GY, Lin LY, Yu TY, et al. Hepatoblastoma incidence in Taiwan: a population-based study. J Chin Med Assoc 2018;81:541-7. 10.1016/j.jcma.2017.11.012 - DOI - PubMed
    1. Spector LG, Birch J. The epidemiology of hepatoblastoma. Pediatr Blood Cancer 2012;59:776-9. 10.1002/pbc.24215 - DOI - PubMed