

Linkage disequilibrium and within-breed genetic diversity in Iranian Zandi sheep
- PMID: 31807624
- PMCID: PMC6852851
- DOI: 10.5194/aab-62-143-2019
Linkage disequilibrium and within-breed genetic diversity in Iranian Zandi sheep
Abstract
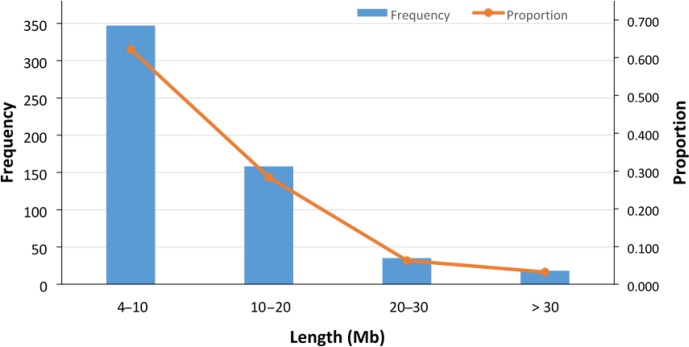
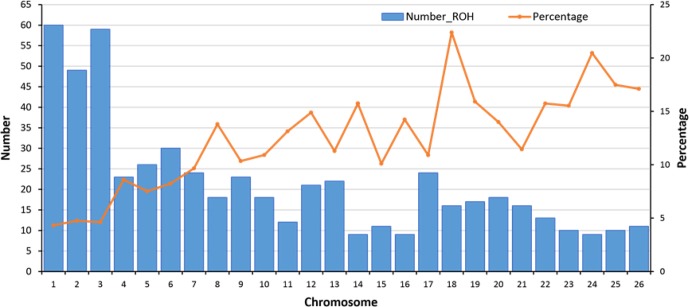
This research aimed to measure the extent of linkage disequilibrium (LD), effective population size ( ), and runs of homozygosity (ROHs) in one of the major Iranian sheep breeds (Zandi) using 96 samples genotyped with Illumina Ovine SNP50 BeadChip. The amount of LD ( ) for single-nucleotide polymorphism (SNP) pairs in short distances (10-20 kb) was but rapidly decreased to by increasing the distance between SNP pairs (40-60 kb). The of Zandi sheep in past (approximately 3500 generations ago) and recent (five generations ago) populations was estimated to be 6475 and 122, respectively. The ROH-based inbreeding was 0.023. We found 558 ROH regions, of which 37 % were relatively long ( Mb). Compared with the rate of LD reduction in other species (e.g., cattle and pigs), in Zandi, it was reduced more rapidly by increasing the distance between SNP pairs. According to the LD pattern and high genetic diversity of Zandi sheep, we need to use an SNP panel with a higher density than Illumina Ovine SNP50 BeadChip for genomic selection and genome-wide association studies in this breed.
Copyright: © 2019 Seyed Mohammad Ghoreishifar et al.
Conflict of interest statement
The authors declare that they have no conflict of interest.
Figures

Similar articles
-
Genome-wide linkage disequilibrium and genetic diversity in five populations of Australian domestic sheep.Genet Sel Evol. 2015 Nov 24;47:90. doi: 10.1186/s12711-015-0169-6. Genet Sel Evol. 2015. PMID: 26602211 Free PMC article.
-
Single nucleotide polymorphism-based analysis of linkage disequilibrium and runs of homozygosity patterns of indigenous sheep in the southern Taklamakan desert.BMC Genomics. 2025 Mar 18;26(1):267. doi: 10.1186/s12864-025-11445-9. BMC Genomics. 2025. PMID: 40102738 Free PMC article.
-
Estimation of linkage disequilibrium and effective population size in New Zealand sheep using three different methods to create genetic maps.BMC Genet. 2017 Jul 21;18(1):68. doi: 10.1186/s12863-017-0534-2. BMC Genet. 2017. PMID: 28732466 Free PMC article.
-
Runs of homozygosity: current knowledge and applications in livestock.Anim Genet. 2017 Jun;48(3):255-271. doi: 10.1111/age.12526. Epub 2016 Dec 1. Anim Genet. 2017. PMID: 27910110 Review.
-
On the Extent of Linkage Disequilibrium in the Genome of Farm Animals.Front Genet. 2020 Jan 17;10:1304. doi: 10.3389/fgene.2019.01304. eCollection 2019. Front Genet. 2020. PMID: 32010183 Free PMC article. Review.
Cited by
-
Estimation of Linkage Disequilibrium and Effective Population Size in Three Italian Autochthonous Beef Breeds.Animals (Basel). 2020 Jun 14;10(6):1034. doi: 10.3390/ani10061034. Animals (Basel). 2020. PMID: 32545850 Free PMC article.
-
Signatures of selection reveal candidate genes involved in economic traits and cold acclimation in five Swedish cattle breeds.Genet Sel Evol. 2020 Sep 4;52(1):52. doi: 10.1186/s12711-020-00571-5. Genet Sel Evol. 2020. PMID: 32887549 Free PMC article.
-
Genome-wide analysis identified candidate variants and genes associated with heat stress adaptation in Egyptian sheep breeds.Front Genet. 2022 Oct 3;13:898522. doi: 10.3389/fgene.2022.898522. eCollection 2022. Front Genet. 2022. PMID: 36263427 Free PMC article.
-
Genomic measures of inbreeding coefficients and genome-wide scan for runs of homozygosity islands in Iranian river buffalo, Bubalus bubalis.BMC Genet. 2020 Feb 10;21(1):16. doi: 10.1186/s12863-020-0824-y. BMC Genet. 2020. PMID: 32041535 Free PMC article.
-
Assessing the Genomics Structure of Dorper and White Dorper Variants, and Dorper Populations in South Africa and Hungary.Biology (Basel). 2023 Feb 28;12(3):386. doi: 10.3390/biology12030386. Biology (Basel). 2023. PMID: 36979078 Free PMC article.
References
-
- Barrett JC, Fry B, Maller J, Daly MJ. Haploview: analysis and visualization of LD and haplotype maps. Bioinformatics. 2004;21:263–265. - PubMed
LinkOut - more resources
Full Text Sources
Research Materials
Miscellaneous