

Complex Acoustic Environments: Review, Framework, and Subjective Model
- PMID: 31808369
- PMCID: PMC6900675
- DOI: 10.1177/2331216519881346
Complex Acoustic Environments: Review, Framework, and Subjective Model
Abstract
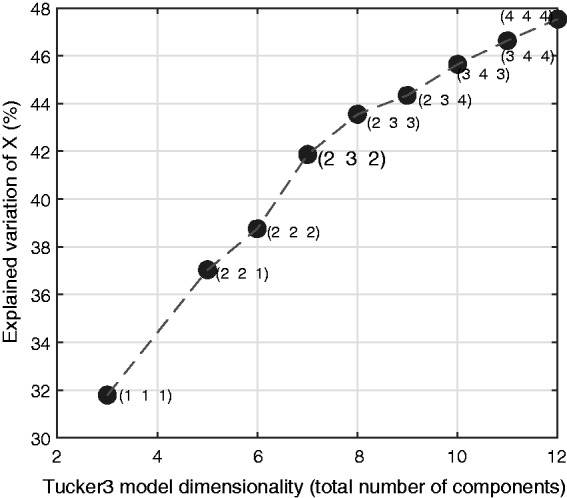
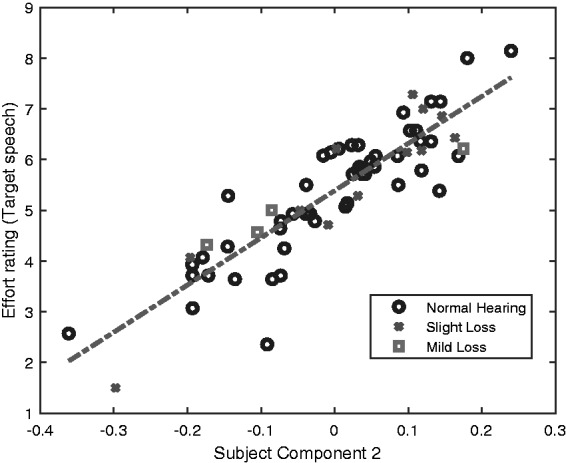
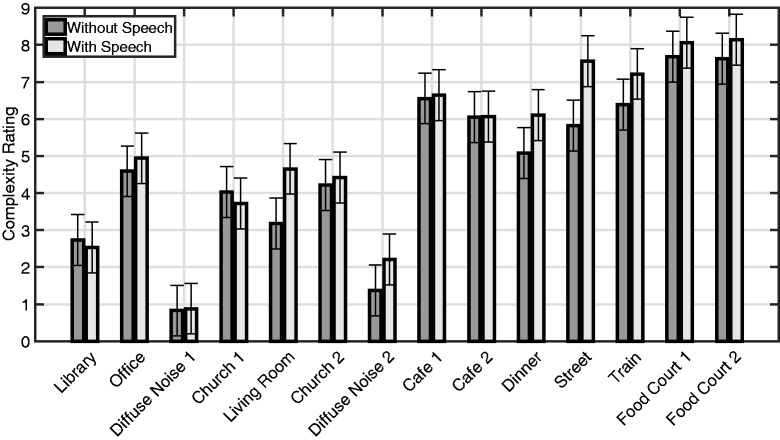
The concept of complex acoustic environments has appeared in several unrelated research areas within acoustics in different variations. Based on a review of the usage and evolution of this concept in the literature, a relevant framework was developed, which includes nine broad characteristics that are thought to drive the complexity of acoustic scenes. The framework was then used to study the most relevant characteristics for stimuli of realistic, everyday, acoustic scenes: multiple sources, source diversity, reverberation, and the listener's task. The effect of these characteristics on perceived scene complexity was then evaluated in an exploratory study that reproduced the same stimuli with a three-dimensional loudspeaker array inside an anechoic chamber. Sixty-five subjects listened to the scenes and for each one had to rate 29 attributes, including complexity, both with and without target speech in the scenes. The data were analyzed using three-way principal component analysis with a (2 3 2) Tucker3 model in the dimensions of scales (or ratings), scenes, and subjects, explaining 42% of variation in the data. "Comfort" and "variability" were the dominant scale components, which span the perceived complexity. Interaction effects were observed, including the additional task of attending to target speech that shifted the complexity rating closer to the comfort scale. Also, speech contained in the background scenes introduced a second subject component, which suggests that some subjects are more distracted than others by background speech when listening to target speech. The results are interpreted in light of the proposed framework.
Keywords: complex acoustic environments; complexity; hearing; perception; three-way principal component analysis.
Figures

References
-
- Ahrens, A., Marschall, M., & Dau, T. (2018). The relation between source width perception and speech intelligibility with virtual sound sources. Paper presented at the 41st Annual Midwinter Meeting of the Association for Research in Otolaryngology, San Diego, CA.
-
- Andersson C. A., Bro R. (2000) The N-way toolbox for MATLAB. Chemometrics and Intelligent Laboratory Systems 52(1): 1–4. doi: 10.1016/S0169-7439(00)00071-X.
-
- Arlinger S., Lunner T., Lyxell B., Kathleen Pichora-Fuller M. (2009) The emergence of cognitive hearing science. Scandinavian Journal of Psychology 50(5): 371–384. doi: 10.1111/j.1467-9450.2009.00753.x. - PubMed
-
- Badii R., Politi A. (1999) Complexity: Hierarchical structures and scaling in physics (Vol, 6). Cambridge, England: Cambridge University Press.
-
- Beechey T., Buchholz J., Keidser G. (2018) Measuring communication difficulty through effortful speech production during conversation. Speech Communication 100: 18–29. doi: 10.1016/j.specom.2018.04.007.
Publication types
MeSH terms
LinkOut - more resources
Full Text Sources
