. 2019 Dec 6:8:e52646.
doi: 10.7554/eLife.52646.

Releasing a preprint is associated with more attention and citations for the peer-reviewed article

Affiliations

Releasing a preprint is associated with more attention and citations for the peer-reviewed article

Darwin Y Fu et al. Elife. .

Abstract

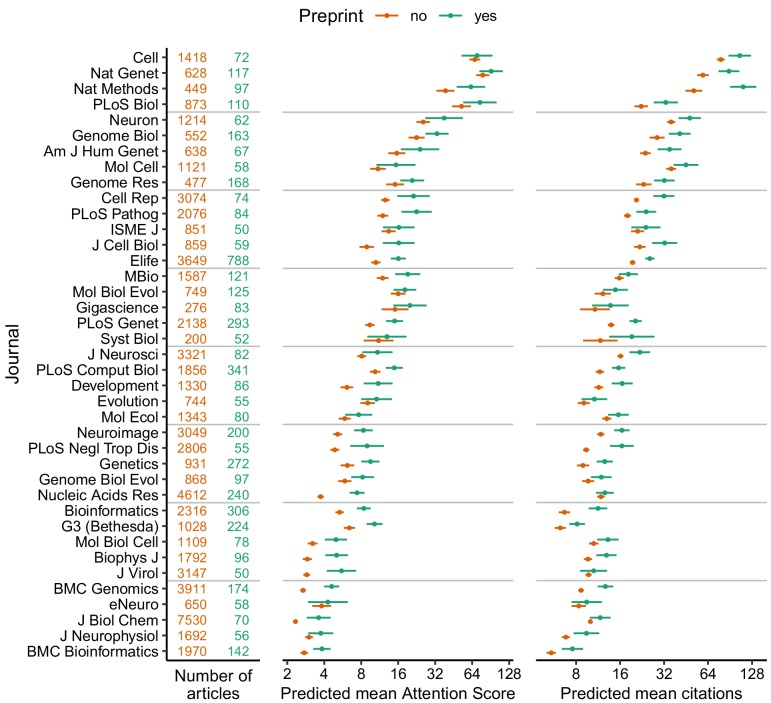
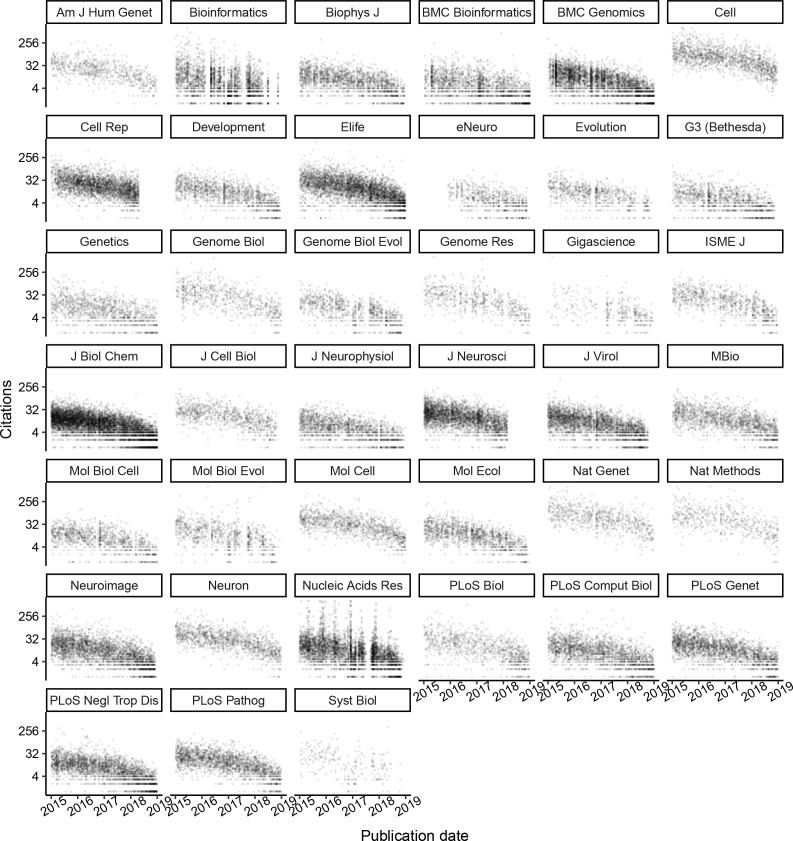
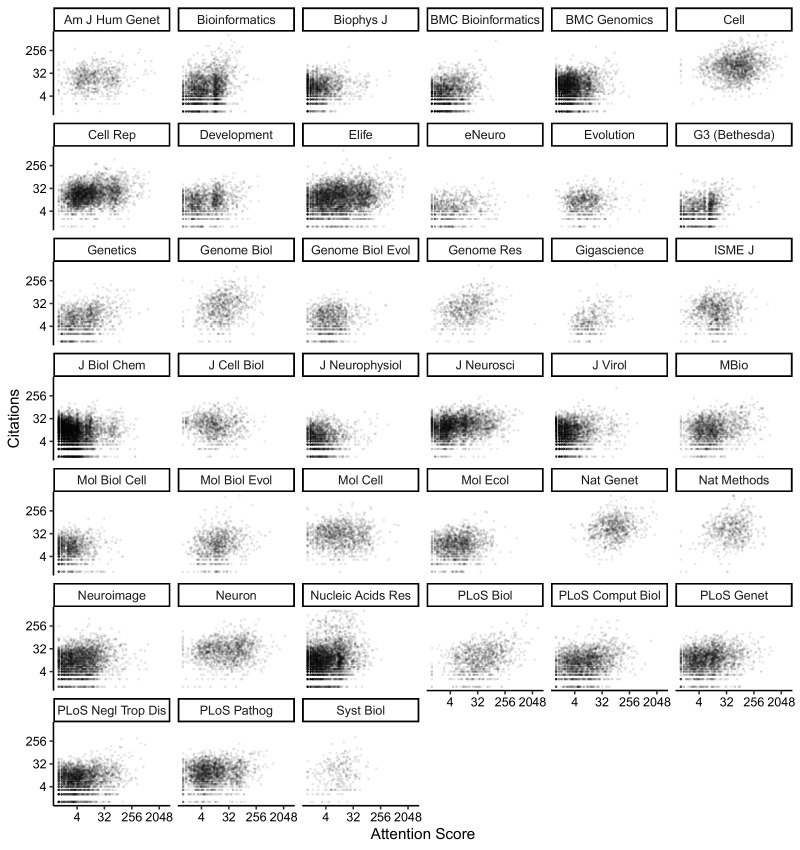
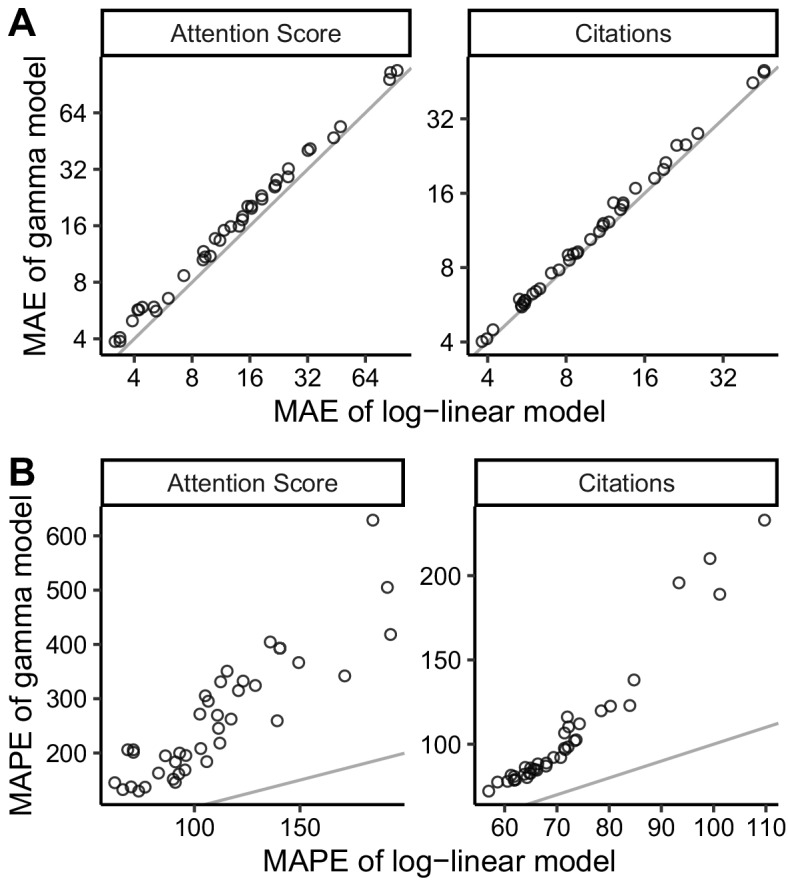
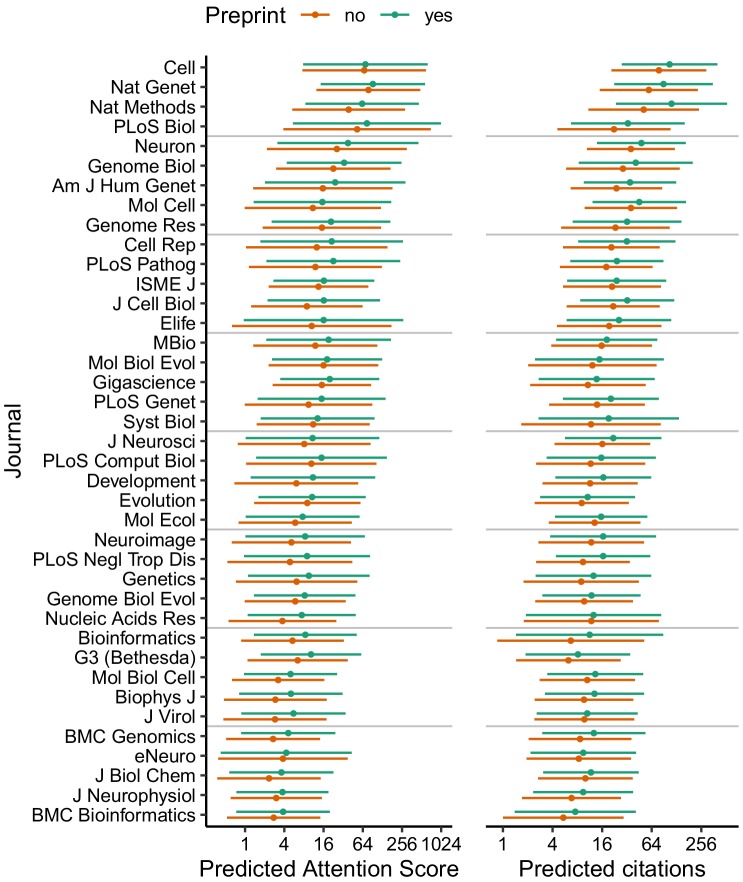
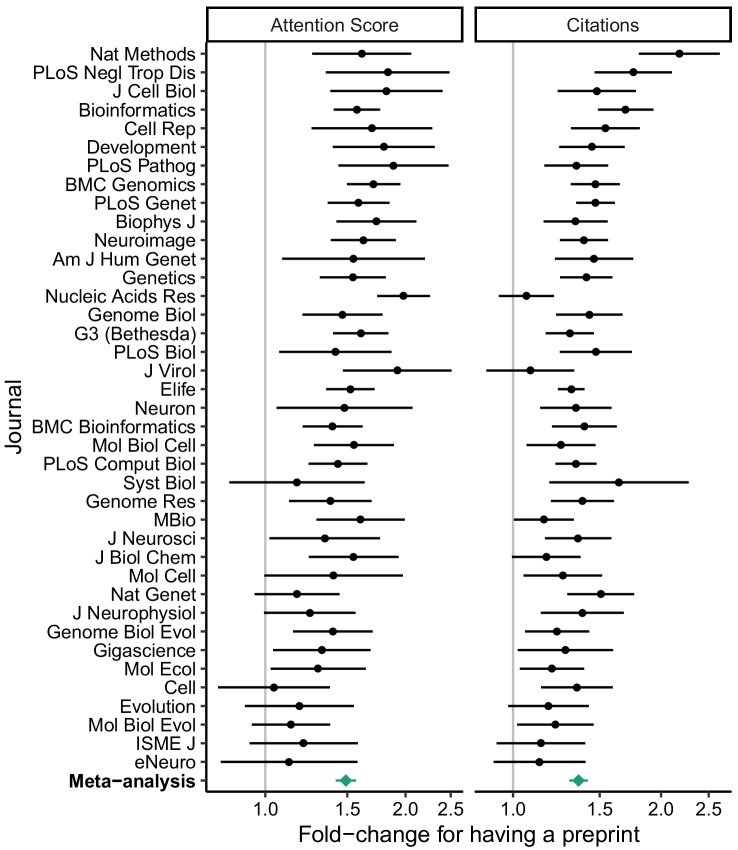
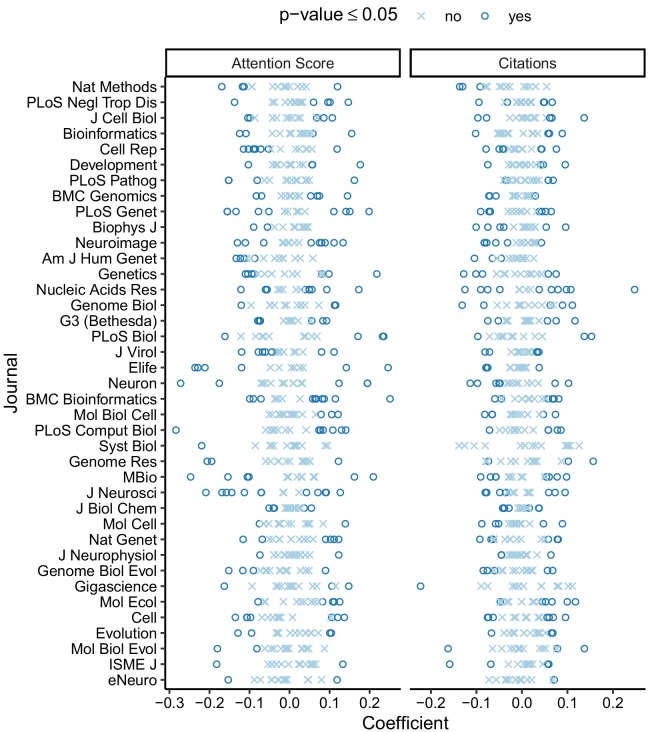
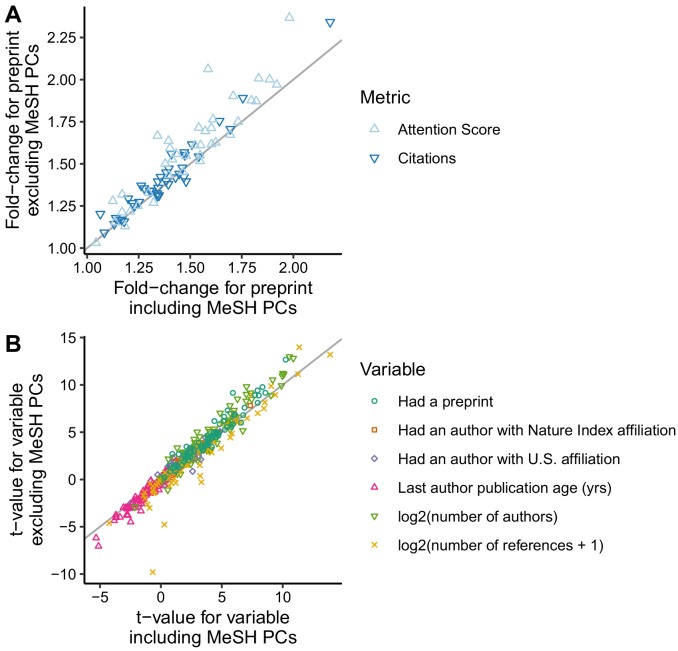
Preprints in biology are becoming more popular, but only a small fraction of the articles published in peer-reviewed journals have previously been released as preprints. To examine whether releasing a preprint on bioRxiv was associated with the attention and citations received by the corresponding peer-reviewed article, we assembled a dataset of 74,239 articles, 5,405 of which had a preprint, published in 39 journals. Using log-linear regression and random-effects meta-analysis, we found that articles with a preprint had, on average, a 49% higher Altmetric Attention Score and 36% more citations than articles without a preprint. These associations were independent of several other article- and author-level variables (such as scientific subfield and number of authors), and were unrelated to journal-level variables such as access model and Impact Factor. This observational study can help researchers and publishers make informed decisions about how to incorporate preprints into their work.

Keywords: citations; computational biology; none; preprints; scientific publishing; systems biology.


Conflict of interest statement

DF, JH No competing interests declared

Figures

Figure 1.
Figure 1.. Absolute effect size of having a preprint, by metric (Attention Score and number of citations) and journal.
Each point indicates the predicted mean of the Attention Score (middle column) and number of citations (right column) for a hypothetical article with (green) or without (orange) a preprint, assuming the hypothetical article was published three years ago and had the mean value (i.e., zero) of each of the top 15 MeSH term PCs and the median value (for articles in that journal) of number of authors, number of references, U.S. affiliation status, Nature Index affiliation status, and last author publication age. Error bars indicate 95% confidence intervals. Journal names correspond to PubMed abbreviations: number of articles with (green) and without (orange) a preprint are shown in the left column. Journals are ordered by the mean of predicted mean Attention Score and predicted mean number of citations.
Figure 1—figure supplement 1.
Figure 1—figure supplement 1.. Accuracy of automatically inferring last-author publications from names and affiliations in PubMed.
Each point represents one of the 100 randomly selected articles. The gray line represents y = x. For details, see Supplementary file 14.
Figure 1—figure supplement 2.
Figure 1—figure supplement 2.. Histogram of the number of days by which release of the preprint preceded publication of the peer-reviewed article, including articles from all journals.
Figure 1—figure supplement 3.
Figure 1—figure supplement 3.. Scatterplots of Attention Score (with a pseudocount of 1) for articles in each journal.
Figure 1—figure supplement 4.
Figure 1—figure supplement 4.. Scatterplots of number of citations (with a pseudocount of 1) for articles in each journal.
For ease of visualization, 23 articles with more than 1024 citations were set to have exactly 1024 citations.
Figure 1—figure supplement 5.
Figure 1—figure supplement 5.. Scatterplots of number of citations vs. Attention Score for articles in each journal.
For ease of visualization, 23 articles with more than 1,024 citations were set to have exactly 1,024 citations.
Figure 1—figure supplement 6.
Figure 1—figure supplement 6.. Percentage of variance in MeSH term assignment explained by the top 15 principal components for each journal.
Figure 1—figure supplement 7.
Figure 1—figure supplement 7.. Scores for the top two principal components of MeSH term assignments for each journal.
Each point represents an article.
Figure 1—figure supplement 8.
Figure 1—figure supplement 8.. Comparing mean absolute error (MAE) and mean absolute percentage error (MAPE) of Gamma and log-linear regression models for each metric.
Each point represents a journal. The gray line indicates y = x.
Figure 1—figure supplement 9.
Figure 1—figure supplement 9.. Absolute effect size of having a preprint, by metric and journal.
The plots were generated identically to Figure 1, except they show 95% prediction intervals instead of 95% confidence intervals. Confidence intervals represent uncertainty in the population mean, whereas prediction intervals represent uncertainty in an individual observation. Thus, prediction intervals show the article-to-article variation in Attention Score and citations, even when all variables in the model are fixed.
Figure 2.
Figure 2.. Relative effect size of having a preprint, by metric (Attention Score and number of citations) and journal.
Fold-change corresponds to the exponentiated coefficient from log-linear regression, where fold-change >1 indicates higher Attention Score or number of citations for articles that had a preprint. A fold-change of 1 corresponds to no association. Error bars indicate 95% confidence intervals. Journals are ordered by mean log fold-change. Bottom row shows estimates from random-effects meta-analysis (also shown in Table 1). The source data for this figure is in Supplementary file 7.
Figure 2—figure supplement 1.
Figure 2—figure supplement 1.. Associations of MeSH term PCs with Attention Score and citations in each journal, based on model coefficients from log-linear regression.
P-values are not adjusted for testing multiple journals.
Figure 2—figure supplement 2.
Figure 2—figure supplement 2.. Comparing model fits with and without MeSH term PCs.
Comparison in terms of (A) fold-change (i.e., exponentiated coefficient) for preprint status and (B) t-statistic for each of five variables. Each point represents a journal-metric pair.

References

    1. Abdill RJ, Blekhman R. Tracking the popularity and outcomes of all bioRxiv preprints. eLife. 2019;8:e45133. doi: 10.7554/eLife.45133. - DOI - PMC - PubMed
    1. Austin PC, Steyerberg EW. The number of subjects per variable required in linear regression analyses. Journal of Clinical Epidemiology. 2015;68:627–636. doi: 10.1016/j.jclinepi.2014.12.014. - DOI - PubMed
    1. Benoit K, Watanabe K, Wang H, Nulty P, Obeng A, Müller S, Matsuo A. Quanteda: an R package for the quantitative analysis of textual data. Journal of Open Source Software. 2018;3:774. doi: 10.21105/joss.00774. - DOI
    1. Berg JM, Bhalla N, Bourne PE, Chalfie M, Drubin DG, Fraser JS, Greider CW, Hendricks M, Jones C, Kiley R, King S, Kirschner MW, Krumholz HM, Lehmann R, Leptin M, Pulverer B, Rosenzweig B, Spiro JE, Stebbins M, Strasser C, Swaminathan S, Turner P, Vale RD, VijayRaghavan K, Wolberger C. Preprints for the life sciences. Science. 2016;352:899–901. doi: 10.1126/science.aaf9133. - DOI - PubMed
    1. Bourne PE, Polka JK, Vale RD, Kiley R. Ten simple rules to consider regarding preprint submission. PLOS Computational Biology. 2017;13:e1005473. doi: 10.1371/journal.pcbi.1005473. - DOI - PMC - PubMed

Publication types