

The Implications of Lineage-Specific Rates for Divergence Time Estimation
- PMID: 31808929
- PMCID: PMC7302051
- DOI: 10.1093/sysbio/syz080
The Implications of Lineage-Specific Rates for Divergence Time Estimation
Abstract
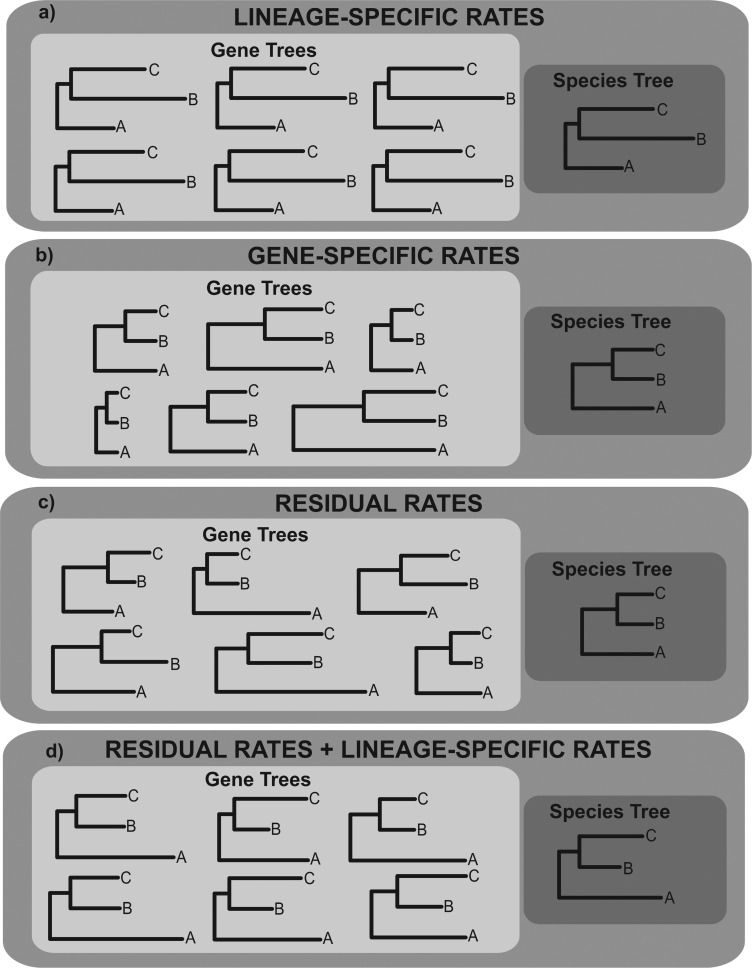
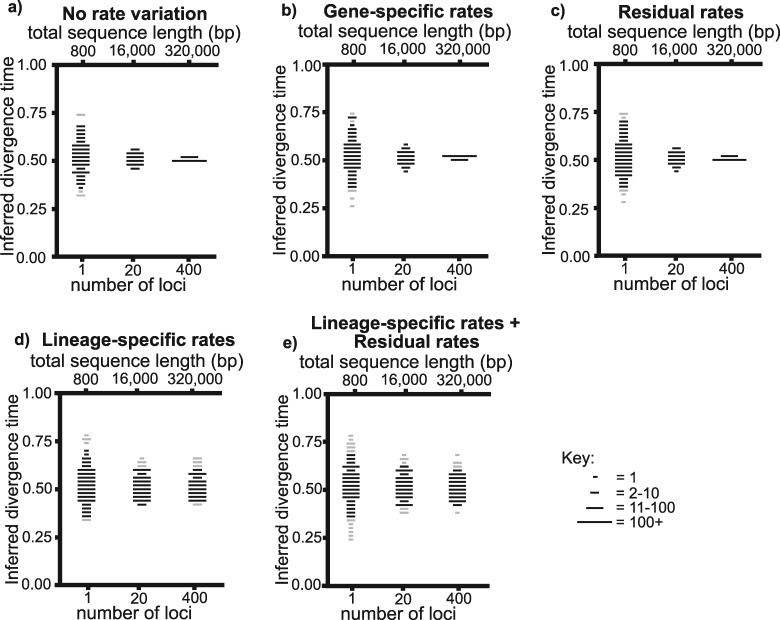
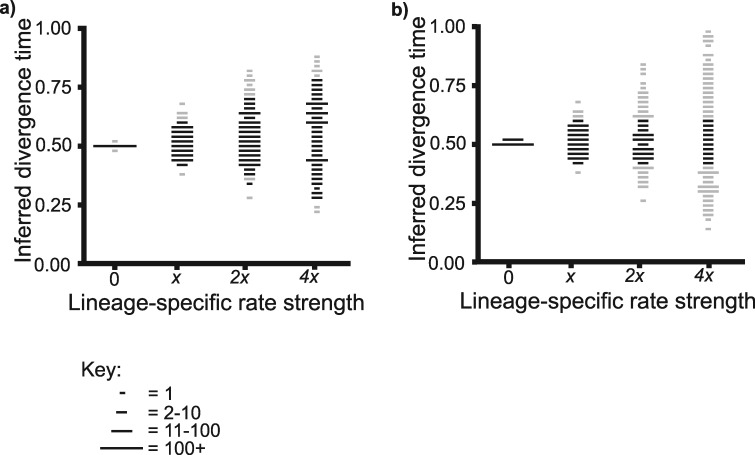
Rate variation adds considerable complexity to divergence time estimation in molecular phylogenies. Here, we evaluate the impact of lineage-specific rates-which we define as among-branch-rate-variation that acts consistently across the entire genome. We compare its impact to residual rates-defined as among-branch-rate-variation that shows a different pattern of rate variation at each sampled locus, and gene-specific rates-defined as variation in the average rate across all branches at each sampled locus. We show that lineage-specific rates lead to erroneous divergence time estimates, regardless of how many loci are sampled. Further, we show that stronger lineage-specific rates lead to increasing error. This contrasts to residual rates and gene-specific rates, where sampling more loci significantly reduces error. If divergence times are inferred in a Bayesian framework, we highlight that error caused by lineage-specific rates significantly reduces the probability that the 95% highest posterior density includes the correct value, and leads to sensitivity to the prior. Use of a more complex rate prior-which has recently been proposed to model rate variation more accurately-does not affect these conclusions. Finally, we show that the scale of lineage-specific rates used in our simulation experiments is comparable to that of an empirical data set for the angiosperm genus Ipomoea. Taken together, our findings demonstrate that lineage-specific rates cause error in divergence time estimates, and that this error is not overcome by analyzing genomic scale multilocus data sets. [Divergence time estimation; error; rate variation.].
© The Author(s) 2019. Published by Oxford University Press on behalf of the Society of Systematic Biologists.
Figures
Similar articles
-
The temporal dynamics of evolutionary diversification in Ipomoea.Mol Phylogenet Evol. 2020 May;146:106768. doi: 10.1016/j.ympev.2020.106768. Epub 2020 Feb 17. Mol Phylogenet Evol. 2020. PMID: 32081764
-
The 2 Sigma Genus Concept in mammalogy: Lessons from Lasiurus.PLoS One. 2025 Jun 25;20(6):e0325554. doi: 10.1371/journal.pone.0325554. eCollection 2025. PLoS One. 2025. PMID: 40560834 Free PMC article.
-
Systemic Inflammatory Response Syndrome.2025 Jun 20. In: StatPearls [Internet]. Treasure Island (FL): StatPearls Publishing; 2025 Jan–. 2025 Jun 20. In: StatPearls [Internet]. Treasure Island (FL): StatPearls Publishing; 2025 Jan–. PMID: 31613449 Free Books & Documents.
-
Signs and symptoms to determine if a patient presenting in primary care or hospital outpatient settings has COVID-19.Cochrane Database Syst Rev. 2022 May 20;5(5):CD013665. doi: 10.1002/14651858.CD013665.pub3. Cochrane Database Syst Rev. 2022. PMID: 35593186 Free PMC article.
-
Factors that impact on the use of mechanical ventilation weaning protocols in critically ill adults and children: a qualitative evidence-synthesis.Cochrane Database Syst Rev. 2016 Oct 4;10(10):CD011812. doi: 10.1002/14651858.CD011812.pub2. Cochrane Database Syst Rev. 2016. PMID: 27699783 Free PMC article.
Cited by
-
The research behind a taxonomic monograph: a case study from Ipomoea (Convolvulaceae).Kew Bull. 2024;79(4):897-914. doi: 10.1007/s12225-024-10184-6. Epub 2024 Nov 21. Kew Bull. 2024. PMID: 39618724 Free PMC article.
-
The taxonomy of two uncultivated fungal mammalian pathogens is revealed through phylogeny and population genetic analyses.Sci Rep. 2021 Sep 13;11(1):18119. doi: 10.1038/s41598-021-97429-7. Sci Rep. 2021. PMID: 34518564 Free PMC article.
-
The challenges of classifying big genera such as Ipomoea.Taxon. 2023 Dec;72(6):1201-1215. doi: 10.1002/tax.12887. Epub 2023 Mar 6. Taxon. 2023. PMID: 40687846 Free PMC article.
-
Phylogenomic Subsampling and the Search for Phylogenetically Reliable Loci.Mol Biol Evol. 2021 Aug 23;38(9):4025-4038. doi: 10.1093/molbev/msab151. Mol Biol Evol. 2021. PMID: 33983409 Free PMC article.
-
A nuclear phylogenomic tree of grasses (Poaceae) recovers current classification despite gene tree incongruence.New Phytol. 2025 Jan;245(2):818-834. doi: 10.1111/nph.20263. Epub 2024 Nov 20. New Phytol. 2025. PMID: 39568153 Free PMC article.
References
-
- Alfaro M.E., Faircloth B.C., Harrington R.C., Sorenson L., Friedman M., Thacker C.E., Oliveros C.H., Černý D., Near T.J.. 2018. Explosive diversification of marine fishes at the Cretaceous-Palaeogene boundary. Nat. Ecol. Evol. 2:688–696. - PubMed
-
- Aris-Brosou S., Yang Z.. 2003. Bayesian models of episodic evolution support a late precambrian explosive diversification of the metazoa. Mol. Biol. Evol. 20:1947–1954. - PubMed
-
- Bolker B., Butler M., Cowan P., de Vienne D., Eddelbuettel D., Holder M., Jombart T., Kembel S., Michonneau F., Orme D., O’Meara B., Paradis E., Regetz J., Zwickl D.. 2017. phylobase: base package for phylogenetic structures and comparative data. R package version 0.8.4 Available from: https://CRAN.R-project.org/package=phylobase.
-
- Britten R.J. 1984. Rates of DNA sequence evolution differ between taxonomic groups. Science 39:1393–1398. - PubMed
Publication types
MeSH terms
Grants and funding
LinkOut - more resources
Full Text Sources
Other Literature Sources
