

The Laboratory Domestication of Zebrafish: From Diverse Populations to Inbred Substrains
- PMID: 31808937
- PMCID: PMC7086173
- DOI: 10.1093/molbev/msz289
The Laboratory Domestication of Zebrafish: From Diverse Populations to Inbred Substrains
Abstract
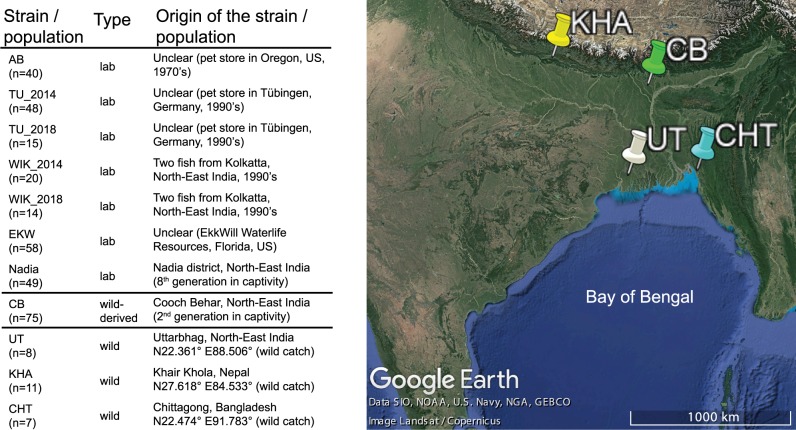
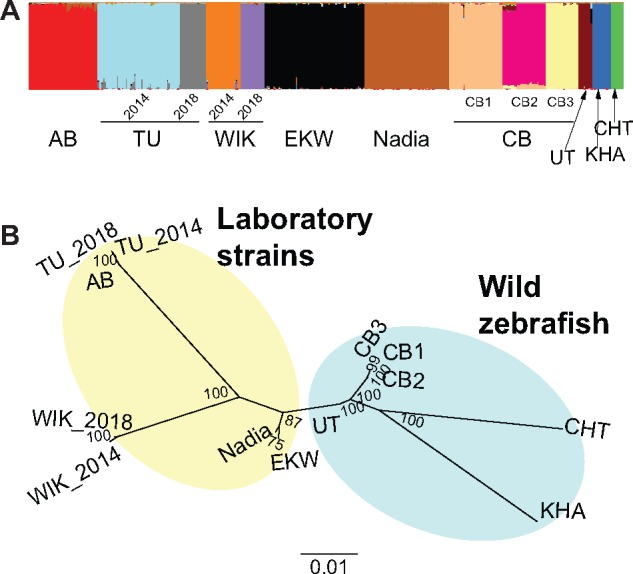
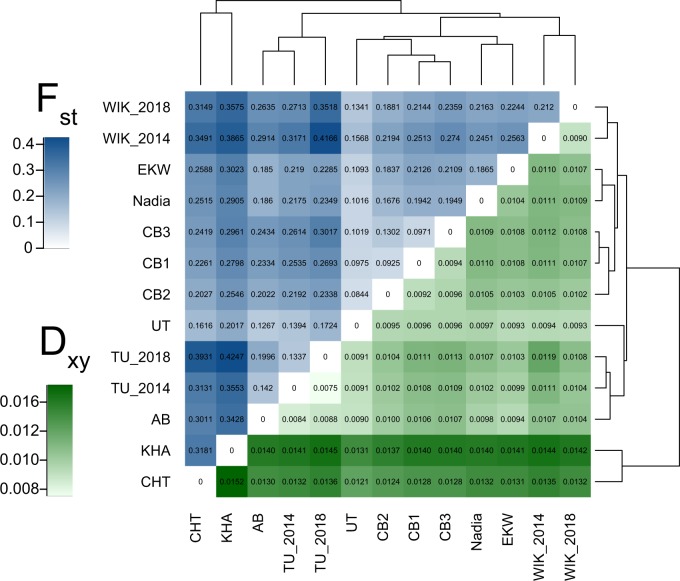
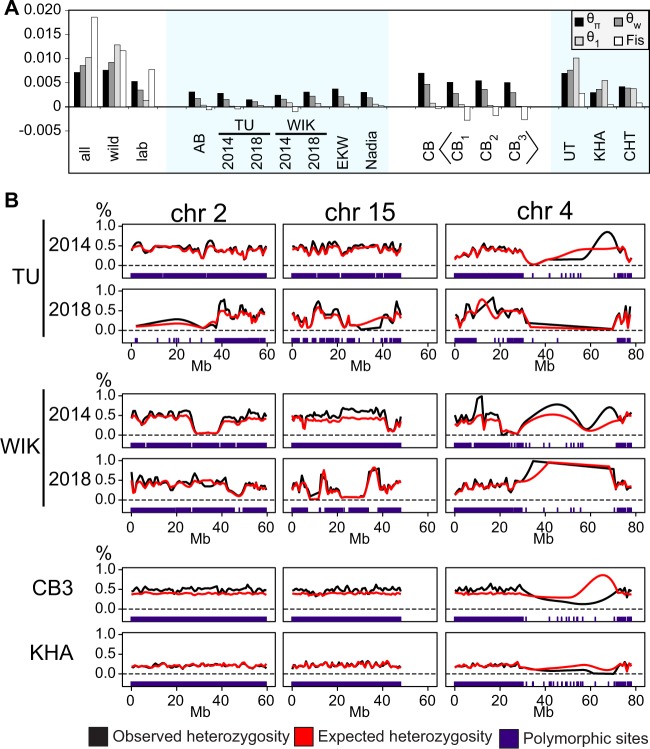
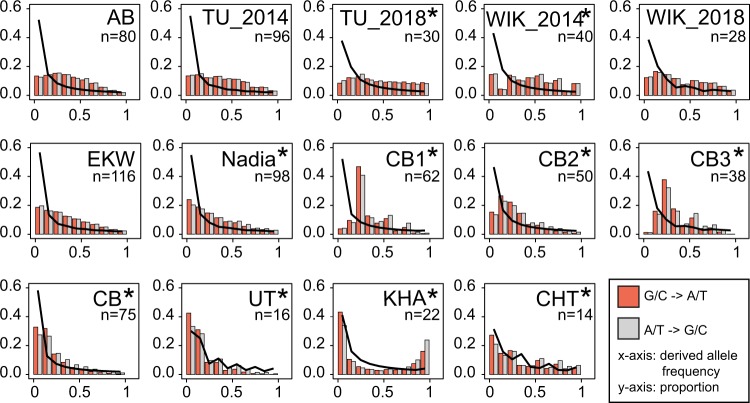
We know from human genetic studies that practically all aspects of biology are strongly influenced by the genetic background, as reflected in the advent of "personalized medicine." Yet, with few exceptions, this is not taken into account when using laboratory populations as animal model systems for research in these fields. Laboratory strains of zebrafish (Danio rerio) are widely used for research in vertebrate developmental biology, behavior, and physiology, for modeling diseases, and for testing pharmaceutic compounds in vivo. However, all of these strains are derived from artificial bottleneck events and therefore are likely to represent only a fraction of the genetic diversity present within the species. Here, we use restriction site-associated DNA sequencing to genetically characterize wild populations of zebrafish from India, Nepal, and Bangladesh, and to compare them to previously published data on four common laboratory strains. We measured nucleotide diversity, heterozygosity, and allele frequency spectra, and find that wild zebrafish are much more diverse than laboratory strains. Further, in wild zebrafish, there is a clear signal of GC-biased gene conversion that is missing in laboratory strains. We also find that zebrafish populations in Nepal and Bangladesh are most distinct from all other strains studied, making them an attractive subject for future studies of zebrafish population genetics and molecular ecology. Finally, isolates of the same strains kept in different laboratories show a pattern of ongoing differentiation into genetically distinct substrains. Together, our findings broaden the basis for future genetic, physiological, pharmaceutic, and evolutionary studies in Danio rerio.
Keywords: RAD-seq; genetic differentiation; genetic diversity; inbreeding; laboratory strains; wild populations; zebrafish.
© The Author(s) 2019. Published by Oxford University Press on behalf of the Society for Molecular Biology and Evolution.
Figures
Similar articles
-
Copy number variation and population-specific immune genes in the model vertebrate zebrafish.Elife. 2024 Jun 4;13:e98058. doi: 10.7554/eLife.98058. Elife. 2024. PMID: 38832644 Free PMC article.
-
Population genomics of wild and laboratory zebrafish (Danio rerio).Mol Ecol. 2011 Oct;20(20):4259-76. doi: 10.1111/j.1365-294X.2011.05272.x. Epub 2011 Sep 16. Mol Ecol. 2011. PMID: 21923777 Free PMC article.
-
QTL analysis of behavioral and morphological differentiation between wild and laboratory zebrafish (Danio rerio).Behav Genet. 2006 Mar;36(2):271-84. doi: 10.1007/s10519-005-9029-4. Epub 2006 Jan 12. Behav Genet. 2006. PMID: 16408248
-
Advancing biology through a deeper understanding of zebrafish ecology and evolution.Elife. 2015 Mar 25;4:e05635. doi: 10.7554/eLife.05635. Elife. 2015. PMID: 25807087 Free PMC article. Review.
-
Zebrafish breeding in the laboratory environment.ILAR J. 2012;53(2):161-8. doi: 10.1093/ilar.53.2.161. ILAR J. 2012. PMID: 23382347 Review.
Cited by
-
Genetic and epigenetic interplay allows rapid transgenerational adaptation to metal pollution in zebrafish.Environ Epigenet. 2022 Oct 22;8(1):dvac022. doi: 10.1093/eep/dvac022. eCollection 2022. Environ Epigenet. 2022. PMID: 36474803 Free PMC article.
-
EthoCRED: a framework to guide reporting and evaluation of the relevance and reliability of behavioural ecotoxicity studies.Biol Rev Camb Philos Soc. 2025 Apr;100(2):556-585. doi: 10.1111/brv.13154. Epub 2024 Oct 12. Biol Rev Camb Philos Soc. 2025. PMID: 39394884 Free PMC article. Review.
-
Copy number variation and population-specific immune genes in the model vertebrate zebrafish.Elife. 2024 Jun 4;13:e98058. doi: 10.7554/eLife.98058. Elife. 2024. PMID: 38832644 Free PMC article.
-
Facial analytics based on a coordinate extrapolation system (zFACE) for morphometric phenotyping of developing zebrafish.Dis Model Mech. 2023 Jun 1;16(6):dmm049868. doi: 10.1242/dmm.049868. Epub 2023 Jun 2. Dis Model Mech. 2023. PMID: 37102214 Free PMC article.
-
Immune gene variation associated with chromosome-scale differences among individual zebrafish genomes.Sci Rep. 2023 May 13;13(1):7777. doi: 10.1038/s41598-023-34467-3. Sci Rep. 2023. PMID: 37179373 Free PMC article.
References
-
- Ali A, Hu L, Zhao F, Qiu W, Wang P, Ma X, Zhang Y, Chen L, Qian A.. 2017. BPAG1, a distinctive role in skin and neurological diseases. Semin Cell Dev Biol. 69:34–39. - PubMed
Publication types
MeSH terms
Associated data
LinkOut - more resources
Full Text Sources
Molecular Biology Databases
Miscellaneous
