. 2019 Dec 6;14(12):e0225137.
doi: 10.1371/journal.pone.0225137. eCollection 2019.

Investigating gene expression profiles of whole blood and peripheral blood mononuclear cells using multiple collection and processing methods

Affiliations

Investigating gene expression profiles of whole blood and peripheral blood mononuclear cells using multiple collection and processing methods

Aarti Gautam et al. PLoS One. .

Abstract

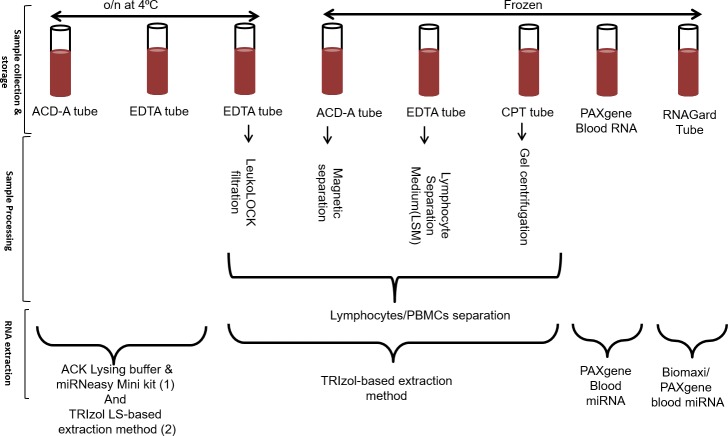
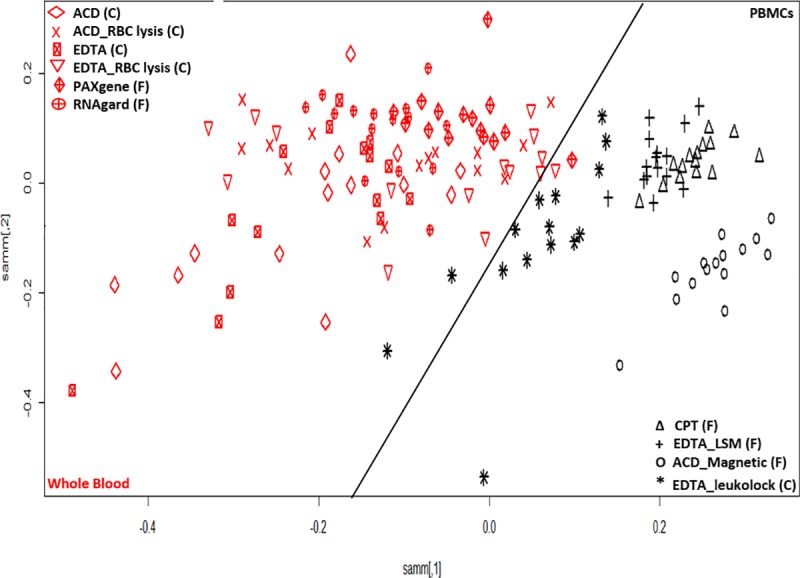
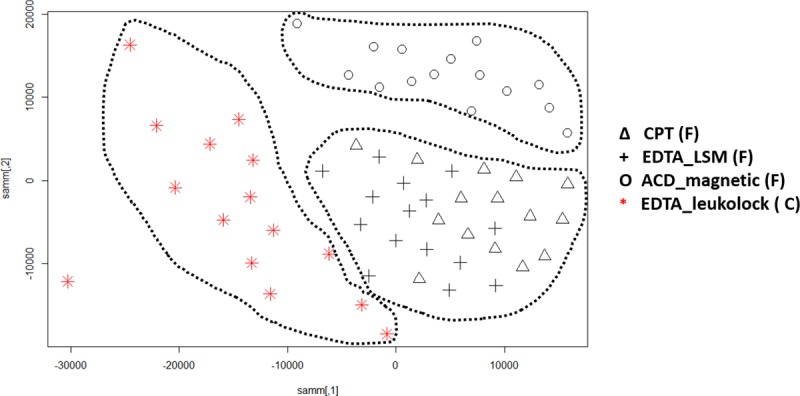
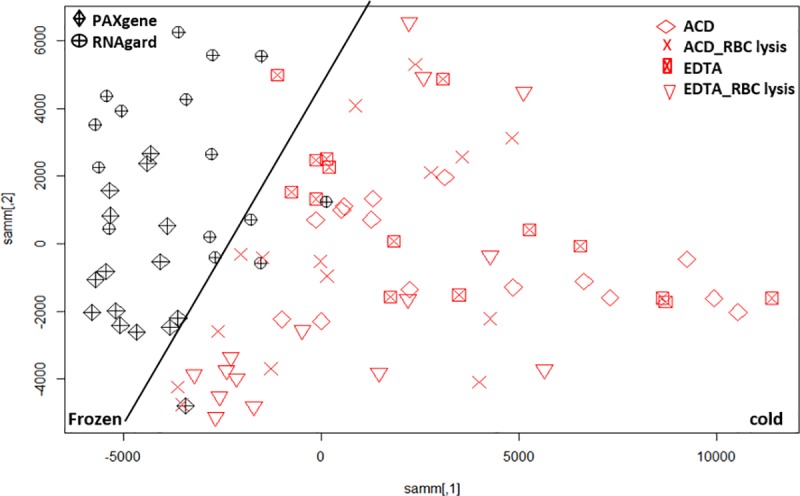
Gene expression profiling using blood samples is a valuable tool for biomarker discovery in clinical studies. Different whole blood RNA collection and processing methods are highly variable and might confound comparisons of results across studies. The main aim of the current study is to compare how blood storage, extraction methodologies, and the blood components themselves may influence gene expression profiling. Whole blood and peripheral blood mononuclear cell (PBMC) samples were collected in triplicate from five healthy donors. Whole blood was collected in RNAgard® and PAXgene® Blood RNA Tubes, as well as in collection tubes with anticoagulants such as dipotassium ethylenediaminetetraacetic acid (K2EDTA) and Acid Citrate Dextrose Solution A (ACD-A). PBMCs were separated using sodium citrate Cell Preparation Tubes (CPT™), FICOLL™, magnetic separation, and the LeukoLOCK™ methods. After blood collection, the LeukoLOCK™, K2EDTA and ACD-A blood tubes were shipped overnight using cold conditions and samples from the rest of the collection were immediately frozen with or without pre-processing. The RNA was isolated from whole blood and PBMCs using a total of 10 different experimental conditions employing several widely utilized RNA isolation methods. The RNA quality was assessed by RNA Integrity Number (RIN), which showed that all PBMC procedures had the highest RIN values when blood was stabilized in TRIzol® Reagent before RNA extraction. Initial data analysis showed that human blood stored and shipped at 4°C overnight performed equally well when checked for quality using RNA integrity number when compared to frozen stabilized blood. Comparisons within and across donor/method replicates showed signal-to-noise patterns which were not captured by RIN value alone. Pathway analysis using the top 1000 false discovery rate (FDR) corrected differentially expressed genes (DEGs) showed frozen vs. cold shipping conditions greatly impacted gene expression patterns in whole blood. However, the top 1000 FDR corrected DEGs from PBMCs preserved after frozen vs. cold shipping conditions (LeukoLOCK™ preserved in RNAlater®) revealed no significantly affected pathways. Our results provide novel insight into how RNA isolation, various storage, handling, and processing methodologies can influence RNA quality and apparent gene expression using blood samples. Careful consideration is necessary to avoid bias resulting from downstream processing. Better characterization of the effects of collection method idiosyncrasies will facilitate further research in understanding the effect of gene expression variability in human sample types.


Conflict of interest statement

The authors are affiliated with the US Army Center for Environmental Health Research. The views, opinions, and/or findings contained in this report are those of the authors and should not be construed as official Department of the Army position, policy, or decision, unless so designated by other official documentation. Citations of commercial organizations or trade names in this report do not constitute an official Department of the Army endorsement or approval of the products or services of these organizations.

Figures

Fig 1
Fig 1. Sample collection, processing and RNA extraction: Whole blood was collected in triplicate followed by peripheral blood mononuclear cells (PBMCs) separation in a subset of samples.
The following sample collection tubes were used for the study: RNAgard®, PAXgene® RNA, EDTA, ACD-A, and CPT tubes. The PBMC separation was done using standard procedures for CPT tubes, and magnetic bead, LeukoLOCK and LSM methods. The samples were then stored at either 4°C (Cold) or -80°C (Frozen) and shipped overnight (o/n) for follow-up RNA extraction. Next, they were treated with one or more of several different RNA extraction procedures: Biomaxi Precip Buffer/ PAXgene® Blood miRNA, PAXgene® Blood miRNA, TRIzol® LS, ACK Lysing Buffer/ Qiagen miRNeasy, and TRIzol® Reagent manufacturer’s protocol.
Fig 2
Fig 2. Microarray signal intensity distribution before and after normalization.
Raw (a) and normalized (b) microarray probe M values (log2 fold differences) obtained for five different individuals using all different blood collection systems. Colors represent individual donors.
Fig 3
Fig 3
Two dimensional Sammon projection using the top 50% of most variable transcripts (25370) for whole blood (red) and PBMC (black). There is a clear distinction in clusters for PBMCs and whole blood sample processing as marked by a black tilted line. All whole blood samples are shown on left side and PBMC samples are on the right side of the plot. The (F) and (C) denotes the frozen and cold conditions for the sample collection and storage. The description of all the legends is given here. PBMCs samples: ACD_Magnetic- blood collected in ACD-A tubes and separated using magnetic method followed by extraction using TRIzol® method. CPT—blood collected in CPT tubes and PBMCs separation using manufacturer recommendations followed by extraction using TRIzol® method. EDTA_LSM- blood collected in EDTA tube and PBMC separation using LSM followed by extraction using TRIzol® method. EDTA_Leukolock- blood collected in EDTA tube, PBMCs separated using LeukoLOCK method followed by extraction using TRIzol® method. Whole blood samples: ACD- blood collected in ACD-A tube followed by RNA extraction using TRIzol® LS method. ACD_RBC lysis- blood collected in ACD-A tube followed by RBC lysis using ACK buffer and RNA extraction using miRNAeasy extraction kit. EDTA_RBC lysis -blood collected in EDTA tube followed by RBC lysis using ACK buffer and RNA extraction using miRNAeasy extraction kit. EDTA- blood collected in EDTA tube followed by RNA extraction using TRIzol® LS method. PAXgene- blood collected in PAXgene® tube followed by RNA extraction using PAXgene® blood miRNA kit. RNAgard—blood collected in RNAgard® tube followed by RNA extraction using Biomaxi Precip Buffer and PAXgene® Blood miRNA kit.
Fig 4
Fig 4
Sammon mapping using Manhattan distance of all probes for PBMCs sample separation methods where non-frozen LeukoLOCK separated (red) and cryopreserved samples (black) are shown as two distinct groups. The legends are described Fig 3. The CPT tubes and LSM separated PBMCs are clustered together whereas magnetic separation and LeukoLOCK separated PBMCs are clustered as distinct clusters with all clusters marked using a dotted line. The (F) and (C) denotes the frozen and cold conditions of the sample storage before RNA extraction.
Fig 5
Fig 5
Sammon mapping using Manhattan distance of significant probes (p<0.05) for whole blood sample preparation methods where non-preserved/cold conditions (red) and frozen/cryopreserved samples (black) are shown as two distinct groups and are shown separated by a black line. The legends are described in Fig 3.
Fig 6
Fig 6
(A) Venn diagram showing the common number of DEGs where comparisons of PBMCs and whole blood are affected by cryopreservation (frozen) vs. cold conditions are done. (B) Venn diagram showing the common DEGs from top 1000 mapped IDs using IPA where comparisons of PBMCs and whole blood are affected by cryopreservation (frozen) vs. cold conditions.
Fig 7
Fig 7. Hierarchical heatmap with diseases and bio-function category and top 5 high level functions are displayed and labeled inside the highlighted green border.
The visualization is a TreeMap (hierarchical heatmap) where the major boxes represent a family (or category) of related functions. Each individual colored rectangle is a particular biological function or disease and the color indicates associated log of the calculated BH corrected p-value: lower p value (purple), or higher p value (white). Darker colors indicate lower p values. In this default view, larger squares indicate more significant overlap between the genes perturbed in the dataset and the function or disease. The image has been cropped for better readability. Here data from whole blood when frozen vs. cold conditions are compared using top 1000 FDR corrected DEGs was used.

References

    1. Bushel PR, Heinloth AN, Li J, Huang L, Chou JW, Boorman GA, et al. Blood gene expression signatures predict exposure levels. Proceedings of the National Academy of Sciences. 2007;104(46):18211–6. 10.1073/pnas.0706987104 - DOI - PMC - PubMed
    1. Hofmann T, Klenow S, Borowicki A, Gill CIR, Pool-Zobel BL, Glei M. Gene expression profiles in human peripheral blood mononuclear cells as biomarkers for nutritional in vitro and in vivo investigations. Genes & Nutrition. 2010;5(4):309–19. 10.1007/s12263-010-0170-1 PMC2989368. - DOI - PMC - PubMed
    1. Gliddon HD, Herberg JA, Levin M, Kaforou M. Genome‐wide host RNA signatures of infectious diseases: discovery and clinical translation. Immunology. 2018;153(2):171–8. 10.1111/imm.12841 PMC5765383. - DOI - PMC - PubMed
    1. Asare AL, Kolchinsky SA, Gao Z, Wang R, Raddassi K, Bourcier K, et al. Differential gene expression profiles are dependent upon method of peripheral blood collection and RNA isolation. BMC genomics. 2008;9:474 10.1186/1471-2164-9-474 - DOI - PMC - PubMed
    1. Baechler EC, Batliwalla FM, Karypis G, Gaffney PM, Moser K, Ortmann WA, et al. Expression levels for many genes in human peripheral blood cells are highly sensitive to ex vivo incubation. Genes and immunity. 2004;5(5):347–53. 10.1038/sj.gene.6364098 . - DOI - PubMed

Publication types