. 2019 Dec 5;25(6):797-813.e9.
doi: 10.1016/j.stem.2019.11.004.

Hic1 Defines Quiescent Mesenchymal Progenitor Subpopulations with Distinct Functions and Fates in Skeletal Muscle Regeneration

Affiliations

Hic1 Defines Quiescent Mesenchymal Progenitor Subpopulations with Distinct Functions and Fates in Skeletal Muscle Regeneration

R Wilder Scott et al. Cell Stem Cell. .

Abstract

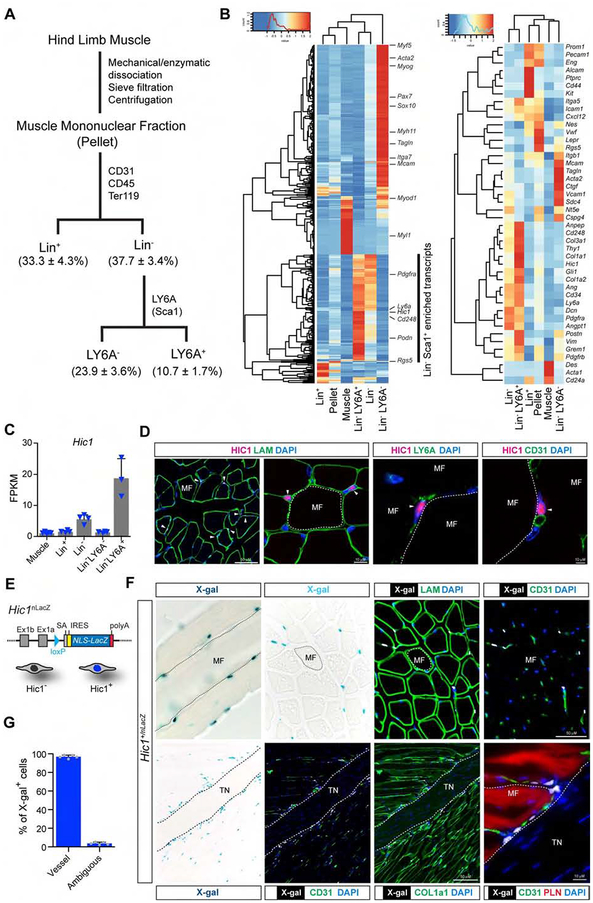
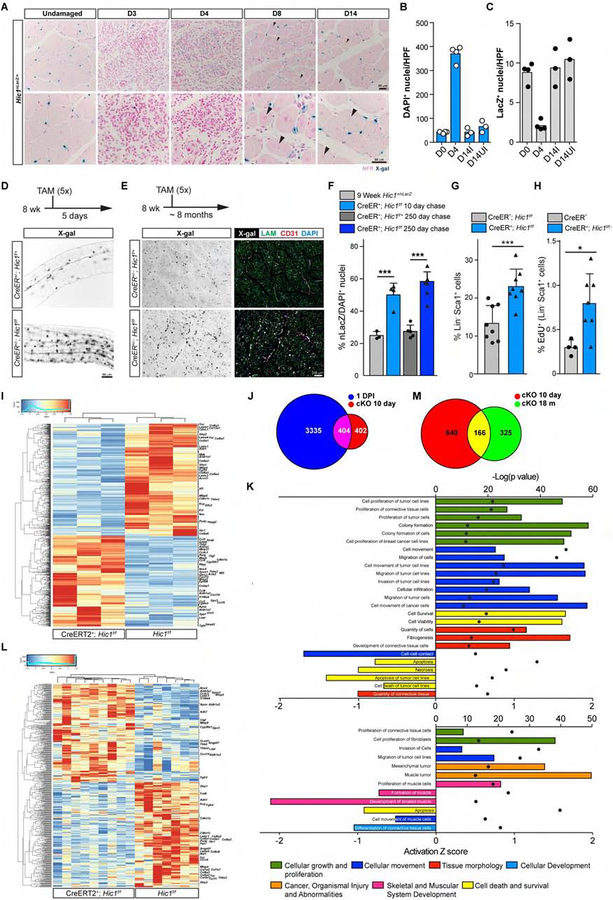
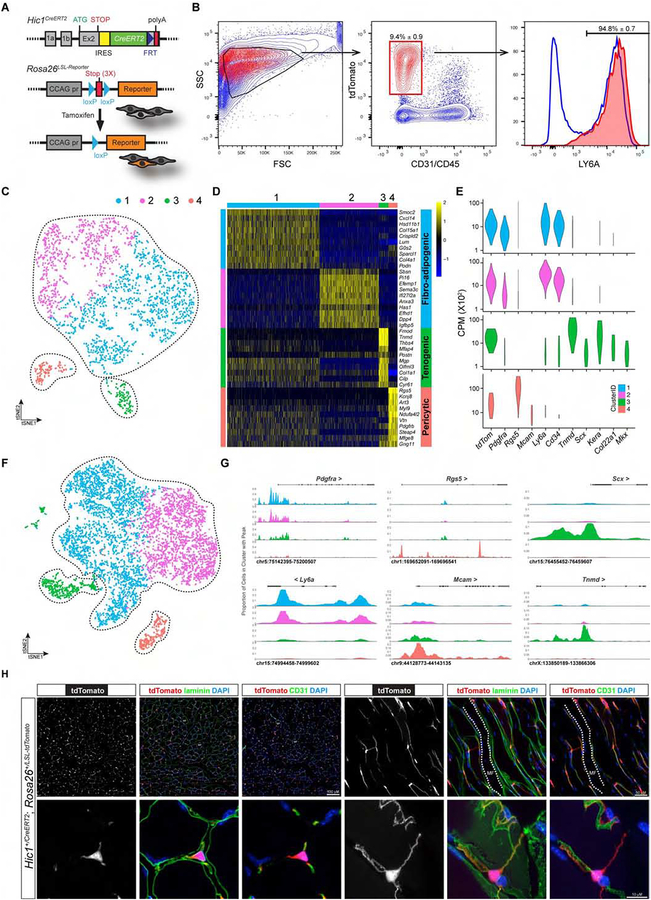
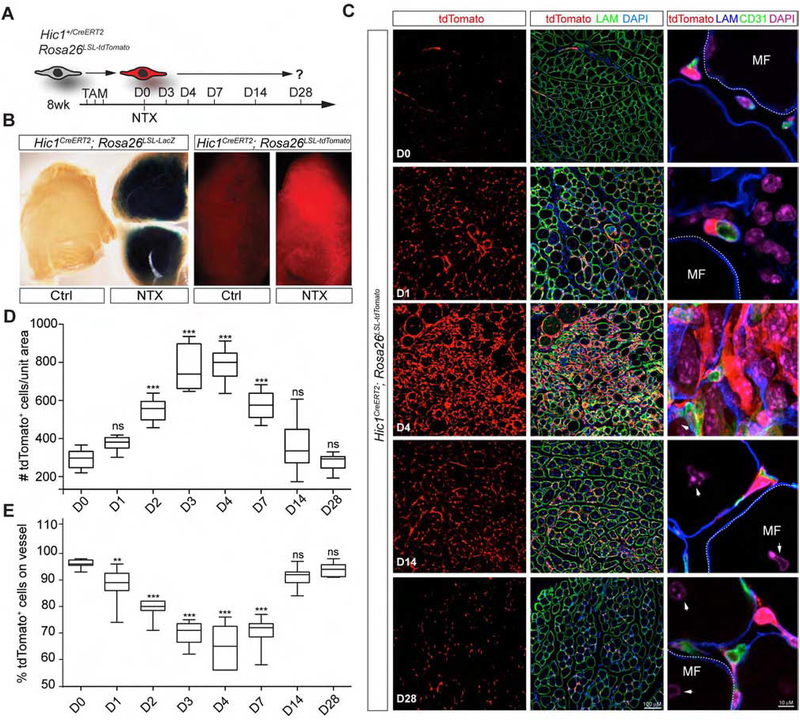
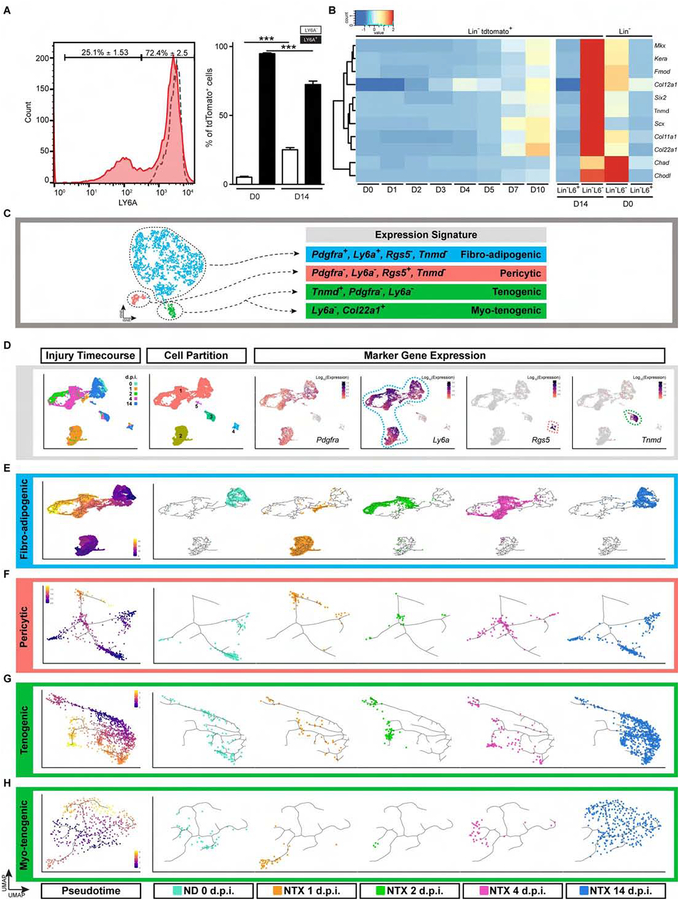
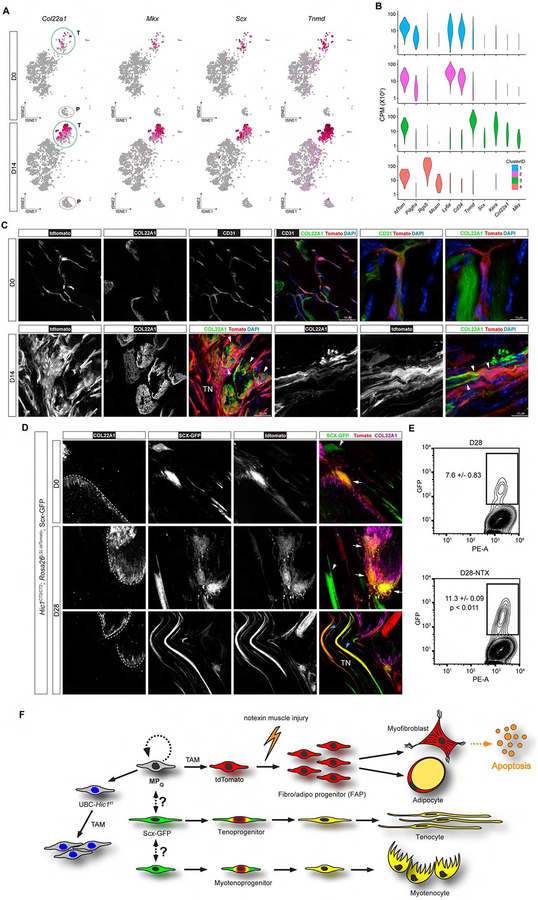
Many adult tissues contain resident stem cells, such as the Pax7+ satellite cells within skeletal muscle, that regenerate parenchymal elements following damage. Tissue-resident mesenchymal progenitors (MPs) also participate in regeneration, although their function and fate in this process are unclear. Here, we identify Hypermethylated in cancer 1 (Hic1) as a marker of MPs in skeletal muscle and further show that Hic1 deletion leads to MP hyperplasia. Single-cell RNA-seq and ATAC-seq analysis of Hic1+ MPs in skeletal muscle shows multiple subpopulations, which we further show have distinct functions and lineage potential. Hic1+ MPs orchestrate multiple aspects of skeletal muscle regeneration by providing stage-specific immunomodulation and trophic and mechanical support. During muscle regeneration, Hic1+ derivatives directly contribute to several mesenchymal compartments including Col22a1-expressing cells within the myotendinous junction. Collectively, these findings demonstrate that HIC1 regulates MP quiescence and identifies MP subpopulations with transient and enduring roles in muscle regeneration.

Keywords: lineage tracing; mesenchymal progenitors; myotendinous junction; pericytes; quiescence; scATAC-seq; scRNA-seq; skeletal muscle; tendon; tissue regeneration.


Conflict of interest statement

DECLARATION OF INTERESTS

The authors have no competing interests to declare.

Figures

Figure 1:
Figure 1:
Identification of Hic1 as an enriched transcript in MPs. A, schematic overview of the strategy used to purify MPs from TA muscle. Numbers in parentheses indicate percent of the total mononuclear fraction from 3 independent isolations (see Figure S1A for markers and sorting gates). B, heat map from RNA-seq analysis of the various fractions indicated in A. Select genes associated with various cell types within muscle are shown in the right panel, with Hic1 showing enrichment in the Lin LY6A+ fraction. C, Hic1 transcript abundance in the different fractions from the RNA-seq analyses (n = 3–4, data represent the mean ± SD). D, representative image of anti-HIC1 staining of 8 wk adult TA muscle counterstained with Laminin, LY6A or CD31. White arrowheads, HIC1+ cells. E, schematic representation of the Hic1 null allele that expresses nuclear LacZ (see Figure S1E for Hic1 knock-in allele description). F, the distribution of Hic1+ cells was evaluated in representative whole-mount (upper left panel) and in situ X-gal stained sections of TA muscles and the myotendinous junction (bottom series) from Hic1+/nLacZ mice. PLN, phalloidin+ muscle fibre. G, Hic1+ cells were enumerated from stained samples in F (n = 5, data represent the mean ± SD). MF, myofibre; TN, tendon.
Figure 2:
Figure 2:
HIC1 regulates MP quiescence: deletion of Hic1 leads to an increase in MP number and an activated MP-like phenotype. A, chronological series of representative X-gal stained muscle sections following TA muscle injury in Hic1nLacZ/+ mice. Arrowheads, centrally located nuclei in newly regenerated myofibres. B, enumeration of DAPI nuclei per high powered field (hpf) from A. UI, uninjured control; I, injured. C, quantification of X-gal stained Hic1+ cells from A (data represent the mean ± SD, n = 3–4). D, representative whole-mount images of X-gal stained myofibres 5 d post-TAM treatment from 9 wk old male mice. E, representative histological images of X-gal stained cells from Hic1-deleted and non-deleted TA muscles at 8 months post-TAM. F, enumeration of X-gal stained cells from TA muscles (n = 3–5, data represent the mean ± SD, one-way ANOVA Bonferroni post-test, ***p<0.001 relative to 9 wk Hic1+/nLacZ baseline). G, FCM analysis of LinLY6A+ MPs in TA muscle from Hic1f/f and Hic1-deleted mice 10 d post-TAM injection (see Figure S2E for sorting gates and markers) (n = 8, data represent the mean ± SD, unpaired t-test ***p<0.001). H, FCM analysis of EdU incorporation in LinLY6A+ MPs from wild-type and Hic1-deleted mice (n ≥ 4). Mice received TAM at 2 m of age and 3 consecutive daily doses (0.5 mg/mouse) of EdU starting on day 5 post-TAM and were collected for analysis 24 h after the last EdU injection (n = 4–7, data represent the mean ± SD, unpaired t-test *p<0.05). I, heatmap of differentially expressed genes (Cuffdiff, q< 0.05) from RNA-seq analysis of sorted MPs from 2 m TA muscles, (n = 3). J, pairwise Venn diagram plots of overlapping gene expression between the indicated datasets. The 1 d p.i. dataset was generated using a comparison of 0 d MPs to 1 d p.i. as described in Figure 5A. K, IPA interrogation of transcriptomic data, from data shown in I (top panel) and L (bottom panel). L, heatmap of differentially expressed genes (Cuffdiff, q< 0.05) from RNA-seq analysis of whole 18 m TA muscles (TAM at 2 m) (n = 7–9). M, pairwise Venn diagram plots of overlapping gene expression between samples described in H and K.
Figure 3:
Figure 3:
Generation and use of a Hic1CreERT2 knock-in allele to characterize Hic1+ MPs. A, overview of the Hic1CreERT2 knock-in allele and associated lineage-tracing strategy (see Figure S3A for description of Hic1 knock-in allele). B, FCM analysis of enzymatically dissociated TA muscles from Hic1CreERT2; Rosa26LSL-tdTomato mice post-TAM (n ≥ 4, data reflect the mean ± SD). C, t-SNE plot of scRNA-seq data from enriched tdTomato+ MPs 10 d post-TAM induction. D, heat-map of scRNA-seq data showing enriched genes in the 4 different clusters. E, violin plots showing expression of select lineage-associated genes from the scRNA-seq data. F, tSNE plot of scATAC-seq from enriched tdTomato+ MPs using a similar TAM injection regime as in D. The clusters indicative of the 4 populations were colored using the same convention as in C–E. G, genome browser tracks displaying the promoter sum signal around the indicated gene loci from the 4 defined clusters. H, representative transverse and longitudinal sections of the TA muscle at 5 d post-TAM, counterstained as indicated.
Figure 4:
Figure 4:
Marked transformation of the quiescent MP phenotype following injury-induced activation. A, experimental plan for lineage tracing of MPs using the Hic1CreERT2; reporter mice and NTX induced muscle injury. B, two different Cre-dependent LoxP-stop-LoxP (LSL) reporter lines were used to follow MP activation after injury. Representative stained, whole mount and imaged TA muscles are shown in non-damaged and 3 d p.i. C, immunodetection of indicated markers within representative TA muscle sections at various time points after NTX-induced injury (see Figure S4B for additional time points). D and E, quantification of tdTomato+ abundance (D) and distribution (E) (n = 3). One-way ANOVA Bonferroni post-test **p<0.01, ***p<0.001, relative to baseline. ns, not significant.
Figure 5:
Figure 5:
The activated MP phenotype displays stage-specific activities indicative of a coordinated response to injury. A, RNA-seq analysis of tdTomato+ enriched MPs at various time points p.i. Select gene profiles of identified cellular programs are shown. Cxcl5, cytokines; Mki67, cell cycle; Postn, provisional matrix; Lamc1, basement membrane. B, heatmap from popRNA-seq of differentially-expressed cytokine genes after injury. C, representative image of anti-CXCL5 staining in control and NTX-injured TA muscles from Hic1;tdTomato reporter mice. Graph inset, quantification of CXCL5+tdTomato+ cells p.i. (n ≥ 3, data reflect the mean ± SD). D, scRNA-seq t-SNE clustering of cells at the indicated time points p.i. E, heat-map of scRNA-seq hierarchically clustered genes. The vertical colored lines reflect the programs indicated in A. T, tenogenic cluster; P, pericytic cluster. F, t-SNE plots of scRNA-seq data for Pdgfra and Cxcl5. The pericytic and tendogenic lineages are indicated by salmon and green dashed lines, respectively. G, analysis of cytokine gene chromatin accessibility and gene expression using scATAC-seq and scRNA-seq, respectively. Genome browser tracks displaying the promoter sum signal around the indicated gene loci from the 4 defined clusters from scATAC-seq (D0) are shown along with the corresponding tSNE plot of the scRNA-seq expression data. H, heatmap from popRNA-seq highlighting genes associated with cell proliferation. I, t-SNE plots of clusters expressing Mki67 at different times p.i. J, analysis of EdU+, tdTomato+ cells at 0 and 4 d p.i. including representative images of stained sections (see Figure S5C for sorting gates and markers) (n ≥ 3, data reflect the mean ± SD, unpaired t-test ***p<0.001). K, multiple genes associated with provisional ECM production and turnover are coordinately expressed starting at D1 through to D14 (see Figure S5E for additional genes). L, distribution of Postn and Lox transcripts in t-SNE derived clusters of single cells (scRNA-seq). M, genome browser tracks showing the promoter sum signal around the Lox and Postn gene loci within the 4 different clusters (scATAC-seq) from tdTomato+ cells at D0. N, representative images of IF staining of 0, 4 and 14 d p.i. TA muscles from Hic1; tdTomato reporter mice with anti-POSTN.
Figure 6:
Figure 6:
Hic1-tracked MPs directly contribute to multiple mesenchymal cell types within the regenerated muscle. A, FCM analysis of LY6A expression in tdTomato+ cells 14 d p.i. shows a significant increase in LY6A+tdTomato+ cells. The dashed line represents the undamaged sample at 0 d (n ≥ 3, data reflect the mean ± SD, one-way ANOVA Bonferroni post-test, *** p<0.001). B, popRNA-seq analysis of tdTomato+ enriched fraction from D14 TA muscle p.i. shows enrichment of transcripts associated with tendon (Scx, Mkx, Tnmd and Kera) and the MTJ (Col22a1). C, tSNE overview of Hic1;tdTomato sub-populations and cluster-marker genes. D, UMAP (left panel) with cells colored by library ID indicative of the time of collection (see Figure S6A for UMAP colored by cluster). Cell partitions identified through Monocle3 and the representative markers (Pdgfra, Ly6a, Rgs5 and Tnmd) used to identify the cell types. E, UMAP plot (left panel) of pseudotime trajectories for the FAP subpopulation. The right panels contain plots of the individual time points (library ID). F-H, replicate of what is shown in D for the pericytic (F), tenogenic (G) and myotenogenic (H) populations.
Figure 7:
Figure 7:
Hic1-marked MPs directly contribute to regeneration of the myotendinous junction. A, t-SNE plots from scRNAseq-analyses of Hic1;tdTomato sorted MPs. Tendon-expressed genes are shown from 2,173 and 3,527 profiled cells from D0 and D14, respectively. B, violin plots of gene expression for the clusters shown in Figure 3E. C, representative images of anti-COL22a1 stained sections from uninjured and 14 d p.i. TA muscles (white arrowheads, tdTomato+ cells embedded in COL22a1 rich matrix). D, visualization of GFP (Scx-GFP) and tdTomato expression in representative images from within MTJ regions that were identified by anti-COL22A1 staining. White arrowheads indicate Scx-GFP single positive cells and white arrows denote GFP+tdTomato+ cells. Blue arrowheads indicate GFP+tdTomato+ tenocytes. E, FCM analysis of GFP+tdTomato+ cells prior to injury and at 28 d p.i. (n ≥ 3, data reflect the mean ± SD, unpaired t-test). F, overarching schematic of Hic1+ MP participation in muscle regeneration.

Comment in

Similar articles

Cited by

References

    1. Armulik A, Genove G, and Betsholtz C (2011). Pericytes: developmental, physiological, and pathological perspectives, problems, and promises. Dev Cell 21, 193–215. - PubMed
    1. Baghdadi MB, Castel D, Machado L, Fukada SI, Birk DE, Relaix F, Tajbakhsh S, and Mourikis P (2018). Reciprocal signalling by Notch-Collagen V-CALCR retains muscle stem cells in their niche. Nature 557, 714–718. - PMC - PubMed
    1. Bianco P (2014). “Mesenchymal” stem cells. Annu Rev Cell Dev Biol 30, 677–704. - PubMed
    1. Bianco P, and Robey PG (2015). Skeletal stem cells. Development 142, 1023–1027. - PMC - PubMed
    1. Cao J, Spielmann M, Qiu X, Huang X, Ibrahim DM, Hill AJ, Zhang F, Mundlos S, Christiansen L, Steemers FJ, et al. (2019). The single-cell transcriptional landscape of mammalian organogenesis. Nature 566, 496–502. - PMC - PubMed

MeSH terms

Substances