. 2019 Dec 5;25(6):814-829.e6.
doi: 10.1016/j.stem.2019.11.005.

Heterogeneity within Stratified Epithelial Stem Cell Populations Maintains the Oral Mucosa in Response to Physiological Stress

Affiliations

Heterogeneity within Stratified Epithelial Stem Cell Populations Maintains the Oral Mucosa in Response to Physiological Stress

Kevin M Byrd et al. Cell Stem Cell. .

Abstract

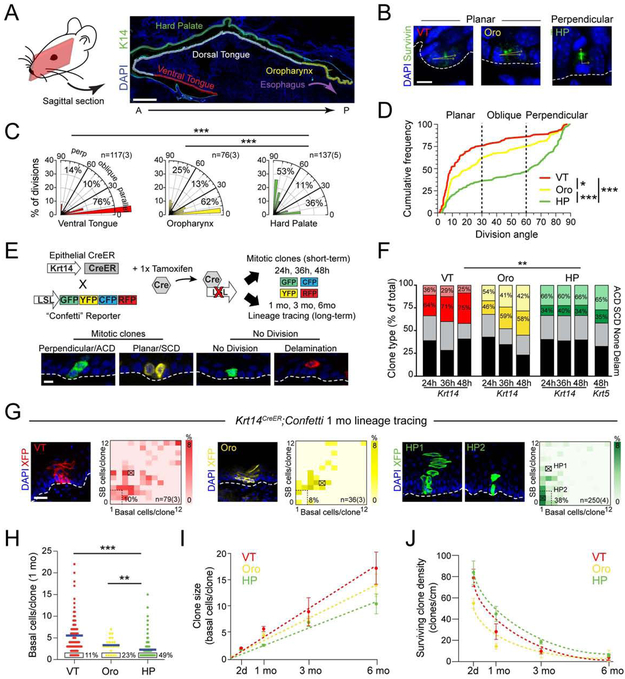
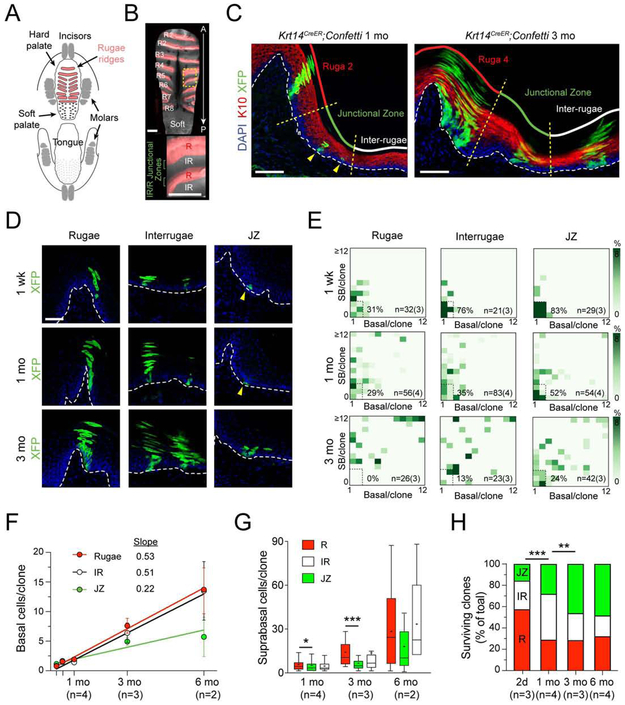
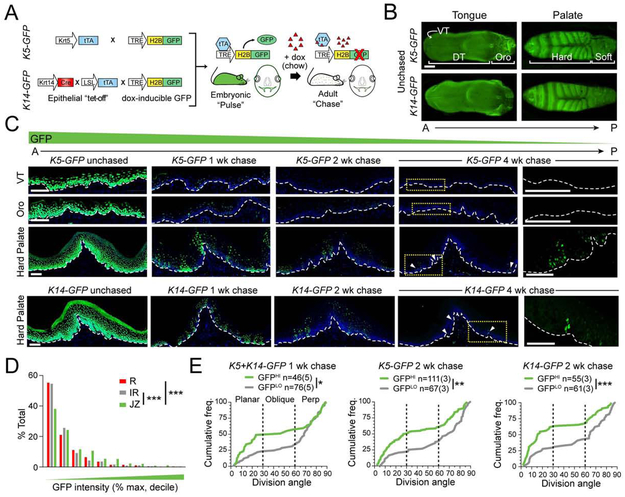
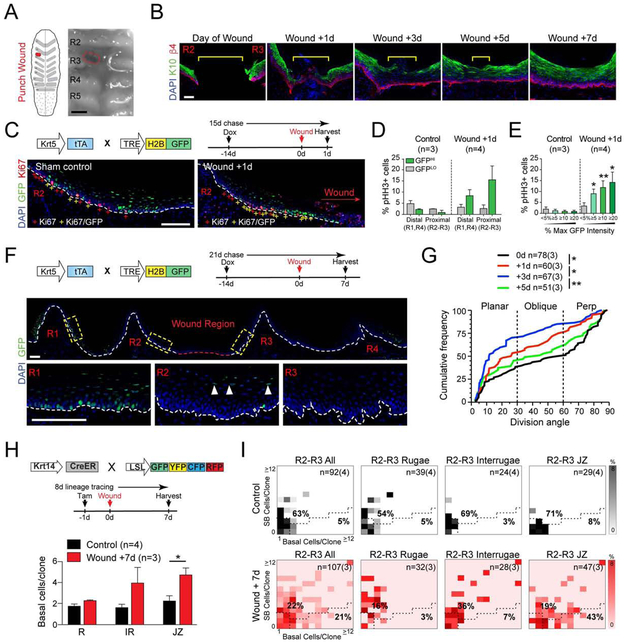
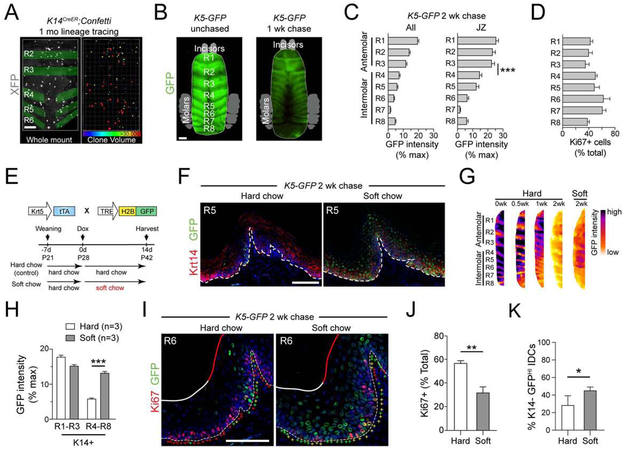
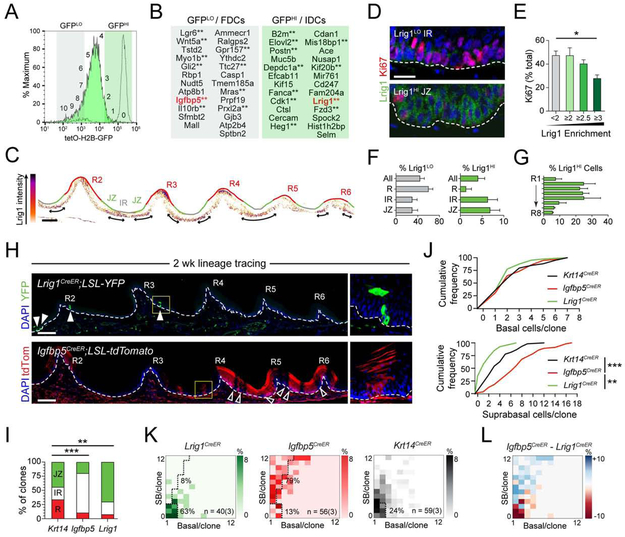
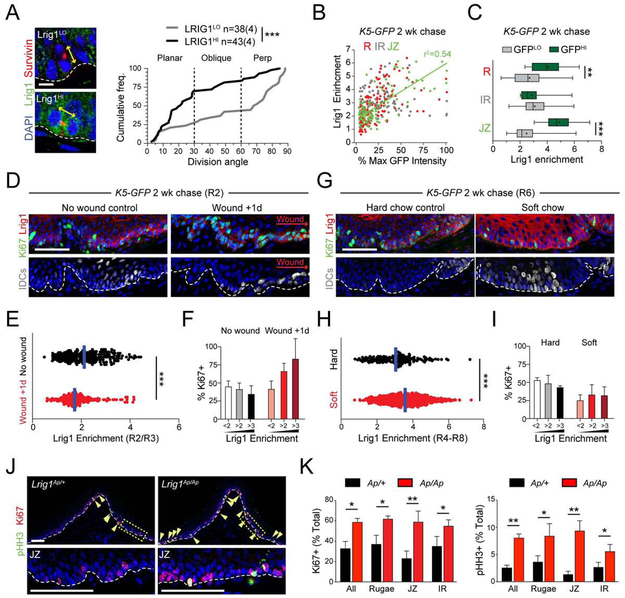
Stem cells in stratified epithelia are generally believed to adhere to a non-hierarchical single-progenitor model. Using lineage tracing and genetic label-retention assays, we show that the hard palatal epithelium of the oral cavity is unique in displaying marked proliferative heterogeneity. We identify a previously uncharacterized, infrequently-dividing stem cell population that resides within a candidate niche, the junctional zone (JZ). JZ stem cells tend to self-renew by planar symmetric divisions, respond to masticatory stresses, and promote wound healing, whereas frequently-dividing cells reside outside the JZ, preferentially renew through perpendicular asymmetric divisions, and are less responsive to injury. LRIG1 is enriched in the infrequently-dividing population in homeostasis, dynamically changes expression in response to tissue stresses, and promotes quiescence, whereas Igfbp5 preferentially labels a rapidly-growing, differentiation-prone population. These studies establish the oral mucosa as an important model system to study epithelial stem cell populations and how they respond to tissue stresses.

Keywords: Igfbp5; Lrig1; label retention; lineage tracing; oral epithelium; oriented cell division; palate; soft diet; stem cell; wound healing.


Conflict of interest statement

Declaration of Interests

We have no interests or conflicts to declare

Figures

Figure 1 ∣
Figure 1 ∣. Palatal epithelium displays unique renewal properties.
(A) Sagittal section of adult oral cavity. (B) High magnification images of late stage mitotic cells in ventral tongue (VT), oropharynx (Oro) and hard palate (HP) used to characterize division orientation. Angles (yellow) calculated relative to basement membrane (dashed line). (C,D) Division orientation by region, displayed as radial histograms (C) and cumulative frequency plots (D). (E) Overview of short-term and long-term lineage tracing strategies, with examples of the four different clonal patterns observed, quantified in (F). (G) 1 month Krt14CreER lineage tracing showing representative clones (left), indicated by X’s in clonal density arrays (CDAs, right). Bounding box defines slow-growing latent clones, defined as containing ≤2 basal and suprabasal (SB) cells; % of total clones that are latent is indicated. HP1 represents a SB-rich clone; HP2 represents a latent clone. (H) Basal cells/clone for each region, quantified as dot plots. The % of total clones with one basal cell is indicated by the boxed region; blue bars indicate means. (I,J) Clone size (I) and clonal density (J) over time; HP clones grow most slowly and have the lowest extinction rates. **p<0.01, ***p<0.0001, by χ2 (C,F), Kolmogorov-Smirnov test (D), or Mann-Whitney test (H). Data in (I,J) are mean ± s.e.m. ACD, asymmetric cell division; SCD, symmetric cell division. Scale bars: 500 μm (A), 25 μm (G), 10 μm (B,E); n values in (B,G) indicate cells and (animals/biological replicates); in (F,H-J), n = 3-5 animals per group per timepoint. See also Figure S1.
Figure 2 ∣
Figure 2 ∣. Lineage tracing reveals regional clonal diversity within the HP.
(A,B) Illustration (A) and whole mount (B) of the hard palate (HP) pseudocolored to demonstrate rugae (R1-R8, red) and interrugae regions (IR). Area within dashed box magnified below. (C) 1 mo and 3 mo lineage tracing in Krt14CreER;LSL-confetti HP reveals different clone sizes among HP regions: rugae (R, red); junctional zone (JZ, green); interrugae (IR, white). K10 (red) labels suprabasal (SB) differentiated cells. (D,E) Representative images (D) and CDAs (E) of R, IR and JZ after 1 wk, 1 mo, and 3 mo chases. Arrows in (D) indicate small clones; boxed regions and percentages in (E) indicate latent clone frequency. (F) Plot of basal cells/clone over time for each region; JZ grows most slowly up to 6 mo. (G) Tukey box-and-whisker plots (+, mean) comparing SB cells/clone showing reduced differentiation in JZ compared to R. (H) Quantification of surviving clone location over time reveals that JZ clones tend to be more persistent and long-lived compared to IR and R clones. *p<0.05, **p<0.01, ***p<0.0001, by Mann-Whitney test (G) and χ2 (H). Scale bars: 500 μm (B); 100 μm (C), 50 μm (D); n values in (F-H) indicate number of biological replicates.
Figure 3 ∣
Figure 3 ∣. Label-retaining cells are found in palate but not other OE.
(A) Schematic of tet-off genetic label retention assay. Induction was achieved in OE using one of two promoters, Krt5 or Krt14, with similar results. (B) Whole mount images of H2B-GFP expression in unchased adult tongue and palate. VT, ventral tongue; DT, dorsal tongue; Oro, oropharynx. (C) H2B-GFP+ label-retaining cells (LRCs) following 0, 1, 2, and 4 wk chase periods in indicated regions for K5-GFP (top three rows) and K14-GFP (bottom row) transgenics. Far right, high magnification images of yellow, boxed regions at 4 wks with DAPI (blue) removed; arrowheads indicate pockets of LRCs. (D) Quantification of GFP fluorescent intensity by region following a 2 wk chase, binned into deciles. (E) Cumulative frequency plots of division orientation for GFPLO (gray) and GFPHI (green) HP cells from K5-GFP and K14-GFP mice, chased for 1 or 2 wks. GFPHI populations trend toward planar SCDs, while GFPLO favor perpendicular ACDs. n values indicate cells and (biological replicates). Scale bars: 500 μm (B), 100 μm (C). *p<0.05, **p<0.01, ***p<0.0001, by Kolmogorov-Smirnov test (D,E). See also Figure S2.
Figure 4 ∣
Figure 4 ∣. IDCs are recruited during wound repair.
(A) Schematic (left) and stereoscope image (right) of puncture wound in the IR space between R2 and R3. Dotted red line represents wound site. (B) Wound healing timeline at 0, 1, 3, 5, and 7 days reveals rapid reapproximation (0-1 days) and reepithelialization (3-7 days). Yellow bracket shows wound margin. (C-E) K5-GFP mice chased for 2 wks then wounded between R2-R3 and harvested 1d later. (C) Colocalization of GFP+ LRCs with Ki67 in wound-proximal region in sham controls (left) and wound +1d (right) palates; + signs: Ki67+ (red), GFP/Ki67 double-positive (yellow). Quantification of pHH3+ mitotic cells in IDC (GFPHI) and FDC (GFPLO) populations (D) and binned by GFP expression levels (E) for regions distal (R1, R4) and proximal (R2,R3) to wound site. GFPHI populations become highly proliferative in the periwound area following injury. (F) Image of wound region in K5-GFP mice chased for 2 wks, wounded, and chased an additional 7d. Loss of GFP label retention 7d post-wound occurs specifically in wound-proximal rugae (R2/R3), but not in distal rugae (R1,R4). Boxed regions shown at higher magnification below; remaining LRCs in R2 are largely SB cells (arrows). (G) Cumulative frequency plot of division orientation in R2/R3 at 0d, 1d, 3d, and 5d post-wounding. Note transient switch toward planar SCDs 1-3d post-wounding, recovering to a normal bimodal distribution by 5d. (H, I) Lineage tracing using K14CreER; LSL-confetti mice, treated with tamoxifen 1d prior to wounding and harvested 7d later. (H) Comparison of basal cells/clone by region in control and wounded animals. (I) CDAs outlining basal-rich clonal expansion in the JZ following wounding. *p<0.05, **p<0.01, ***p<0.0001, by Kolmogorov-Smirnov (G) or Student’s t-test (D,E,H); n values in (G,I) represent cells and (biological replicates) or biological replicates in (D,E,H). Error bars are s.e.m. Scale bars: 100 μm. See also Figure S3.
Figure 5 ∣
Figure 5 ∣. IDCs are sensitive to physiologic masticatory forces.
(A) 4 wk lineage tracing of K14CreER; LSL-Confetti whole mount palate imaged with confocal microscope (RFP channel only) reveals a tendency toward larger clones by volume (μm3) in the intermolar rugae (R5-R6) compared to antemolar rugae (R2-R4). Clones were statistically color coded for volume (right). (B) Stereoscope image of 1 wk-chased K5-GFP whole mount palate revealing a tendency toward less GFP in the intermolar rugae compared to antemolar rugae. (C) Quantification of GFP label retention (% max intensity) by ruga shows significantly reduced levels in posterior HP compared to anterior whether comparing whole palate or JZ. (D) Proliferation, as assessed by Ki67, across each ruga. Greater Ki67 positivity is observed in intermolar rugae. (E) Schematic of label-retention assay in hard chow vs. soft diet. (F) Sagittal sections from K5-GFP mice chased for 2 wks on hard or soft chow showing increased GFP in both basal (K14+) and suprabasal (K14−) cells on soft diet. (G) Intensity coded images of LRC GFP expression in palate whole mounts for the chase periods indicated. Note both AP gradient in label retention in hard chow cohort as well as increased posterior label-retention in soft chow cohort. (H) Quantification of GFP intensity binned by max GFP fluorescence in basal OESCs. (I,J) Co-staining for Ki67 and LRCs in hard (left) and soft (right) chow; + signs: Ki67+ (red), GFP+ (green), double positive (yellow). Overall frequency of cycling cells in posterior palate on soft chow is significantly reduced (J). (K) Quantification of the % of GFPHI IDCs that are SB (K14−) for hard and soft diet conditions. A greater proportion of IDCs are SB in soft diet, indicative of decreased tissue turnover. *p<0.05, **p<0.01, ***p<0.0001, by Student’s t-test (C,H,J,K). Error bars are s.e.m. Scale bars: 250 μm (A,B), 100 μm (F,I). See also Figure S4.
Figure 6 ∣
Figure 6 ∣. RNAseq and lineage tracing reveal that Lrig1 marks IDCs and Igfbp5 FDCs.
(A) FACS histogram of K5-GFP 2 wk-chased GFPLO (FDC) and GFPHI (IDC) populations used for bulk RNAseq analysis. Original GFP signal in unchased K5-GFP cohort shown by dashed line for reference. (B) Top 25 significant differentially expressed genes in FDCs and IDCs with base mean greater than 25. Asterisks indicate genes that have reported roles in stem cell populations based on literature search. Genes in red indicate those used in this study for follow-up and validation. (C) Lrig1 protein intensity plot of R2-R6. Double arrows indicate regions of highest Lrig1 enrichment. (D,E) Co-labeling of Lrig1 with Ki67. Lrig1LO cells tend to be Ki67+ while Lrig1HI cells are Ki67-; quantified in (E). (F) Frequency of Lrig1LO (defined as <2x over background) and Lrig1HI (>3x over background) cells within each region. (G) Lrig1HI cell frequency by ruga, showing concentration in the in anterior rugae. (H) 2 wk lineage tracing using Lrig1CreER and Igfbp5CreER drivers. White arrows in Lrig1CreER tile scan reveal small latent clones; white open arrows in Igfbp5CreER highlight unlabeled JZ. Zoomed in images from yellow dashed rectangles at right. (I) Location of labeled clones for each driver line. (J) Quantification of basal and SB cells/clone for each driver (Krt14CreER, Igfbp5CreER and Lrig1CreER) show most significant differences in SB cell count. (J) CDAs of anterior clones for each driver. Note high frequency of latent clones in Lrig1CreER and high frequency of SB-rich clones in Igfbp5CreER. (L) Subtractive CDA reveals enrichment of SB-rich clones in Igfbp5CreER and latent clones in Lrig1CreER. *p<0.05, **p<0.01, by Student’s t-test (E), χ2 (I), or Kolmogorov-Smirnov test (J). Error bars in are s.e.m. Scale bars: 100 μm (C,H), 20 μm (D). n = 3 biological replicates per condition for (D-L). See also Figure S5.
Figure 7 ∣
Figure 7 ∣. Lrig1 adapts OESCs to tissue stress and maintains quiescence.
(A) Cumulative frequency distribution of division orientation for Lrig1LO (gray) and Lrig1HI (black) populations. Like IDCs (Figure 3E), Lrig1HI cells frequently execute planar divisions. (B) GFP intensity (% max) plotted against Lrig1 enrichment for cells located within the JZ (green), R (red) or IR (white). There is a strong positive correlation for the JZ (green line, r2 = 0.54). (D-F) R2 region in K5-GFP mice chased for 2 wks, 1d after wounding. (D) Lrig1 decreases in early wound healing as cycling concomitantly increases. Note that many IDCs near wound site are Ki67+. (E) Quantification of Lrig1 expression levels in periwound area 1d after wounding (red) and in unwounded controls (black). (F) Frequency of Ki67+ cells in Lrig1LO (<2x enrichment), Lrig1MED (2-3-fold enrichment) and Lrig1HI (>3-fold enrichment) populations. Lrig1HI cells, normally quiescent, re-enter the cell cycle 1d after wounding. (G-I) R6 region in K5-GFP mice chased for 2 wks on either hard or soft diet. (G) Lrig1 levels increase in soft diet as cycling (Ki67+) decreases. (H) Quantification of Lrig1 expression levels in intermolar rugae, showing a significant increase in Lrig1 expression on soft diet. (I) Ki67+ cell frequency binned by Lrig1 levels for hard and soft diet conditions. Soft diet leads to a global decrease in cycling. (J,K) Expression of proliferation markers in control (Lrig1Ap/+) and Lrig1-null (Lrig1Ap/Ap) HP. Arrowheads indicate mitotic (pHH3+, green) cells. Boxed areas of JZ shown at higher magnification below. (K) Quantification of Ki67 (left) and pHH3 (right) positivity, demonstrating significantly increased proliferation in Lrig1 Ap/Ap nulls, particularly in JZ region. *p<0.05, **p<0.01, by Student’s t-test except Kolmogorov-Smirnov in (A). Error bars in are s.e.m. Scale bars: 100 μm (J), 50 μm (D,G), 10 μm (A). n = 3 biological replicates for D-K. See also Figure S6.

References

    1. Alcolea MP, Greulich P, Wabik A, Frede J, Simons BD, and Jones PH (2014). Differentiation imbalance in single oesophageal progenitor cells causes clonal immortalization and field change. Nature cell biology 16, 615. - PMC - PubMed
    1. Aragona M, Dekoninck S, Rulands S, Lenglez S, Mascré G, Simons BD, and Blanpain C (2017). Defining stem cell dynamics and migration during wound healing in mouse skin epidermis. Nature communications 8, 14684. - PMC - PubMed
    1. Arwert EN, Hoste E, and Watt FM (2012). Epithelial stem cells, wound healing and cancer. Nat Rev Cancer 12, 170–180. - PubMed
    1. Asaka T, Akiyama M, Kitagawa Y, and Shimizu H (2009). Higher density of label-retaining cells in gingival epithelium. J Dermatol Sci 55, 132–134. - PubMed
    1. Bagan J, Sarrion G, and Jimenez Y (2010). Oral cancer: clinical features. Oral oncology 46, 414–417. - PubMed

Publication types