. 2019 Dec 20:22:353-368.
doi: 10.1016/j.isci.2019.11.009. Epub 2019 Nov 11.

MTA3 Represses Cancer Stemness by Targeting the SOX2OT/SOX2 Axis

Affiliations

MTA3 Represses Cancer Stemness by Targeting the SOX2OT/SOX2 Axis

Liang Du et al. iScience. .

Abstract

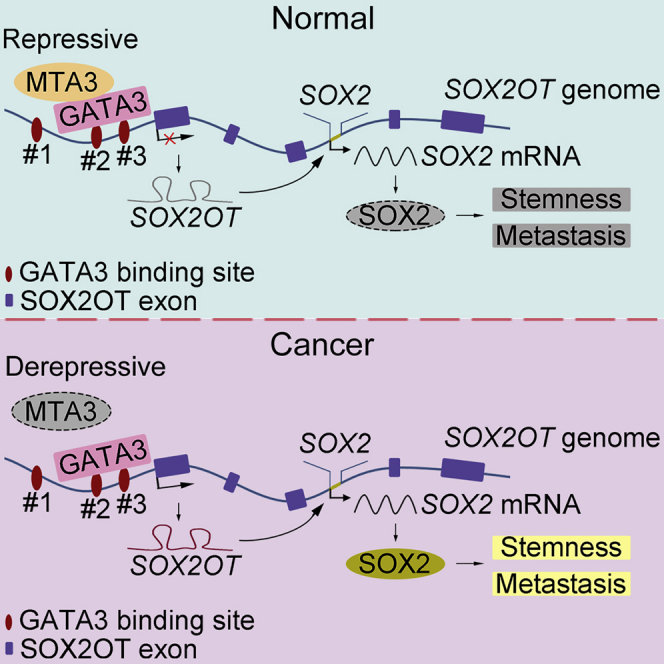
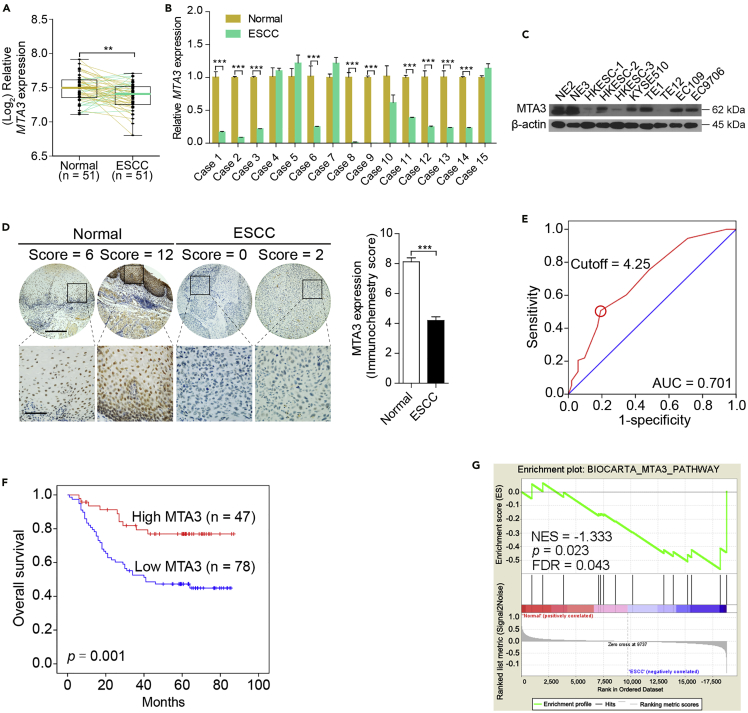
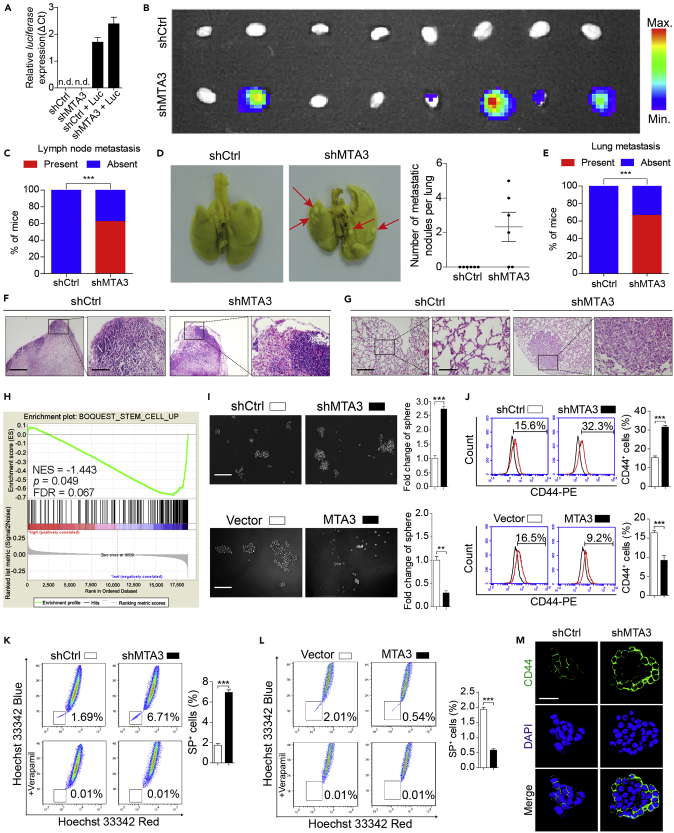
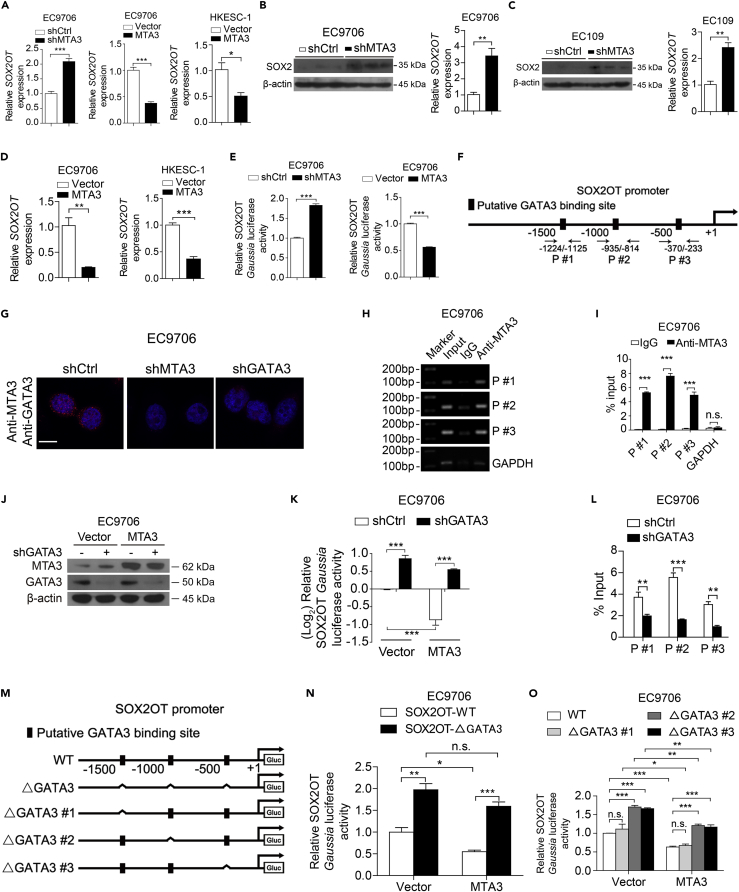
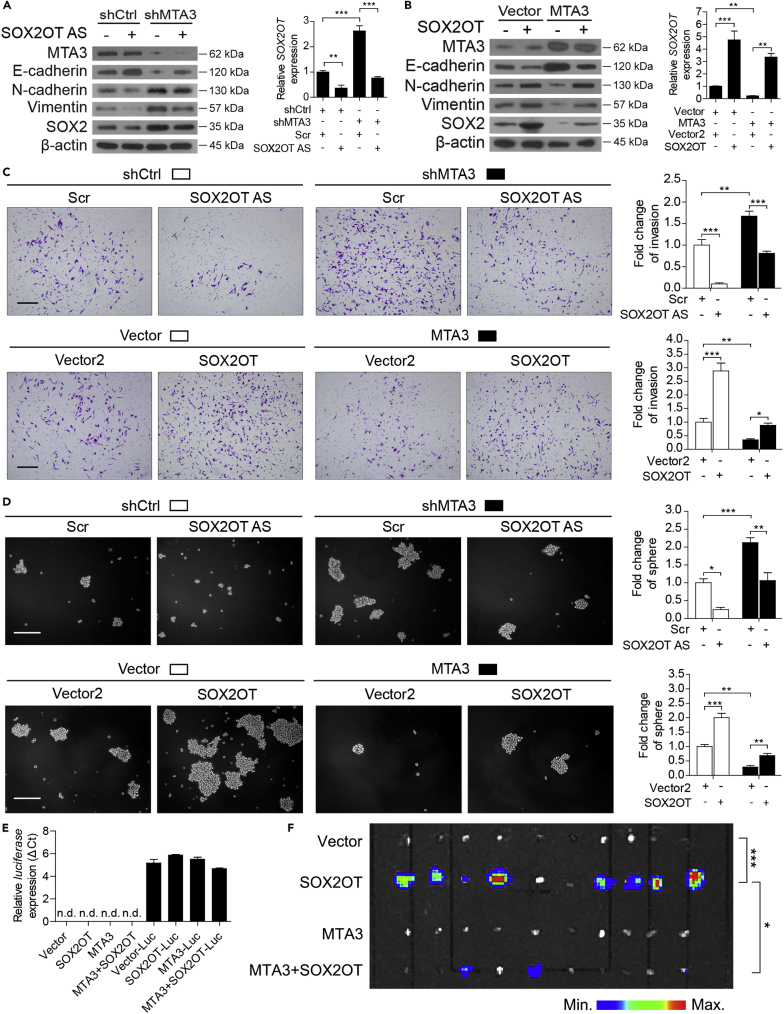
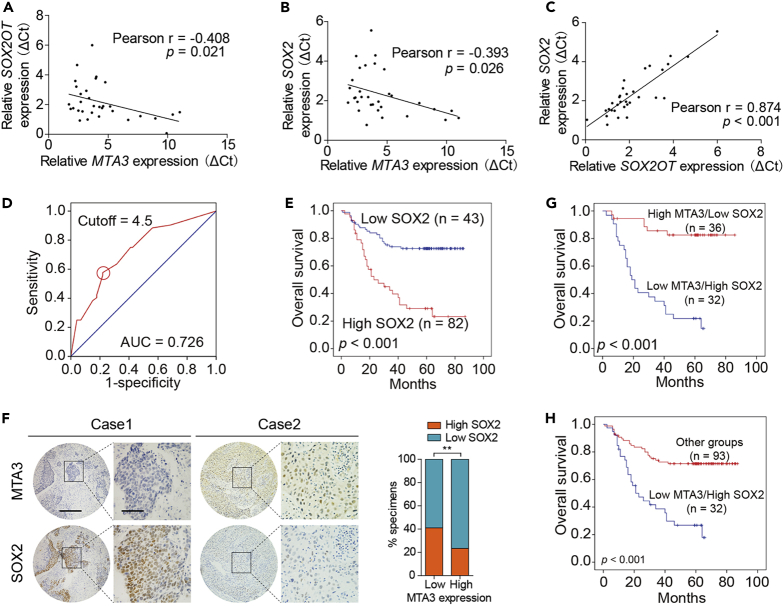
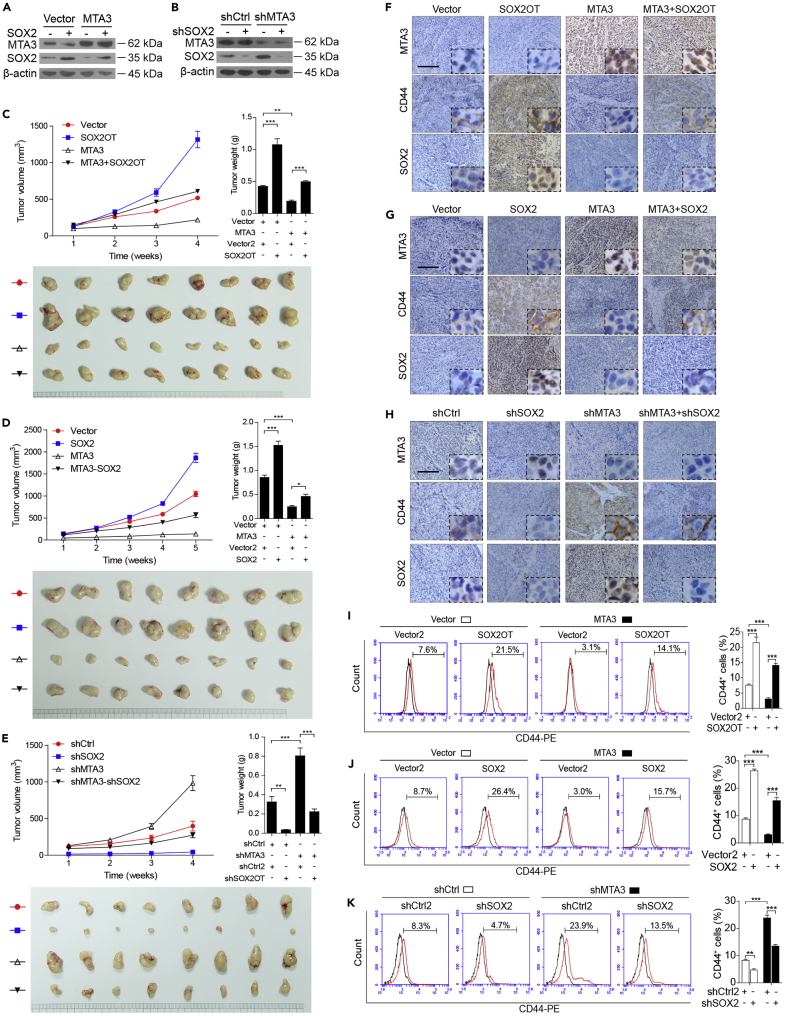
Cancer cell stemness (CCS) plays critical roles in both malignancy maintenance and metastasis, yet the underlying molecular mechanisms are far from complete. Although the importance of SOX2 in cancer development and CCS are well recognized, the role of MTA3 in these processes is unknown. In this study, we used esophageal squamous cell carcinoma (ESCC) as a model system to demonstrate that MTA3 can repress both CCS and metastasis in vitro and in vivo. Mechanistically, by forming a repressive complex with GATA3, MTA3 downregulates SOX2OT, subsequently suppresses the SOX2OT/SOX2 axis, and ultimately represses CCS and metastasis. More importantly, MTA3low/SOX2high is associated with poor prognosis and could serve as an independent prognostic factor. These findings altogether indicate that MTA3/SOX2OT/SOX2 axis plays an indispensable role in CCS. Therefore, this axis could be potentially used in cancer stratification and serves as a therapeutic target.

Keywords: Biological Sciences; Cancer; Cell Biology; Molecular Biology; Stem Cells Research.


Conflict of interest statement

The authors have declared that no conflict of interest exists.

Figures

None
Graphical abstract
Figure 1
Figure 1
Downregulation of MTA3 Correlates with Poor Prognosis in Human ESCC (A) The mRNA levels of MTA3 in the ESCC dataset GSE23400. (B) The mRNA levels of MTA3 in 15 human ESCC specimens and their paired normal adjacent tissues. (C) Western blot analysis of MTA3 in a panel of ESCC cell lines and two immortalized esophageal epithelial cell lines. β-Actin is used as a loading control. (D) Immunohistochemistry (IHC) of MTA3 in 125 human ESCC tissues and their paired adjacent normal tissues (left panel). The immunohistochemistry score of MTA3 in ESCC (filled bar) and the paired normal adjacent (open bar) tissues (right panel). Scale bars: upper panels, 400 μm; lower panels, 100 μm. (E) Receiver operating characteristic (ROC) curve analysis to determine the cutoff score for low expression of MTA3. (F) Kaplan-Meier curves compared the overall survival in patients with ESCC with high and low protein levels of MTA3. (G) GSEA plots of enrichment of BIOCARTA_MTA3_PATHWAY in normal adjacent tissues versus ESCC specimens in the GSE23400 dataset. FDR q, false-discovery rate q value; NES, normalized enrichment score. Data were shown as the means from at least three independent experiments or representative data. Error bars indicate SEM. **p < 0.01, ***p < 0.001 by Student's t test. See also Figure S1, Table S1, and Table S2.
Figure 2
Figure 2
MTA3 Suppresses Metastasis and Stemness of ESCC Cells (A) EC9706 cells transfected with shMTA3 or shCtrl were infected with lentiviruses carrying luciferase and then subjected to RNA extraction followed by qRT-PCR analysis of luciferase gene. (B–G) The EC9706 cells with or without MTA3 depletion were infected with recombinant lentiviruses carrying luciferase and injected subcutaneously into the flanks of nude mice (n = 8). The inguinal lymph nodes of the animals were extracted and analyzed for the presence of metastatic cells by bioluminescence imaging (B), and proportion of inguinal lymph nodes metastasis in the nude mice (C). EC9706 cells transfected with shMTA3 or shCtrl were injected intravenously through the tail vein of nude mice (n = 6). Representative images of lung metastasis were shown (D, left panel), numbers of metastatic nodules per lung in the nude mice (D, right panel), and proportion of lung metastasis in the nude mice (E). (F) The inguinal lymph nodes were analyzed by H&E. Scale bars: left panels, 400 μm; right panels, 100 μm. (G) Lung architecture is shown by H&E. Scale bars: left panels, 400 μm; right panels, 100 μm. (H) GSEA plots of enrichment of BOQOEST_STEM_CELL_UP signatures in MTA3High tumors versus MTA3Low tumors in the GSE23400 dataset. (I) Representative images of spheres formed by EC9706 cells with MTA3 depleted (upper panel) or overexpressed (lower panel). Histograms showing the fold change in the number of spheres formed by EC9706 cells with MTA3 depleted (upper right panel) or overexpressed (lower right panel). Scale bars: 200 μm. (J–L) (J) Flow cytometry analysis of the CD44+ population in EC9706 cells with MTA3 depleted (upper panel) or overexpressed (lower panel). Histograms showing the proportion of CD44+ cells in EC9706 cells with MTA3 depleted (upper right panel) or overexpressed (lower right panel). (K and L) Hoechst 33342 dye exclusion assay of the SP+ population in EC9706 cells with MTA3 depleted (K) or overexpressed (L). Histograms showing the proportion of SP+ cells in EC9706 cells with MTA3 depleted (K, right panel) or overexpressed (L, right panel). (M) Representative images of immunofluorescence for CD44 proportion in EC9706 cells with MTA3 depleted. Scale bars: 40 μm. Data are shown as the means of three independent experiments or representative data. Error bars indicate SEM. **p < 0.01, ***p < 0.001 by Student's t test or chi-square test, where appropriate. See also Figures S2–S5.
Figure 3
Figure 3
MTA3 Inhibits SOX2OT Transcription Depending on GATA3 (A) QRT-PCR of SOX2OT in EC9706 cells with MTA3 depletion or MTA3 overexpression and in HKESC-1 cells with MTA3 overexpression. (B–D) Western blot of SOX2 and qRT-PCR of SOX2OT in tumors derived from EC9706 (B) and EC109 (C) cells with MTA3 depletion, or EC9706 cells and HKESC-1 cells with MTA3 overexpression (D). (E) SOX2OT Gaussia luciferase reporter activity in EC9706 cells with MTA3 depletion or overexpression. (F) Schematic structure of the SOX2OT promoter and positions of ChIP primers. (G) Proximity Ligation Assay (PLA) detection of MTA3-GATA3 interaction. EC9706 cells transfected with the indicated shRNAs were subjected to PLA using antibodies against MTA3 or GATA3. Scale bars: 10 μm. (H and I) ChIP assay using antibodies against MTA3 or IgG. Semi-quantitative PCR (H) and qPCR (I) to detect the enriched DNA fragments in the SOX2OT promoter region. (J) Western blot of GATA3 in MTA3 overexpressed EC9706 cells transfected with shGATA3-expressing plasmid. β-Actin is shown as a loading control. (K) SOX2OT luciferase reporter activity in EC9706 cells transfected with the MTA3 or shGATA3 plasmids. (L) ChIP assay was performed in EC9706 cells with GATA3 depletion using antibodies against MTA3 or IgG, and qPCR was used to detect the enriched DNA fragments in the SOX2OT promoter region. (M) Schematic structure of deletion-mutation reporters of the SOX2OT promoter. (N and O) The SOX2OT promoter-reporter and mutations ΔGATA3 (N) or in GATA3-binding site 1 (ΔGATA3 #1), GATA3-binding site 2 (ΔGATA3 #2), GATA3-binding site 3 (ΔGATA3 #3) (O). The relative SOX2OT Gaussia luciferase reporter activities 72 h after transfection. Data are shown as the means of three independent experiments or representative data. Error bars indicate SEM, n.s., not statistically significant; *p < 0.05, **p < 0.01, ***p < 0.001 by Student's t test or a one-way ANOVA with post hoc intergroup comparisons, where appropriate. See also Figures S6 and S7, and Table S3.
Figure 4
Figure 4
MTA3 Regulates ESCC Cell Metastatic Potential and Stemness via SOX2OT (A and B) Western blot and qRT-PCR in EC9706 cells transfected with a combination of shMTA3 and SOX2OT AS oligo (A) or MTA3- and SOX2OT-expressing plasmid (B). (C and D) The above-mentioned cells were subjected to the cell invasion assay (C) and sphere assay (D). Representative fields of the invaded cells, and sphere (left panels). Histograms with the fold change in the number of invaded cells and spheres formed by the indicated cells (right panels). Scale bars: 200 μm in (C) and (D). (E) The indicated cells were infected with lentiviruses carrying luciferase and then subjected to RNA extraction followed by qRT-PCR analysis of luciferase gene. The inguinal lymph nodes were extracted and analyzed for the presence of metastatic cells by bioluminescence imaging. (F) EC9706 cells transfected with a combination of MTA3- and SOX2OT-expressing plasmid were infected with recombinant lentiviruses carrying luciferase and injected subcutaneously into the flanks of nude mice (n = 10). The inguinal lymph nodes of the animal were extracted and analyzed for the presence of metastatic cells by bioluminescence imaging. Data were shown as the means of three independent experiments or representative data. Error bars indicate SEM. *p < 0.05, **p < 0.01, ***p < 0.001 by one-way ANOVA with post hoc intergroup comparisons or chi-square test, where appropriate. See also Figure S8.
Figure 5
Figure 5
The Dysregulated MTA3-SOX2OT-SOX2 Axis Is Associated with Metastasis and Poor Prognosis (A–C) Pearson's correlations of MTA3 and SOX2OT (A), MTA3 and SOX2 (B), SOX2OT and SOX2 (C) in 32 primary human ESCC specimens. (D) ROC curve analysis was performed to determine the cutoff score for the overexpression of SOX2. (E) Kaplan-Meier curves compared the overall survival in patients with ESCC with high and low protein levels of SOX2. (F) Correlation of MTA3 and SOX2 IHC score in 125 primary human ESCC specimens (left panel). Percentage of samples showing low or high SOX2 ratio relative to the levels of MTA3 in 125 cases of human ESCC samples (right panel). Scale bars: left panels, 400 μm; right panels, 100 μm. (G and H) Overall survival in patients with ESCC with tumors with low-MTA3/high-SOX2 (G) or low-MTA3 and other groups (H). **p < 0.01 by chi-square test.
Figure 6
Figure 6
MTA3 Suppresses Tumor Growth via the SOX2OT-SOX2 Axis in ESCC Cells (A and B) Western blot for MTA3 and SOX2 in EC9706 cells stably expressing MTA3 and SOX2 expression construct (A), or shMTA3 and shSOX2 construct (B). β-Actin is shown as a loading control. (C–E) Growth curves of tumor formation of the EC9706 cells stably expressing MTA3 and SOX2OT (C) or SOX2 (D), or shMTA3 and shSOX2 (E) (upper left panel). Weight (upper right panel) and tumors (lower panel) at the end of the experiments (n = 10 per group). (F–H) EMT and stemness markers in tumors derived from mice models injected with EC9706 cells stably expressing MTA3 and SOX2OT (F) or SOX2 (G), or shMTA3 and shSOX2 (H) detected by IHC. Scale bars: 400 μm in (F–G). (I–K) SP+ and CD44+ cells in tumors derived from mice models injected with EC9706 cells stably expressing MTA3 and SOX2OT (I) or SOX2 (J), or shMTA3 and shSOX2 (K). Histograms showing the proportion of CD44+ cells in the indicated cells (right panels). Data are shown as the means of three independent experiments or representative data. Error bars indicate SEM. *p < 0.05, **p < 0.01, ***p < 0.001 by one-way ANOVA with post hoc intergroup comparisons.

References

    1. Askarian-Amiri M.E., Seyfoddin V., Smart C.E., Wang J., Kim J.E., Hansji H., Baguley B.C., Finlay G.J., Leung E.Y. Emerging role of long non-coding RNA SOX2OT in SOX2 regulation in breast cancer. PLoS One. 2014;9:e102140. - PMC - PubMed
    1. Bass A.J., Watanabe H., Mermel C.H., Yu S., Perner S., Verhaak R.G., Kim S.Y., Wardwell L., Tamayo P., Gat-Viks I. SOX2 is an amplified lineage-survival oncogene in lung and esophageal squamous cell carcinomas. Nat. Genet. 2009;41:1238–1242. - PMC - PubMed
    1. Bhan A., Soleimani M., Mandal S.S. Long noncoding RNA and cancer: a new paradigm. Cancer Res. 2017;77:3965–3981. - PMC - PubMed
    1. Bowen N.J., Fujita N., Kajita M., Wade P.A. Mi-2/NuRD: multiple complexes for many purposes. Biochim. Biophys. Acta. 2004;1677:52–57. - PubMed
    1. Brennan K., Koenig J.L., Gentles A.J., Sunwoo J.B., Gevaert O. Identification of an atypical etiological head and neck squamous carcinoma subtype featuring the CpG island methylator phenotype. EBioMedicine. 2017;17:223–236. - PMC - PubMed

LinkOut - more resources