. 2019 Dec 2;8(12):2102.
doi: 10.3390/jcm8122102.

Short and Long Term Clinical and Immunologic Follow up after Bone Marrow Mesenchymal Stromal Cell Therapy in Progressive Multiple Sclerosis-A Phase I Study

Affiliations

Short and Long Term Clinical and Immunologic Follow up after Bone Marrow Mesenchymal Stromal Cell Therapy in Progressive Multiple Sclerosis-A Phase I Study

Ellen Iacobaeus et al. J Clin Med. .

Abstract

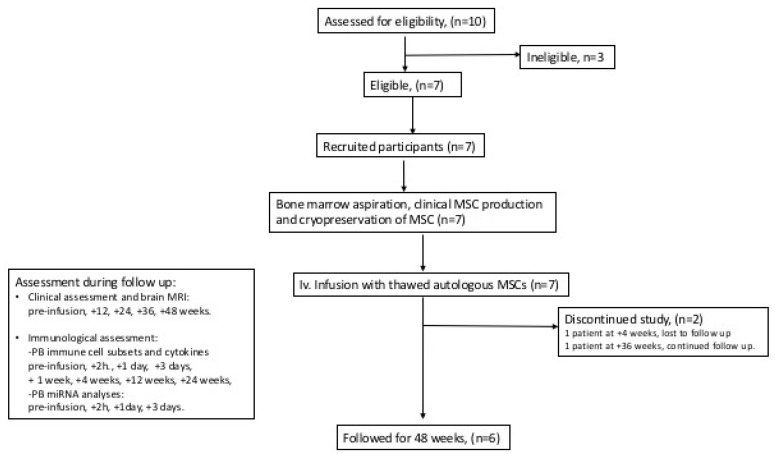
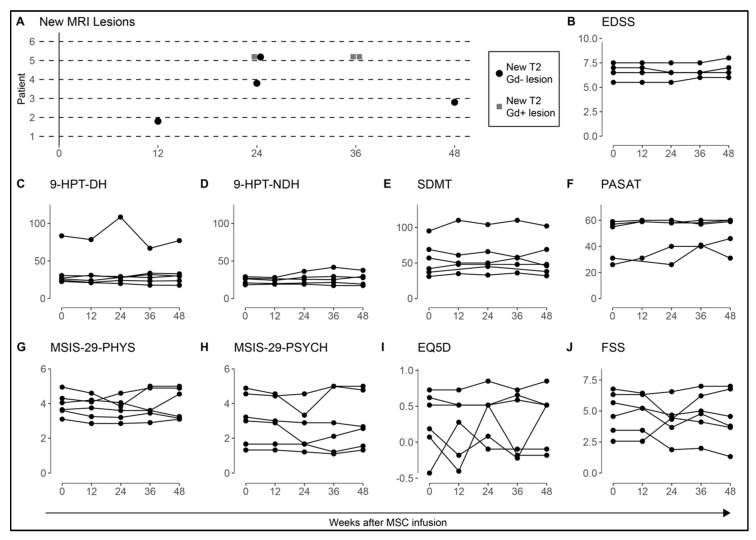
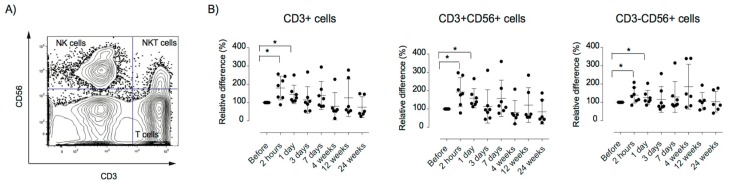
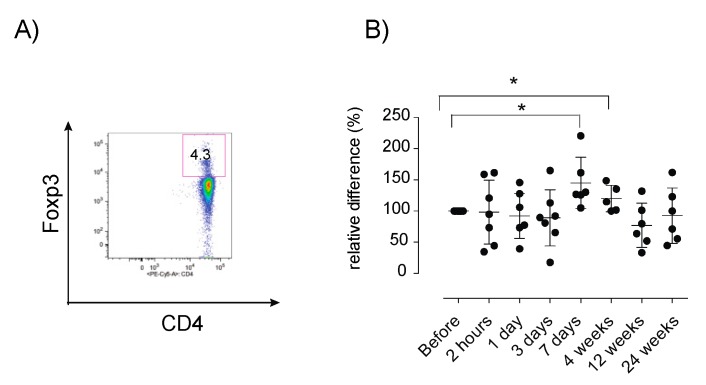
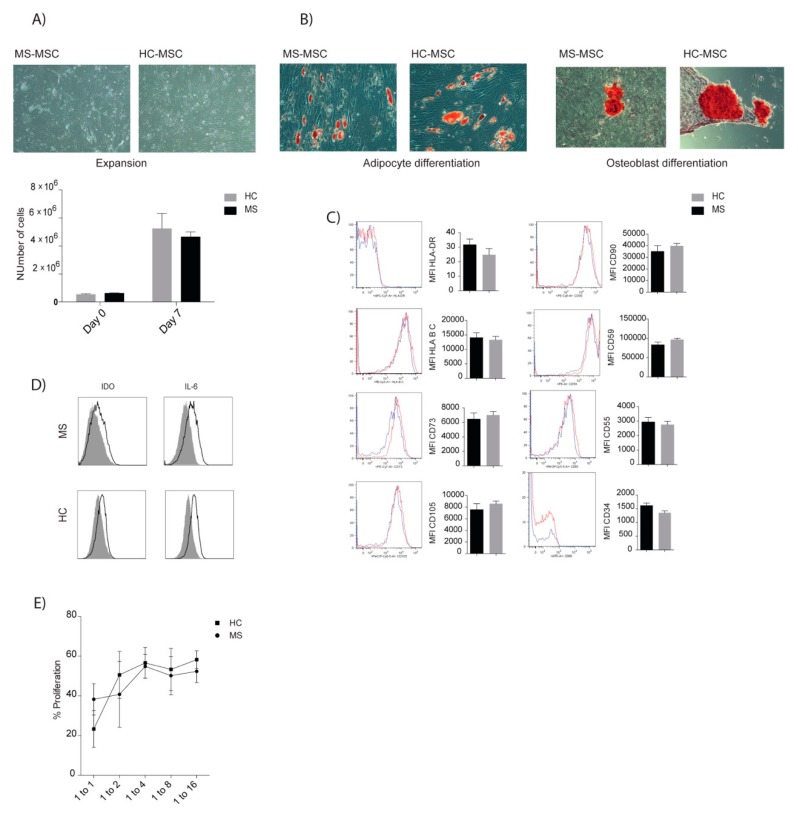
Bone marrow derived mesenchymal stromal cells (BM-MSCs) have emerged as a possible new therapy for Multiple Sclerosis (MS), however studies regarding efficacy and in vivo immune response have been limited and inconclusive. We conducted a phase I clinical study assessing safety and clinical and peripheral immune responses after MSC therapy in MS. Seven patients with progressive MS were intravenously infused with a single dose of autologous MSC (1-2 × 10⁶ MSCs/kg body weight). The infusions were safe and well tolerated when given during clinical remission. Five out of seven patients completed the follow up of 48 weeks post-infusion. Brain magnetic resonance imaging (MRI) showed the absence of new T2 lesions at 12 weeks in 5/6 patients, while 3/5 had accumulated new T2 lesions at 48 weeks. Patient expanded disability status scales (EDSS) were stable in 6/6 at 12 weeks but declined in 3/5 patients at 48 weeks. Early changes of circulating microRNA levels (2 h) and increased proportion of FOXP3+ Tregs were detected at 7 days post-infusion compared to baseline levels. In conclusion, MSC therapy was safe and well tolerated and is associated with possible transient beneficial clinical and peripheral immunotolerogenic effects.

Keywords: autoimmune disease; cell- and tissue-based therapy; chronic progressive; clinical trial; mesenchymal stromal cells; multiple sclerosis.


Conflict of interest statement

The authors declare no conflict of interest.

Figures

Figure 1
Figure 1
Schematic flow chart of the clinical trial.
Figure 2
Figure 2
MRI and clinical outcome measures after mesenchymal stromal cells (MSC) therapy. Clinical measures and MRI were performed at baseline, +12, 24, 36, and 48 weeks post MSC infusion in 6/7 MS patients. (A) Four patients had a total of seven new T2 MRI lesions in the year following MSC treatment (MRI examination was not performed at +24 and +36 weeks for patient 1). (B) The EDSS scores remained without significant change in all patients (n = 6) and repeated measures revealed stable hand function (C,D), cognitive function (E,F), and quality of life (GJ) after MSC infusion. The test scores for each time point were compared to the baseline scores using the Wilcoxon Signed Rank test. One patient (patient 7) did not participate in the follow up and was excluded from the analysis. Hand function and cognitive tests were not performed in patient 1 at +12 w. MRI: magnetic resonance imaging, T2: T2 weighted imaging, Gd: gadolinium enhancement. EDSS: expanded disability status scale, 9-HPT-DH: 9 hole peg test–dominant hand, 9-HPT-NDH: 9 hole peg test–non-dominant hand, SDMT: symbol digit modalities test, PASAT: paced auditory serial addition test, MSIS-PHYS: multiple sclerosis impact scale–physiological impact, MSIS-PSYCH: multiple sclerosis impact scale–psychological impact, EQ5D: European quality of life-5 dimensions, FSS: fatigue severity scale.
Figure 3
Figure 3
Relative surface expression of CXCR3 after MSC infusion. PBMCs were analyzed using flow cytometry for the expression of the chemokine receptor CXCR3. (A) Representative dot plots of the gating strategy. (B) Relative expression of mean fluorescence intensity (MFI) of the CXCR3 receptor at the surface of T cells (CD3+CD56−), NKT cells (CD3+CD56+), and NK cells (CD3−CD56+). Error bars show mean +/− SEM, p-values using the Wilcoxon signed-rank test. The relative distribution of immune cells was calculated as described in the materials and methods sections. PBMC: peripheral blood mononuclear mononuclear cells.
Figure 4
Figure 4
Relative proportions of circulating naïve and memory T cells after MSC therapy. PBMCs were analyzed using flow cytometry for naïve and memory T cells. (A) Representative dot plots of the gating strategy of naïve and memory CD4 and CD8 cells, based on the expression of CD27 and CD45RA. CD4 and CD8 cells were gated on CD3+CD56 cells. (B) Longitudinal analyses of T cell subsets. Six patients were sampled for 24 weeks, one patient was withdrawn from the study at +4 weeks and was only sampled for 7 days, (+1 day; n = 6). Relative distribution of immune cells was calculated as described in the materials and methods sections. Error bars show mean +/− SEM, p-values using the Wilcoxon signed-rank test, * p < 0.05. PBMC: peripheral mononuclear cells, EM: early memory T cells, CM: central memory T cells, TEMRA: late memory T cells.
Figure 5
Figure 5
Relative proportion of peripheral FOXP3+ Tregs after MSC therapy. PBMCs were analyzed using flow cytometry for the assessment of the relative proportion of FOXP3+ Tregs in MS patients. (A) Representative dot plot show gating strategy of FOXP3+ cells within the CD4+ population. (B) Longitudinal analyses of FOXP3+ Tregs. Six patients were sampled for 24 weeks, one patient was withdrawn from the study and was only sampled for 7 days, (+1 day; n = 6). Relative distribution of immune cells was calculated as described in the materials and methods sections. Error bars show mean +/− SEM, p-values using the Wilcoxon signed-rank test, * p < 0.05. PBMC: peripheral blood mononuclear cells, FOXP3 Tregs: Forkhead box P3+ regulatory T cells.
Figure 6
Figure 6
In vitro characterization of BM-MSC of MS patients and healthy donors. (A) Cryopreserved MSC from MS and HC (healthy controls) were thawed and expanded for 7 days (MS; n = 6, HC; n = 5). (B) Representative photographs of MSC adipocyte and osteogenic differentiation. (C) Cell surface expression of MSC molecules, assessed using flow cytometry, with data expressed as median fluorescence intensity (MFI) ± SD. (D). Freshly thawed MSC were stimulated for 72 h with IFN-γ and TNF-α. Intracellular expression of IDO and IL-6 was measured by flow cytometry (black lines). The control grey histogram represents unstained MSC. (E) Proliferative capacities of CD3+ cells in the presence or absence of MSC, at ratios of (MSC: CD3+) 1:0, 1:1, 1:2, 1:4, 1:8, 1:16 were analyzed after five days of co-culture (n = 4/group). Comparisons between MSC donor groups were analyzed using the Mann Whitney test.

References

    1. Compston A., Coles A. Multiple sclerosis. Lancet. 2008;372:1502–1517. doi: 10.1016/S0140-6736(08)61620-7. - DOI - PubMed
    1. Ebers G.C. Natural history of primary progressive multiple sclerosis. Mult. Scler. J. 2004;10(Suppl. 1):S8–S15. doi: 10.1191/1352458504ms1025oa. discussion S13–S15. - DOI - PubMed
    1. Dendrou C.A., Fugger L. Immunomodulation in multiple sclerosis: Promises and pitfalls. Curr. Opin. Immunol. 2017;49:37–43. doi: 10.1016/j.coi.2017.08.013. - DOI - PubMed
    1. Correale J., Gaitan M.I., Ysrraelit M.C., Fiol M.P. Progressive multiple sclerosis: From pathogenic mechanisms to treatment. Brain. 2017;140:527–546. doi: 10.1093/brain/aww258. - DOI - PubMed
    1. Tur C., Montalban X. Progressive MS trials: Lessons learned. Mult. Scler. J. 2017;23:1583–1592. doi: 10.1177/1352458517729460. - DOI - PubMed

LinkOut - more resources