

Bio-Capture of Solid Pollutants by Vegetation Canopy Cave in Shallow Water Flow
- PMID: 31810252
- PMCID: PMC6927006
- DOI: 10.3390/ijerph16234846
Bio-Capture of Solid Pollutants by Vegetation Canopy Cave in Shallow Water Flow
Abstract
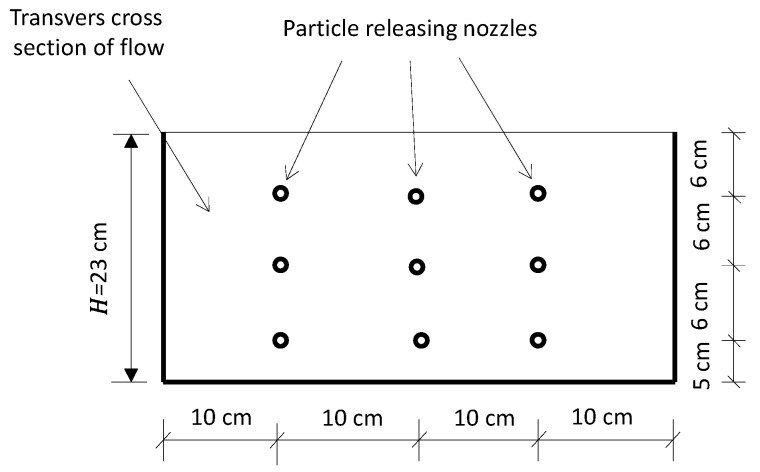
Vegetation has already been acknowledged to have the ability to remove fine solid pollutants by retention and absorption, and is widely used in the biorestoration engineering of natural shallow water flow. Vegetation usually takes a long time to obtain the expected removal rate. Therefore, vegetation is not applicable for some urgent or pressing situations. In addition, in traditional biorestoration engineering, solid pollutants usually deposit in the soil of flow bed, which infiltrates into the far-field and accumulates in crops to threaten human health. Herein, we propose a new biotechnique of foliage capture by designing a cave on the top of a vegetation canopy, which is aimed to enhance the removal efficiency (i.e., achieve quick removal) and avoid the soil deposition of pollutants. The effectiveness and efficiency of this new design were validated by a set of indoor water flume experiments, with one flat canopy top configuration serving as the model of a traditional bioretention system and three cave configurations of differing aspect ratios. The results showed that compared with that of the flat canopy top, the total amount of foliage-captured solid particles for the three caved canopies increased by 3.8, 7.3, and 12.2 times. Further, we found that the foliage-capture efficiency depended on the aspect ratio of the canopy cave. The results revealed that the effectiveness of foliage capture and the enhanced efficiency were mainly from three hydrodynamic mechanisms: (i) as flow penetrated the cave boundary from the above-canopy region to the within-canopy region, it entrained solid pollutants to collide with the foliage and increased their fate of capture; (ii) the large eddy vortices of turbulence broke due to the increasing canopy resistance, which resulted in enhanced mixing dynamics for fine, suspended, solid pollutants to collide into foliage; and (iii) the flow shear along the cave boundary decreased, which provided a reduced lift force for solid pollutants to suspend or resuspend. Comparisons between the flat canopy and caved canopies of three aspect ratios showed that the design of the canopy cave is highly significant for capture efficiency.
Keywords: biotechnique; foliage capture; shallow water flow; solid pollutants.
Conflict of interest statement
The authors declare no conflict of interest.
Figures


References
-
- Zhao Z., Liu G., Liu Q., Huang C., Li H. Studies on Spatiotemporal Variability of River Water Quality and Its Relationships with Soil and Precipitation: A Case Study of the Mun River Basin in Thailand. Int. J. Environ. Res. Public Health. 2018;15:2466. doi: 10.3390/ijerph15112466. - DOI - PMC - PubMed
-
- Li X., Shen H., Zhao Y., Cao W., Hu C., Sun C. Distribution and Potential Ecological Risk of Heavy Metals in Water, Sediments, and Aquatic Macrophytes: A Case Study of the Junction of Four Rivers in Linyi City, China. Int. J. Environ. Res. Public Health. 2019;16:2861. doi: 10.3390/ijerph16162861. - DOI - PMC - PubMed
-
- Shen X., Sun T., Su M. Short-term Response of Aquatic Ecosystem Metabolism to Turbidity Disturbance in Experimental Estuarine Wetlands. Ecol. Eng. 2019;136:55–61. doi: 10.1016/j.ecoleng.2019.06.005. - DOI
-
- Tunçsiper B. Combined Natural Wastewater Treatment Systems for Removal of Organic Matter and Phosphorus from Polluted Streams. J. Clean. Prod. 2019;228:1368–1376. doi: 10.1016/j.jclepro.2019.04.211. - DOI
Publication types
MeSH terms
Substances
LinkOut - more resources
Full Text Sources