. 2019 Dec 2;11(12):1922.
doi: 10.3390/cancers11121922.

Immune Cell Infiltration in the Microenvironment of Liver Oligometastasis from Colorectal Cancer: Intratumoural CD8/CD3 Ratio Is a Valuable Prognostic Index for Patients Undergoing Liver Metastasectomy

Affiliations

Immune Cell Infiltration in the Microenvironment of Liver Oligometastasis from Colorectal Cancer: Intratumoural CD8/CD3 Ratio Is a Valuable Prognostic Index for Patients Undergoing Liver Metastasectomy

Jianhong Peng et al. Cancers (Basel). .

Abstract

: Background: A comprehensive investigation into immune cell infiltration provides more accurate and reliable prognostic information for patients with colorectal liver oligometastases (CLO) after liver metastasectomy.

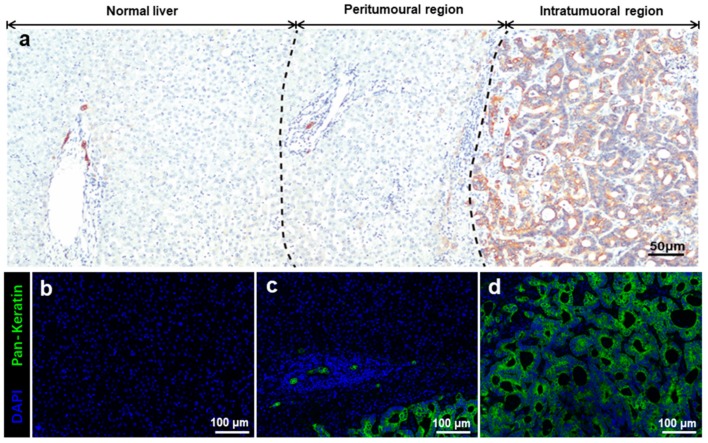
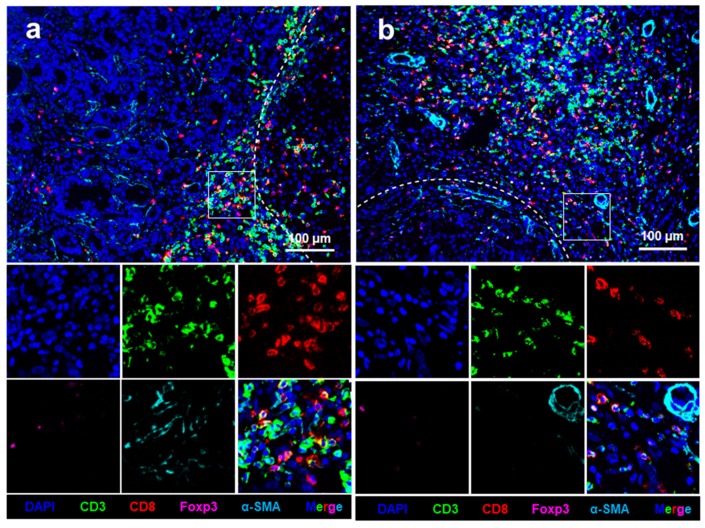
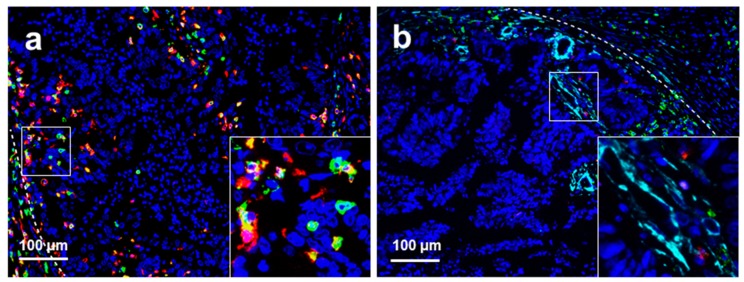
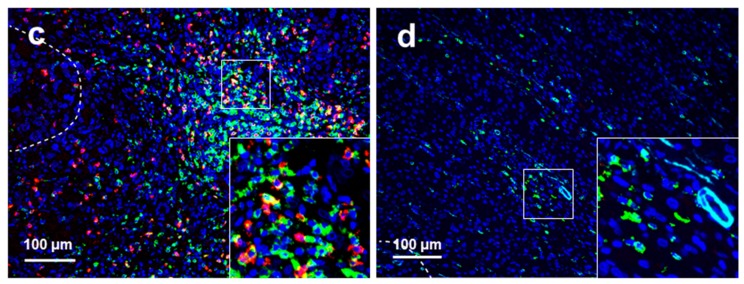
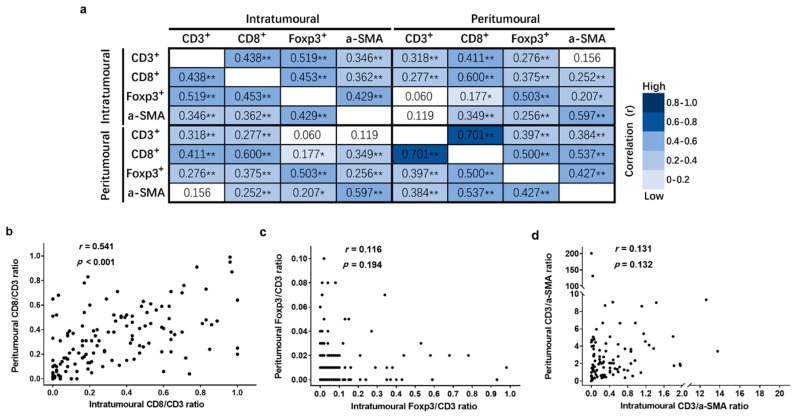
Methods: Simultaneous detection of the immune constituents CD3+, CD8+, Foxp3+ T, and α-SMA+ cells in the liver oligometastasis of 133 patients was conducted using a four-colour immunohistochemical multiplex technique. Immune cells were quantified, and tumour-infiltrating lymphocyte (TIL) ratios were subsequently calculated. Correlation analysis was performed using Pearson's correlation. Recurrence-free survival (RFS) and overall survival (OS) for TIL ratios were analysed using the Kaplan-Meier method and Cox regression models.

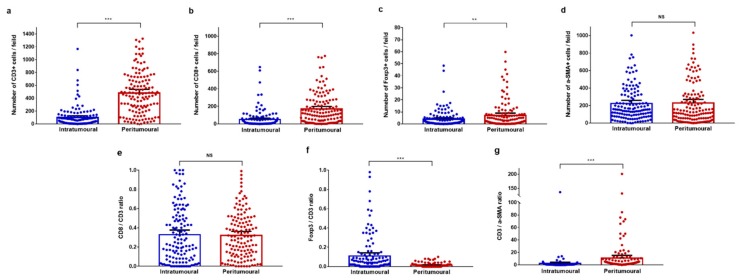
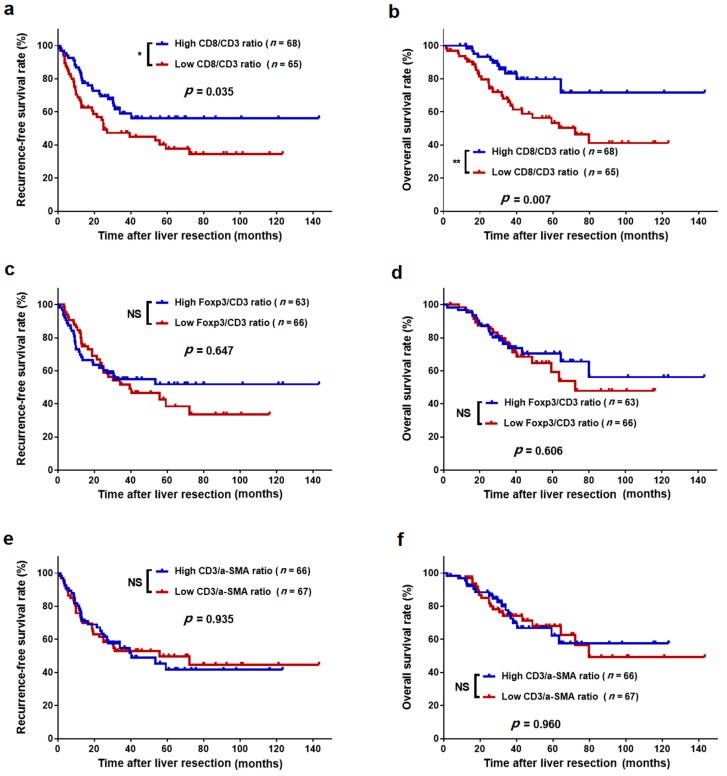
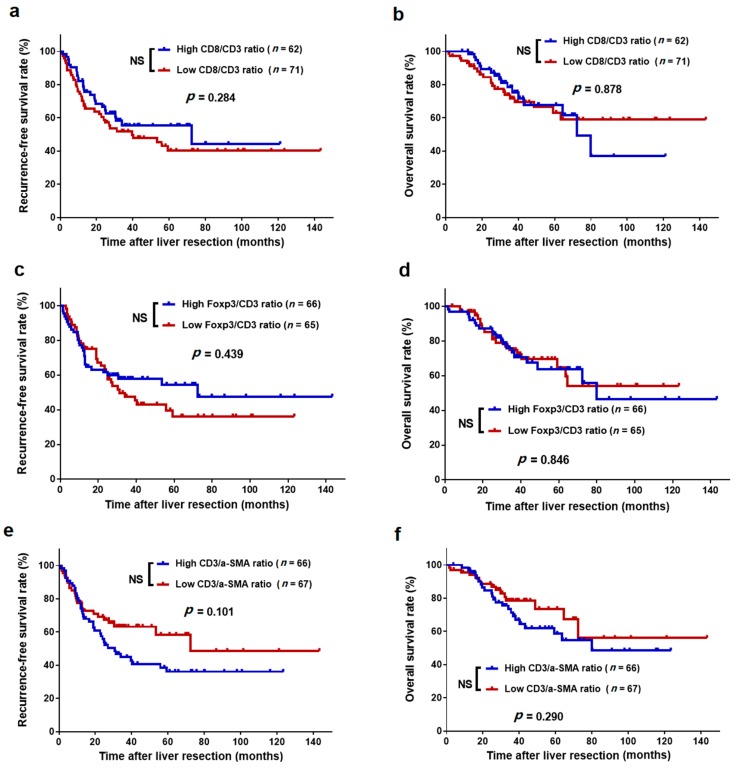
Results: Significantly fewer CD3+, CD8+, and Foxp3+ T cells were observed in the intratumoural region than in the peritumoural region of liver metastases. CD3+, CD8+, Foxp3+ T, and α-SMA+ cells showed significantly positive correlations with each other both in the intratumoural and peritumoural regions of liver metastases. Only the CD8/CD3 TIL ratio demonstrated a positive correlation between intratumoural and peritumoural regions of liver metastases (r = 0.541, p < 0.001). Patients with high intratumoural CD8/CD3 ratios had significantly longer 3-year RFS (59.0% vs. 47.4%, p = 0.035) and 3-year OS rates (83.3% vs. 65.8%, p = 0.007) than those with low intratumoural CD8/CD3 ratios. Multivariate analyses revealed that the intratumoural CD8/CD3 ratio was independently associated with RFS (HR = 0.593; 95% CI = 0.357-0.985; p = 0.043) and OS (HR = 0.391; 95% CI = 0.193-0.794; p = 0.009).

Conclusion: These findings offer a better understanding of the prognostic value of immune cell infiltration on liver oligometastasis from colorectal cancer.

Keywords: CD8/CD3 ratio; colorectal cancer; immune cell; liver oligometastasis; microenvironment.


Conflict of interest statement

The authors declare that they have no conflicts of interest.

Figures

Figure 1
Figure 1
Identification of specific regions of liver oligometastases from colorectal cancer. (a) Overview of the immunohistochemical images of different regions of liver oligometastasis. Pan-keratin was highly expressed in the cytoplasm of tumour but not in normal hepatocytes; (b) immunofluorescence staining image of normal liver tissue; (c) immunofluorescence staining image of the peritumoural region; and (d) immunofluorescence staining image of the intratumoural region. Pan-keratin is green (cytoplasm, fluorophore 520), and DAPI is blue. The scale bars of image (a) equal 50 μm and images (bd) equal 100 μm.
Figure 2
Figure 2
Four-colour immunohistochemical multiplex analysis of liver oligometastasis from colorectal cancer. (a) Representative multiplex image of the intratumoural regions of liver metastases; and (b) representative multiplex images of the peritumoural regions of liver metastases. Nuclei (DAPI, blue), CD3 (membrane, fluorophore 520, green), CD8 (membrane, fluorophore 690, red), Foxp3 (membrane, fluorophore 620, pink), and α-SMA (cytoplasmic, fluorophore 570, indigo). The white dotted lines represent the borders of liver metastasis and normal liver tissue. All scale bars equal 100 μm.
Figure 3
Figure 3
Infiltration of T cell subpopulations and α-SMA-positive cells between intratumoural and peritumoural regions of colorectal liver metastases. (af) Pairwise comparisons of the number of immune cells between intratumoural and peritumoural regions. (a) CD3+ T cells; (b) CD8+ T cells; (c) Foxp3+ T cells; and (d) α-SMA+ cells. (eg) Pairwise comparisons of the tumour-infiltrating lymphocyte ratio between intratumoural and peritumoural regions. (e) The CD8/CD3 ratio; (f) the Foxp3/CD3 ratio; and (g) the CD3/α-SMA ratio. Significance determined by unpaired t-tests. Data are presented as the means with 95% confidence intervals (CIs). ** p < 0.01, *** p < 0.001; NS, not significant.
Figure 4
Figure 4
Representative immunohistochemical multiplex images of different CD3/CD8 ratios of T cells in liver metastasis of colorectal cancer. (a) High CD8/CD3 ratio in the intratumoural regions of liver metastases; (b) low CD8/CD3 ratio in the intratumoural regions of liver metastases; (c) high CD8/CD3 ratio in the peritumoural regions of liver metastases; and (d) low CD8/CD3 ratio in the peritumoural regions of liver metastases. Nuclei (DAPI, blue), CD3 (membrane, fluorophore 520, green), and CD8 (membrane, fluorophore 690, red). The white dotted lines represent the borders of liver metastases and normal liver tissue. All scale bars equal 100 μm.
Figure 4
Figure 4
Representative immunohistochemical multiplex images of different CD3/CD8 ratios of T cells in liver metastasis of colorectal cancer. (a) High CD8/CD3 ratio in the intratumoural regions of liver metastases; (b) low CD8/CD3 ratio in the intratumoural regions of liver metastases; (c) high CD8/CD3 ratio in the peritumoural regions of liver metastases; and (d) low CD8/CD3 ratio in the peritumoural regions of liver metastases. Nuclei (DAPI, blue), CD3 (membrane, fluorophore 520, green), and CD8 (membrane, fluorophore 690, red). The white dotted lines represent the borders of liver metastases and normal liver tissue. All scale bars equal 100 μm.
Figure 5
Figure 5
The inter-correlation between different immune cell subtypes in intratumoural and peritumoural regions of liver metastases. (a) The inter-correlation between each cell subtype number in intratumoural and peritumoural regions of liver metastases; (b) the inter-correlation of the CD8/CD3 ratio in the intratumoural and peritumoural regions of liver metastases; (c) the inter-correlation of the Foxp3/CD3 ratio in the intratumoural and peritumoural regions of liver metastases; and (d) the inter-correlation of the CD3/α-SMA ratio in the intratumoural and peritumoural regions of liver metastases. Pearson correlation coefficient (r) and significance levels (p value) are presented for each correlation. Data are presented as * p < 0.05, ** p < 0.01.
Figure 6
Figure 6
Kaplan–Meier survival curves of colorectal liver oligometastases (CLO) patients after liver metastasectomy stratified by the different levels of tumour-infiltrating lymphocyte ratios in intratumoural regions of liver metastases. (a) Recurrence-free survival (RFS) for CD8/CD3 ratio; (b) overall survival (OS) for CD8/CD3 ratio; (c) RFS for Foxp3/CD3 ratio; (d) OS for Foxp3/CD3 ratio; (e) RFS for CD3/α-SMA ratio; and (f) OS for CD3/α-SMA ratio. * p < 0.05, ** p < 0.01; NS, not significant.
Figure 7
Figure 7
Kaplan–Meier survival curves of CLO patients after liver metastasectomy stratified by the different levels of tumour-infiltrating lymphocyte ratios in the peritumoural regions of liver metastases. (a) RFS for CD8/CD3 ratio; (b) OS for CD8/CD3 ratio; (c) RFS for Foxp3/CD3 ratio; (d) OS for Foxp3/CD3 ratio; (e) RFS for CD3/α-SMA ratio; and (f) OS for CD3/α-SMA ratio. NS, not significant.

References

    1. Siegel R.L., Miller K.D., Fedewa S.A., Ahnen D.J., Meester R.G.S., Barzi A., Jemal A. Colorectal cancer statistics. CA Cancer J. Clin. 2017;67:177–193. doi: 10.3322/caac.21395. - DOI - PubMed
    1. O’Reilly D.A., Poston G.J. Colorectal liver metastases: Current and future perspectives. Future Oncol. 2006;2:525–531. doi: 10.2217/14796694.2.4.525. - DOI - PubMed
    1. Van Cutsem E., Cervantes A., Adam R., Sobrero A., Van Krieken J.H., Aderka D., Aranda Aguilar E., Bardelli A., Benson A., Bodoky G., et al. ESMO consensus guidelines for the management of patients with metastatic colorectal cancer. Ann. Oncol. 2016;27:1386–1422. doi: 10.1093/annonc/mdw235. - DOI - PubMed
    1. Reyes D.K., Pienta K.J. The biology and treatment of oligometastatic cancer. Oncotarget. 2015;6:8491–8524. doi: 10.18632/oncotarget.3455. - DOI - PMC - PubMed
    1. Lin J., Peng J., Zhao Y., Luo B., Zhao Y., Deng Y., Sui Q., Gao Y., Zeng Z., Lu Z., et al. Early recurrence in patients undergoing curative resection of colorectal liver oligometastases: Identification of its clinical characteristics, risk factors, and prognosis. J. Cancer Res. Clin. Oncol. 2018;144:359–369. doi: 10.1007/s00432-017-2538-8. - DOI - PMC - PubMed