. 2020 Feb 5;105(3):549-561.e5.
doi: 10.1016/j.neuron.2019.10.033. Epub 2019 Dec 3.

Vasomotion as a Driving Force for Paravascular Clearance in the Awake Mouse Brain

Affiliations

Vasomotion as a Driving Force for Paravascular Clearance in the Awake Mouse Brain

Susanne J van Veluw et al. Neuron. .

Abstract

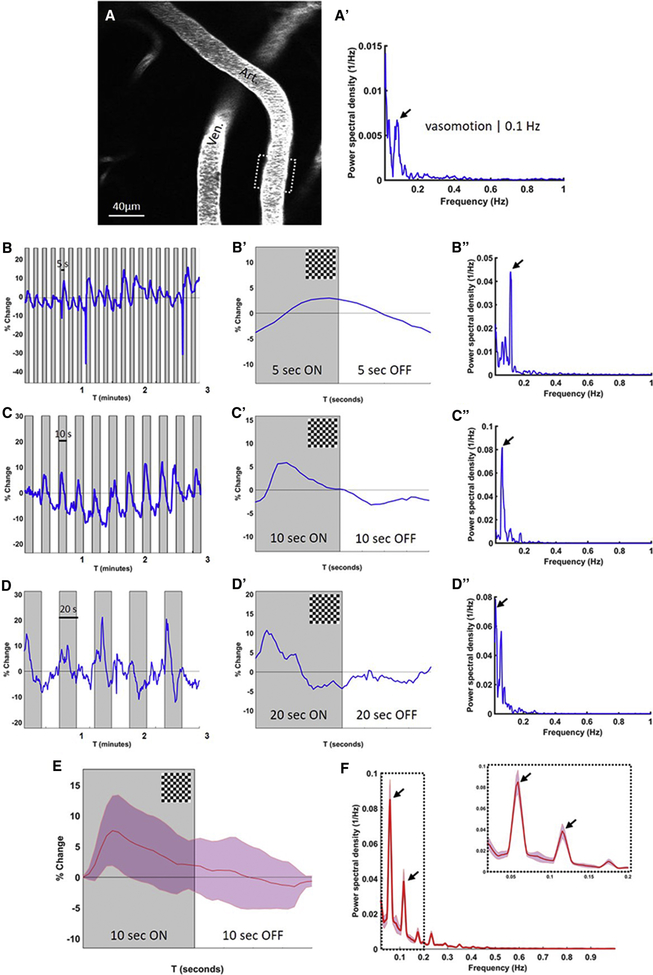
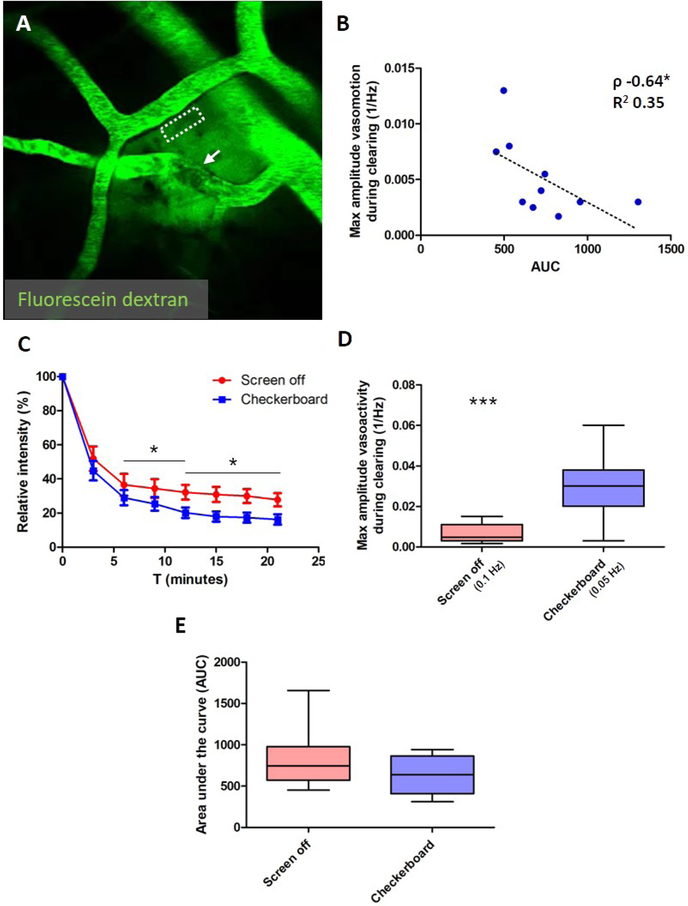
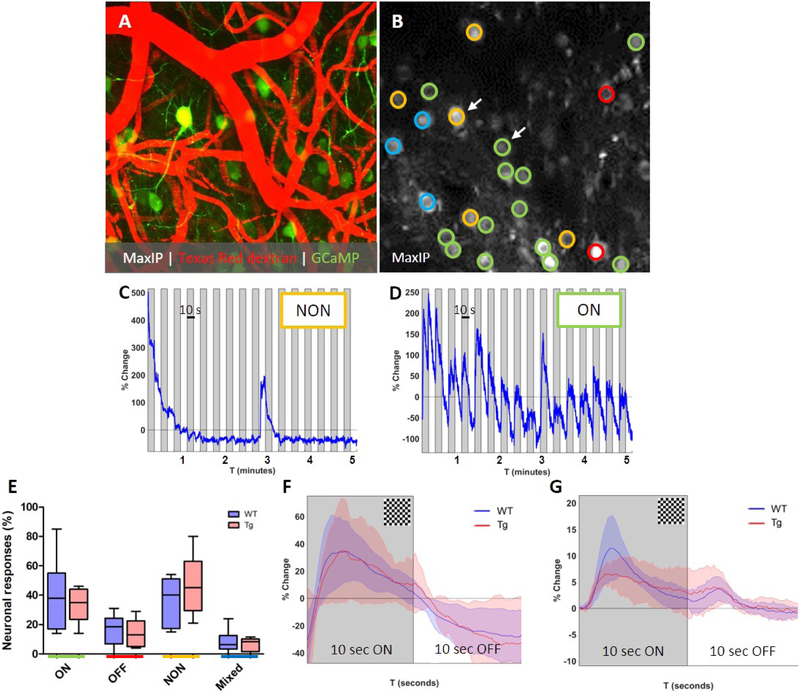
Paravascular drainage of solutes, including β-amyloid (Aβ), appears to be an important process in brain health and diseases such as Alzheimer's disease (AD) and cerebral amyloid angiopathy (CAA). However, the major driving force for clearance remains largely unknown. Here we used in vivo two-photon microscopy in awake head-fixed mice to assess the role of spontaneous vasomotion in paravascular clearance. Vasomotion correlated with paravascular clearance of fluorescent dextran from the interstitial fluid. Increasing the amplitude of vasomotion by means of visually evoked vascular responses resulted in increased clearance rates in the visual cortex of awake mice. Evoked vascular reactivity was impaired in mice with CAA, which corresponded to slower clearance rates. Our findings suggest that low-frequency arteriolar oscillations drive drainage of solutes. Targeting naturally occurring vasomotion in patients with CAA or AD may be a promising early therapeutic option for prevention of Aβ accumulation in the brain.

Keywords: Alzheimer’s disease; cerebral amyloid angiopathy; functional hyperemia; glymphatics; intra-mural peri-arterial drainage; perivascular space; vascular smooth muscle cells; vasomotion.


Conflict of interest statement

Declaration of Interests The authors declare no competing interests.

Figures

Figure 1.
Figure 1.. Spontaneous vasomotion (around 0.1 Hz) can be observed in arterioles in the awake mouse brain.
Representative in vivo two-photon microscopy image of a fluorescent angiogram through a cranial window in an awake head-fixed wild-type mouse (A). Resting-state spontaneous activity is recorded in arterioles over a 5-minute time course at 2x magnification and a frame rate of ~2 Hz (B). Spontaneous dilations and constrictions in the arteriolar segment outlined in panel B are visualized as percentage vessel diameter change over the recorded 5-minute time course (C). Note: the two highest observed peaks correspond to movement-induced arteriolar dilations. Fourier transform analysis of the time-course in panel C reveals arteriolar oscillations in the ultra-low frequency range, with a distinct peak at 0.1 Hz, also known as vasomotion (C’). Note: in some cases an additional peak could be observed at even lower frequencies, potentially related to movement-induced arteriolar dilations. Spontaneous vasomotion is not observed in venules (DD’). The averaged Fourier plot across wild-type mice (n=14 arterioles in 8 mice (for each arteriole ~3 ROIs were averaged)) revealed a broad range of ultra-low frequencies (<0.4 Hz) with a distinct peak centered at around 0.1 Hz, but no peaks in the range 0.4–1 Hz (E). Shaded areas in E represent standard error of the mean.
Figure 2.
Figure 2.. Evoked vascular reactivity can be driven at different frequencies of visual stimulation.
Spontaneous vasomotion is observed in an arteriole in an awake head-fixed wild-type mouse (AA’). Visual stimulation in the form of a flashing checkerboard results in evoked vascular reactivity (functional hyperemia), following distinct patterns of presentation. Presenting the flashing checkerboard pattern for 5 seconds (ON) followed by 5 seconds grey screen (OFF) repeatedly results in vasodilations once every 10 seconds (B), a distinct averaged hemodynamic response function (B’) and a peak in the Fourier distribution at 0.1 Hz (B”). Presenting the checkerboard for 10 seconds (ON) followed by 10 seconds grey screen (OFF) results in a peak at 0.05 Hz (CC’C”), and 20 seconds (ON) followed by 20 seconds (OFF) results in a peak at 0.025 Hz (DD’D”). Note: only the first three minutes of the total 5-minute recordings are shown in panel B, C, and D for optimal presentation of the individual traces. The averaged hemodynamic response function across wild-type mice (n=17 arterioles in 9 mice (for each arteriole ~3 ROIs were averaged)) reveals that the 10 seconds checkerboard ON/OFF presentation reproducibly evokes on average a vessel diameter change of ~7% (E). The corresponding averaged Fourier plot shows a prominent peak at 0.05 Hz (the stimulation frequency) as well as a smaller peak at 0.1 Hz (the vasomotion frequency) (F). Shaded areas in E represent standard deviations. Shaded areas in F represent standard error of the mean.
Figure 3.
Figure 3.. Paravascular clearance rate is associated with vasomotion in wild-type mice.
Clearance of extravasated fluorescent dextran can be measured non-invasively in awake head-fixed mice alongside arteries (dashed ROI) with two-photon microscopy after laser irradiation of neighboring vessels (A; arrow indicates clotting reaction that immediately occurs after the local vessel irradiation). The maximum amplitude of the spontaneous vasomotion (expressed as the power of the peak at 0.1 Hz) per vessel during clearing correlates with the area under the fluorescein dextran decay curve (AUC) (B; Spearman’s ρ −0.64, p=0.049, n=10 vessels in 8 wild-type mice). Note: two measurements were excluded from this analysis due to extensive leakage after laser irradiation. Visual stimulation during the period of extravasated fluorescein dextran clearance resulted in faster clearance rates (C), and can be explained by the significant increase in vasoactivity as quantified by the maximum amplitude of the evoked vascular reactivity (expressed as the power of the peak at 0.05 Hz) per vessel compared to the maximum amplitude of the spontaneous vasomotion (expressed as the power of the peak at 0.1 Hz) when the screen was off (D; 0.027 ± 0.016 1/Hz with visual stimulation (n=11 vessels) vs. 0.0065 ± 0.0046 1/Hz without (n=12 vessels), t-test, p=0.0003). Faster clearances during visual stimulation was quantified as significantly lower relative dextran intensities at t=12 minutes (C; 20.1 ± 10.3 % with visual stimulation (n=11 vessels in 7 mice) vs. 32.2 ± 15.6 % without visual stimulation (n=13 vessels in 9 mice), t-test, p=0.038) and t=18 minutes (C; 17.5 ± 9.7 % with visual stimulation vs. 30.0 ± 14.9 % without visual stimulation, t-test, p=0.026) and AUC (F; 638 ± 226 with visual stimulation vs. 839 ± 341 without, t-test, p=0.11). Error bars in C represent standard error of the mean. Median and range are indicated in D and E. * p<0.05, *** p<0.001.
Figure 4.
Figure 4.. Spontaneous vasomotion (at 0.1 Hz) and baseline paravascular clearance are not altered in 8–10 months old APP/PS1 mice.
Representative in vivo two-photon microscopy image of a fluorescent angiogram through a cranial window in an awake head-fixed transgenic (Tg) APP/PS1 mouse (A). Intraparenchymal Aβ plaques and vascular Aβ depositions (CAA) are visualized through Methoxy-X04, an intraperitoneally injected fluorescent Congo Red derivative that crosses the blood-brain barrier and binds to Aβ. Note: fluorescein dextran is depicted in red for better contrast with Aβ in cyan. Spontaneous vasomotion in Tg mice is recorded in arterioles over a 5-minute time course at 2x magnification and a frame rate of ~2 Hz (B), and is comparable to wild-type (WT) animals (D; maximum amplitude at 0.1 Hz was 0.0094 ± 0.0083 1/Hz in Tg (n=13 vessels in 4 mice) vs. 0.014 ± 0.010 1/Hz in WT mice (n=14 vessels in 8 mice), t-test, p=0.29). The combined Fourier plot shows the averaged frequency distributions (after averaging several ROIs per vessel) in the range 0.02 – 0.5 Hz for WT and Tg mice (C). Note: three vessel measurements from Tg mice were excluded from the averaged plot because no peaks were observed <0.5 Hz. Paravascular clearance decay curves are comparable between WT (n=12 vessels in 8 mice) and Tg mice (n=11 vessels in 4 mice) (E), quantified as area under the curve (F; 839 ± 341 in WT vs. 908 ± 510 in Tg, t-test, p=0.70). Shaded areas in C and error bars in E represent standard error of the mean. Median and range are indicated in D and F.
Figure 5.
Figure 5.. Evoked vascular reactivity and paravascular clearance rates are reduced during visual stimulation in 8–10 months old APP/PS1 mice.
Evoked vascular reactivity upon visual stimulation is impaired in transgenic (Tg) mice compared to wild-type (WT) mice, as visualized by the averaged hemodynamic response functions (A; shaded areas represent standard deviations), and the quantification of the maximum amplitude of the power at 0.05 Hz after Fourier transform (B; 0.043 ± 0.034 1/Hz (n=22 vessels in 5 mice) in Tg vs. 0.13 ± 0.069 1/Hz (n=18 vessels in 9 mice) in WT mice, t-test, p<0.0001). Visual stimulation during the period of extravasated fluorescein dextran clearance resulted in slower clearance rates in Tg compared to WT mice (C), and can be explained by the significant difference in evoked vascular reactivity as quantified by the maximum amplitude (expressed as the power of the peak at 0.05 Hz) per vessel (D; 0.015 ± 0.012 1/Hz (n=13 vessels in 5 mice) in Tg vs. 0.027 ± 0.016 1/Hz (n=11 vessels in 7 mice) in WT mice, t-test, p=0.033). Quantification of the fluorescein dextran decay curves revealed significantly slower clearance rates during visual stimulation in Tg compared to WT mice, as expressed by area under the curve (AUC) (E; 1017 ± 433 in Tg vs. 638 ± 226 in WT, t-test, p=0.016). The maximum amplitude of the evoked vascular reactivity during clearance significantly correlated with AUC (F; Spearman’s ρ −0.59, p=0.0041). Note: two outliers were removed from the correlation to enable reliable curve fitting, but even without removing them the correlation remained significant (p=0.028). Error bars in C represent standard error of the mean. Median and range are indicated in B, D, and E. * p<0.05, ** p<0.01, *** p<0.001.
Figure 6.
Figure 6.. Reduced vascular reactivity in APP/PS1 mice is not driven by altered neuronal responses.
Representative in vivo two-photon microscopy image of a fluorescent angiogram with GCaMP6S expressing neurons through a cranial window in an awake head-fixed wild-type (WT) mouse (A). Evoked neuronal reactivity in WT and Tg mice is recorded over a 5-minute time course at 2x magnification and a frame rate of ~5 Hz (B). Neurons were classified as ON (green), OFF (red), NON (yellow), or Mixed (blue) responders based on their individual and averaged traces (B). Representative trace of an individual NON responder (C; arrow in B) and an individual ON responder (D; arrow in B). No significant differences were observed in average percentage of ON responders (p=0.67), OFF responders (p=0.65), NON responders (p=0.38), or Mixed responders (p=0.64) between WT (total number of 200 neurons in 6 mice) and Tg mice (total number of 178 neurons in 5 mice) (t-tests) (E). Also, no difference was observed between the averaged shape of the percentage signal change in ON responders, between WT (72 ON responders) and Tg mice (55 ON responders) (F). Yet, evoked vascular reactivity was significantly impaired in the same Tg mice compared to WT (G; vascular recordings in these mice were done at the same resolution and frame-rate as neuronal recordings). Shaded areas in panels F and G represent standard deviations. Median and range are indicated in E.
Figure 7.
Figure 7.. Reduced vascular reactivity in APP/PS1 mice is not associated with local CAA burden, but with loss of vascular smooth muscle cells.
Representative in vivo two-photon microscopy image of a fluorescent angiogram through a cranial window in an awake head-fixed transgenic (Tg) APP/PS1 mouse (A). Intraparenchymal Aβ plaques and vascular Aβ depositions (CAA) are visualized through Methoxy-X04, an intraperitoneally injected fluorescent Congo Red derivative that crosses the blood-brain barrier and binds to Aβ (B). CAA burden was quantified on the maximum intensity projections of the Methoxy-X04 channel and correlated with the amplitude of the evoked vascular reactivity, quantified as the maximum peak at 0.05 Hz in 8–10 months old transgenic mice. No significant correlation was found between CAA burden and evoked vascular reactivity per vessel segment (C; Spearman’s ρ −0.098, p=0.58, n=35 vessel segments in 5 mice). Smooth muscle cell (SMC) density was quantified with ex vivo immunohistochemistry in brain sections of 18 months old wild-type (WT) and Tg mice that underwent in vivo two-photon microscopy. Representative images of pial surface arterioles in WT (D) and Tg (E) mice are shown, which suggest loss of SMCs in CAA-positive vessels. After excluding three vessels that did not exhibit any CAA from the Tg group, SMC density was found to be significantly reduced in Tg (4.9 ± 2.0 %, n=25 vessels in 6 mice) compared to WT mice (7.1 ± 4.1 %, n=34 vessels in 8 mice, t-test, p=0.016) (F). Median and range are indicated in F. * p<0.05.

Comment in

References

    1. Absinta M, Ha SK, Nair G, Sati P, Luciano NJ, Palisoc M, Louveau A, Zaghloul KA, Pittaluga S, Kipnis J, et al. (2017). Human and nonhuman primate meninges harbor lymphatic vessels that can be visualized noninvasively by MRI. Elife 6, e29738. - PMC - PubMed
    1. Albargothy NJ, Johnston DA, MacGregor-Sharp M, Weller RO, Verma A, Hawkes CA, and Carare RO (2018). Convective influx/glymphatic system: tracers injected into the CSF enter and leave the brain along separate periarterial basement membrane pathways. Acta. Neuropathol 136, 139–152. - PMC - PubMed
    1. Aldea R, Weller RO, Wilcock DM, Carare RO, and Richardson G (2019). Cerebrovascular smooth muscle cells as the drivers of periarterial lymphatic drainage of the brain. Front. Aging. Neurosci 11, 1. - PMC - PubMed
    1. Arbel-Ornath M, Hudry E, Eikermann-Haerter K, Hou S, Gregory JL, Zhao L, Betensky RA, Frosch MP, Greenberg SM, and Bacskai BJ (2013). Interstitial fluid drainage is impaired in ischemic stroke and Alzheimer’s disease mouse models. Acta. Neuropathol 126, 353–364. - PMC - PubMed
    1. Asgari M, de Zélicourt D, and Kurtcuoglu V (2016). Glymphatic solute transport does not require bulk flow. Sci. Rep 8, 38635. - PMC - PubMed

Publication types

Substances