Comment
. 2019 Dec 17;51(6):1028-1042.e4.
doi: 10.1016/j.immuni.2019.10.009. Epub 2019 Dec 3.

CD4+ T Cell Help Is Required for the Formation of a Cytolytic CD8+ T Cell Subset that Protects against Chronic Infection and Cancer

Affiliations
Comment

CD4+ T Cell Help Is Required for the Formation of a Cytolytic CD8+ T Cell Subset that Protects against Chronic Infection and Cancer

Ryan Zander et al. Immunity. .

Abstract

Although CD4+ T cell "help" is crucial to sustain antiviral immunity, the mechanisms by which CD4+ T cells regulate CD8+ T cell differentiation during chronic infection remain elusive. Here, using single-cell RNA sequencing, we show that CD8+ T cells responding to chronic infection were more heterogeneous than previously appreciated. Importantly, our findings uncovered the formation of a CX3CR1-expressing CD8+ T cell subset that exhibited potent cytolytic function and was required for viral control. Notably, our data further demonstrate that formation of this cytotoxic subset was critically dependent on CD4+ T cell help via interleukin-21 (IL-21) and that exploitation of this developmental pathway could be used therapeutically to enhance the killer function of CD8+ T cells infiltrated into the tumor. These findings uncover additional molecular mechanisms of how "CD4+ T cell help" regulates CD8+ T cell differentiation during persistent infection and have implications toward optimizing the generation of protective CD8+ T cells in immunotherapy.

Keywords: CD4(+) T cell help; CD8(+) T cell heterogeneity; LCMV Cl13.


Conflict of interest statement

Declaration of Interests

The authors declare no competing interests.

Figures

Figure 1.
Figure 1.. scRNA-seq reveals transcriptional heterogeneity amongst CD8 T cells responding to persistent viral infection.
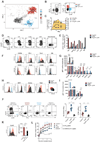
(A) t-SNE plot displaying clusters identified in a mixture of GP33+ CD8 T cells from day 8 and day 30 p.i. with LCMV Cl13. (B) t-SNE plots showing CD8 clusters from day 8 or day 30 time points. (C) Summary dot plot depicting relative frequency of day 8 and day 30 virus-specific CD8 T cell populations. (D). Heatmap showing Z scores for the average expression of given genes within a particular cluster. See also Figures S1 and S2.
Figure 2.
Figure 2.. Expression of Ly108 and CX3CR1 define three subsets of CD8+ T cells during chronic viral infection.
(A) tSNE plot highlighting the three main subsets of CD8+ T cells present after establishment of chronic viral infection. (B) Representative flow plots depicting Ly108+, CX3CR1Ly108 and CX3CR1+ GP33+ splenic CD8 subsets on day 14 p.i. (C) Kinetics (mean +/− SEM) of subsets in the spleen. Viremia (mean +/− SEM) kinetics overlayed in shaded yellow. (D) Representative flow plots depicting GP33+ CD8+ T cell subsets in indicated tissues on day 14 p.i. (E) Frequency of CD8+T cell subsets in different anatomical locations. (F-G) Representative flow plots (F) and summary data (G) showing relative expression of surface molecules in GP33+ subsets on days 21-30 p.i. (H-I) Representative flow plots (H) and summary data (I) showing relative expression of TFs in GP33+ subsets (J) Representative flow plots and summary data showing proportion of Ly108+, CX3CR1Ly108 and CX3CR1+ subsets degranulating (CD107a+) and producing IFN-γ or co-producing TNF-α and IFN-γ+ upon ex vivo GP33-41 stimulation. (K) Flow plot and summary data showing granzyme B expression in GP33+ subsets. (L) Summary data depicting relative cytotoxicity of Ly108+, CX3CR1 Ly108 and CX3CR1+ subsets against peptide-pulsed target EL4 cells. GP33-specific subsets were sort-purified on day 21 p.i. and cultured with target cells at a 5:1 ratio. Data (Mean+/− S.D. in E,G, I-K or Mean+/− S.E.M. in (L)) are from 3-8 mice and are representative of at least 3 independent experiments.*p<0.05 **p<0.01, ***p<0.0001. See also Figure S4.
Figure 3.
Figure 3.. CX3CR1+ CD8+ T cells are critical for control over chronic viral infection.
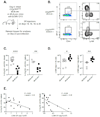
(A). Experimental design. (B) Representative flow plots and (C) summary data showing proportion of circulating or splenic CX3CR1+, Ly108+ and CX3CR1Ly108 CD8+T cell subsets in Cx3cr1DTR dLck-cre or Cx3cr1DTR dLck-cre+ mice on day 23 p.i. (D) Summary data showing GP copy number in the sera or spleen of experimental mice on d23 p.i. (E) Summary data showing inverse correlations between the proportion of CX3CR1+CD8+ T cells and viral burden in the spleen or blood. Data (Mean+/− S.E.M.) in (C-D) are pooled and are from 3-5 mice/group/experiment and are representative of at least 2 independent experiments.*p<0.05 **p<0.01 ***p<0.0001. See also Figure S5.
Figure 4.
Figure 4.. Lineage relationship between CD8+ T cell subsets.
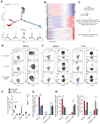
(A) Single cell trajectory of CD8+ T cell subsets present on day 30 p.i. (clusters 2, 3, 4, 5, and 6). (B) Heatmap showing expression of clusters 2, 4, and 6 markers used for trajectory analysis over pseudotime. (C-H) Experimental design (C) 60,000 CD45.2+CD44hi CD8 T cells from each subset (Ly108+, CX3CR1 Ly108 and CX3CR1+) were transferred to CD45.1 recipient mice. These mice were then infected with LCMV Cl13 one day later. (D-E) Representative flow plots showing expansion (left) and phenotype (right) of cells from the blood on day 9 p.i. (D) or spleen and liver (E) on day 21 p.i. (F-H) Summary of transferred cell frequency (F) and phenotype (G-H) in either the blood (G) or spleen and liver (H). Data (Mean+/− S.D. in (F-H)) are from 3-4 mice/group and are representative of 3 independent experiments.*p<0.05 **p<0.01 ***p<0.0001. See also Figure S6.
Figure 5.
Figure 5.. CD4+ T cell help via IL-21 is critical for the generation of CX3CR1+ CD8+ T cells.
(A) tSNE plot or violin plots highlighting the three major subsets of CD8 T cells during chronic LCMV infection, and their relative expression of Il21r. (B-C). Representative flow plots (B) and summary data (C) showing the CX3CR1+, Ly108+ or CX3CR1Ly108 subset distribution of GP33+CD8 T cells in the blood or spleen of control or CD4-depleted mice on day 21 p.i. (D) Experimental design (top); representative flow plots (bottom) and summary data (right) depicting the subset distribution of WT and Il21r−/− P14 cells on day 21 p.i. Data (Mean+/− S.E.M.) in (C-D) are pooled and are from 3-5 mice/group/experiment and are representative of at least 3 independent experiments.*p<0.05 **p<0.01 ***p<0.0001. See also Figure S7.
Figure 6.
Figure 6.. Blockade of PD-1-PD-L1 axis is insufficient to rescue the CX3CR1-differentiation defect of un-helped CD8+ T cells.
(A-F) Separate groups of control or CD4-depleted mice were infected with LCMV Cl13 and treated with isotype or anti-PD-L1 antibodies on days 16, 19, and 22 p.i. GP33+CD8 T cell responses were assessed on day 23 p.i. (A-B) Representative flow plots (A) and summary data (B-C) showing the proportion of splenic CD8 T cells (B) and their subset distribution (C). (D) Relative expression (gMFI) of T-bet to Eomes in GP33+CD8+ T cells from indicated experimental groups. (E) Summary graph showing the relative expression of inhibitory molecules on GP33+ cells from experimental mice. (F) Representative flow plots and summary data depicting the proportion of CD107a+IFN-γ+CD8 T cells upon ex vivo GP33-41 stimulation. (G) Summary data showing viremia in experimental mice on day 23 p.i. Data (Mean+/− S.E.M.) in (B-G) are pooled and are from 3 mice/group/experiment and are representative of at least 2 independent experiments.*p<0.05 **p<0.01 ***p<0.0001
Figure 7.
Figure 7.. Provision of IL-21+CD4 help enhances CX3CR1+ CD8+ T cell development and control over tumorgenesis
(A) Representative flow plots showing the %CX3CR1+, Ly108+ or CX3CR1Ly108 CD44hiCD8+ TILs responding to B16-F10 tumor and their relative expression of PD-1. (B) Experimental design. (C) Representative flow plots and summary data displaying the proportion and total number of CX3CR1+ TILs on day 8 post ACT. Summary data showing negative correlation (far right) between %CX3CR1+ TILs and tumor burden. (D) Tumor growth curves; of note summary data is from (n=6) IL-21 Th17 cell recipients and (n=8) IL-21+ Th17 cell recipients. IL-21 Th17 cell recipient mice that developed >30% of an IL-21+tRFP+ response (n=3) were excluded from the analysis (E) Representative flow plots and summary data displaying the %IL-21-tRFP+ CD4 T cells in the tumor at day 8 post-ACT. Summary data (right) showing inverse correlation between IL-21-tRFP+ CD4 T cells and tumor size. (F) Summary data showing positive correlation between IL-21+CD4+ T cell response and %CX3CR1+CD8+ TILs. (G) Experimental design. (H) Representative flow plots and summary data displaying the proportion and total number of CX3CR1+CD8+ TILs on day 8 post ACT. Summary data (bottom) showing inverse correlation between %CX3CR1+ TILs and tumor burden. Data (Mean+/− S.E.M.) in (C-E,H) are pooled and are from 3-5 mice/group/experiment and are representative of at least 2 independent experiments.*p<0.05 **p<0.01 ***p<0.0001

Comment in

Comment on

References

    1. Ahmadzadeh M, Johnson LA, Heemskerk B, Wunderlich JR, Dudley ME, White DE, and Rosenberg SA. 2009. 'Tumor antigen-specific CD8 T cells infiltrating the tumor express high levels of PD-1 and are functionally impaired', Blood, 114: 1537–44. - PMC - PubMed
    1. Barber DL, Wherry EJ, Masopust D, Zhu B, Allison JP, Sharpe AH, Freeman GJ, and Ahmed R. 2006. 'Restoring function in exhausted CD8 T cells during chronic viral infection', Nature, 439: 682–7. - PubMed
    1. Battegay M, Moskophidis D, Rahemtulla A, Hengartner H, Mak TW, and Zinkernagel RM. 1994. 'Enhanced establishment of a virus carrier state in adult CD4+ T-cell-deficient mice', J Virol, 68: 4700–4. - PMC - PubMed
    1. Blackburn SD, Shin H, Haining WN, Zou T, Workman CJ, Polley A, Betts MR, Freeman GJ, Vignali DA, and Wherry EJ. 2009. 'Coregulation of CD8+ T cell exhaustion by multiple inhibitory receptors during chronic viral infection', Nat Immunol, 10: 29–37. - PMC - PubMed
    1. Dominguez CX, Amezquita RA, Guan T, Marshall HD, Joshi NS, Kleinstein SH, and Kaech SM. 2015. 'The transcription factors ZEB2 and T-bet cooperate to program cytotoxic T cell terminal differentiation in response to LCMV viral infection', J Exp Med, 212: 2041–56. - PMC - PubMed

Publication types

Substances